. 2020 May 5:8:296.
doi: 10.3389/fcell.2020.00296. eCollection 2020.

Nephroprotective Potential of Mesenchymal Stromal Cells and Their Extracellular Vesicles in a Murine Model of Chronic Cyclosporine Nephrotoxicity

Affiliations

Nephroprotective Potential of Mesenchymal Stromal Cells and Their Extracellular Vesicles in a Murine Model of Chronic Cyclosporine Nephrotoxicity

María José Ramírez-Bajo et al. Front Cell Dev Biol. .

Abstract

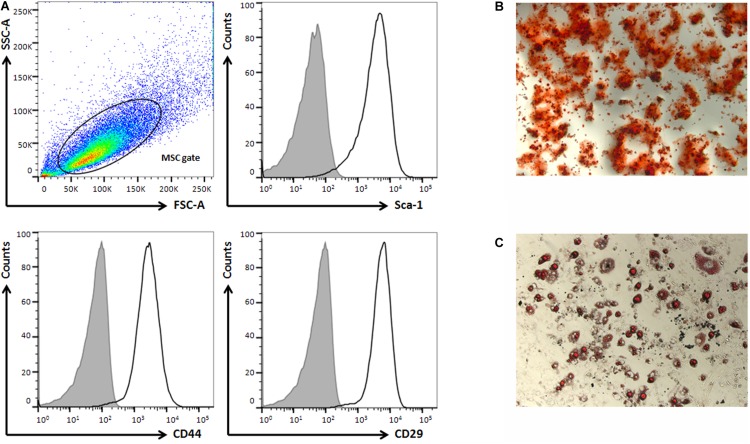
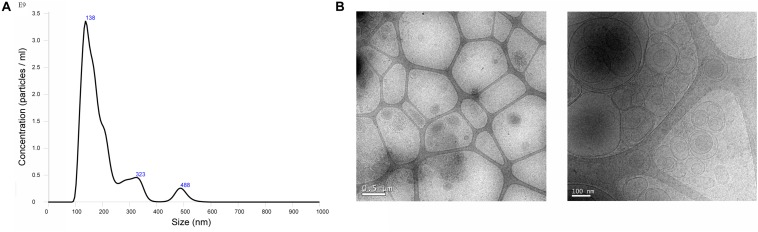
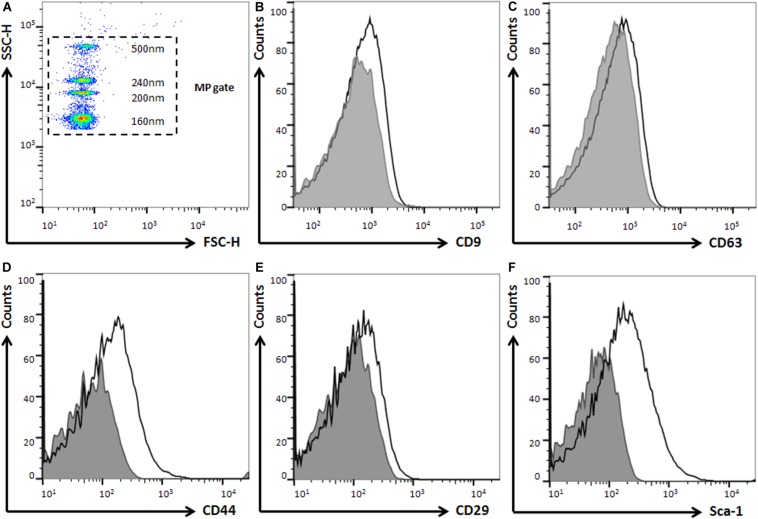
Background: Cell therapies and derived products have a high potential in aiding tissue and organ repairing and have therefore been considered as potential therapies for treating renal diseases. However, few studies have evaluated the impact of these therapies according to the stage of chronic kidney disease. The aim of this study was to evaluate the renoprotective effect of murine bone marrow mesenchymal stromal cells (BM-MSCs), their extracellular vesicles (EVs) and EVs-depleted conditioned medium (dCM) in an aggressive mouse model of chronic cyclosporine (CsA) nephrotoxicity in a preventive and curative manner.

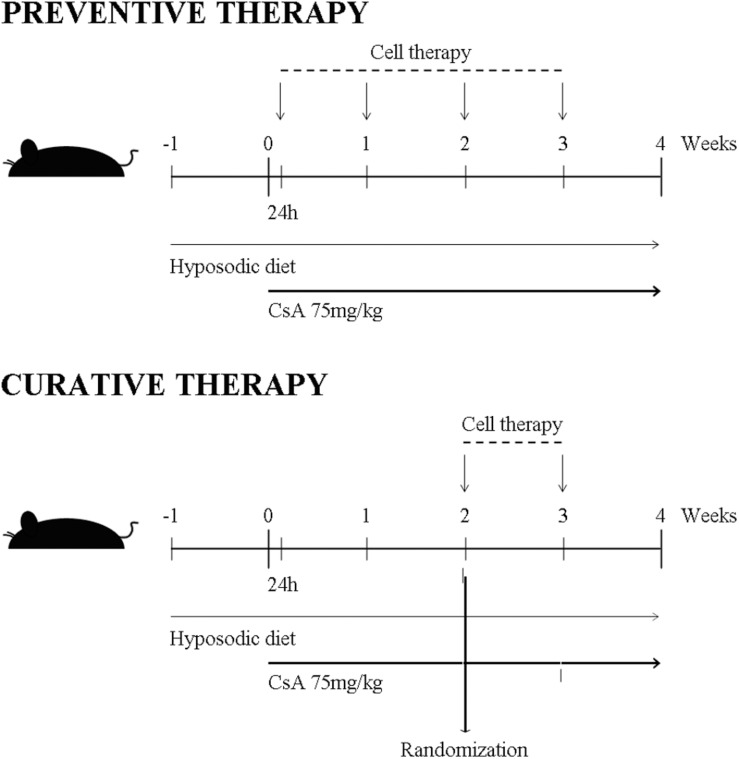
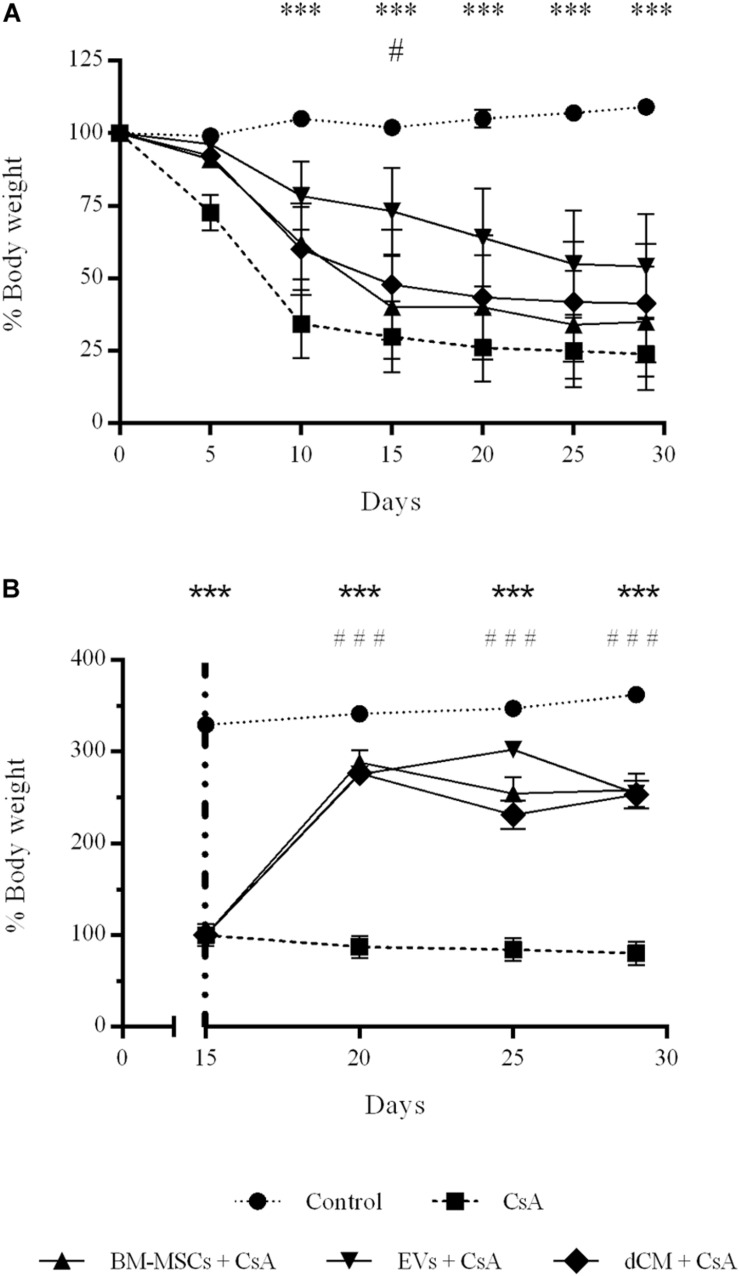
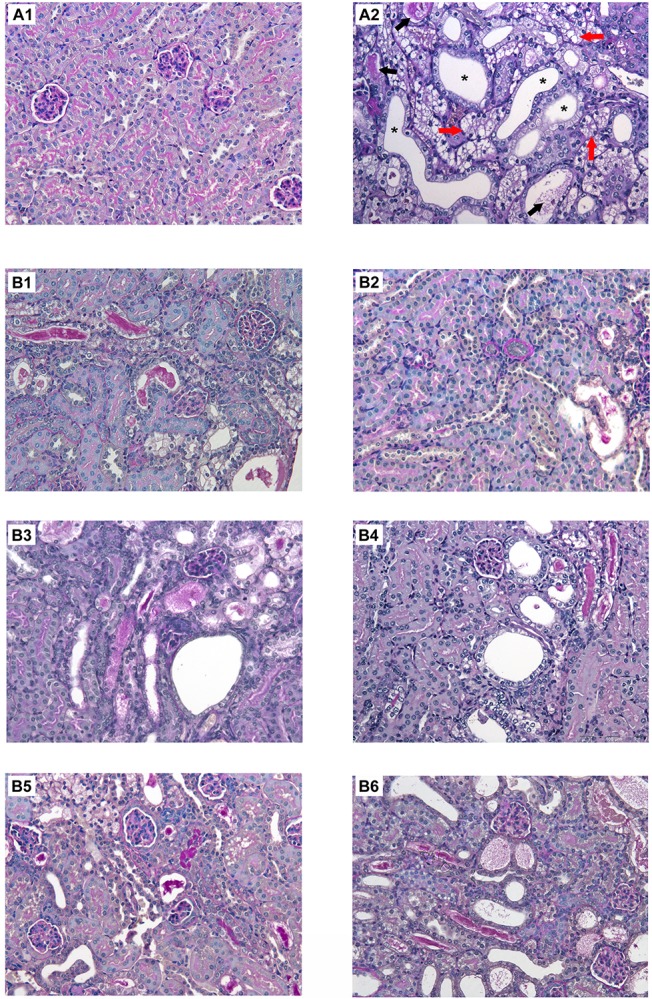
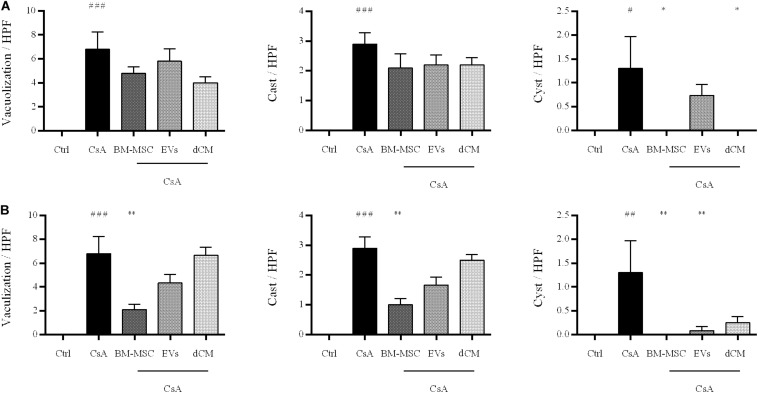
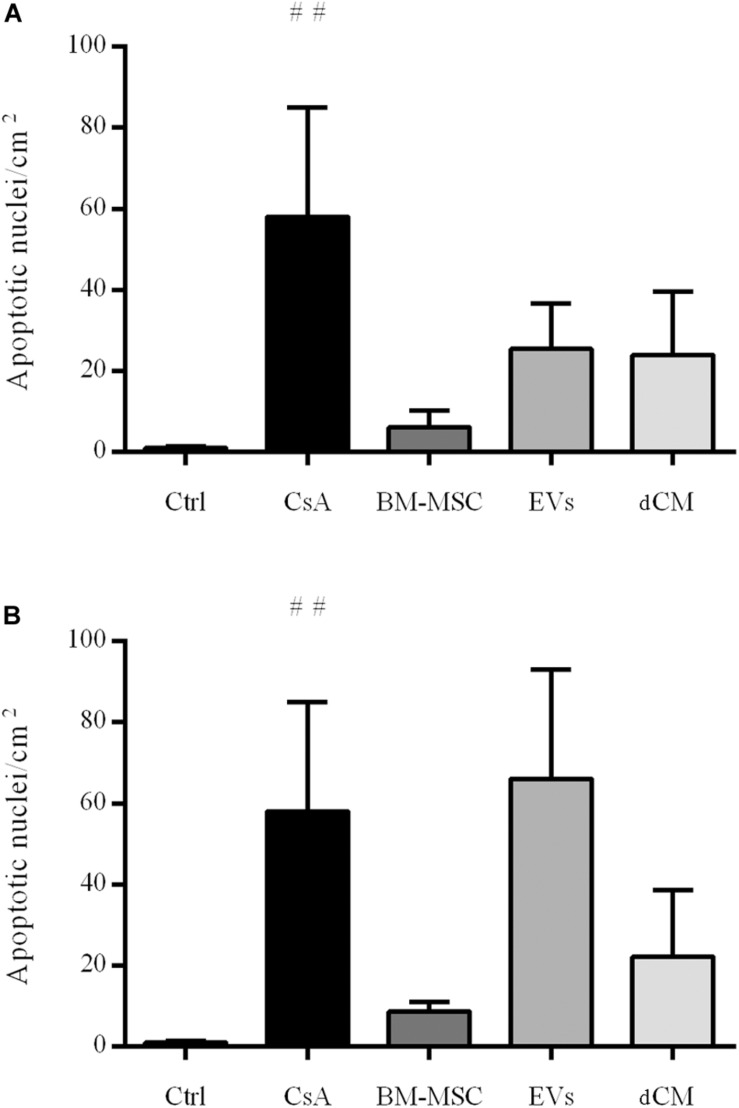
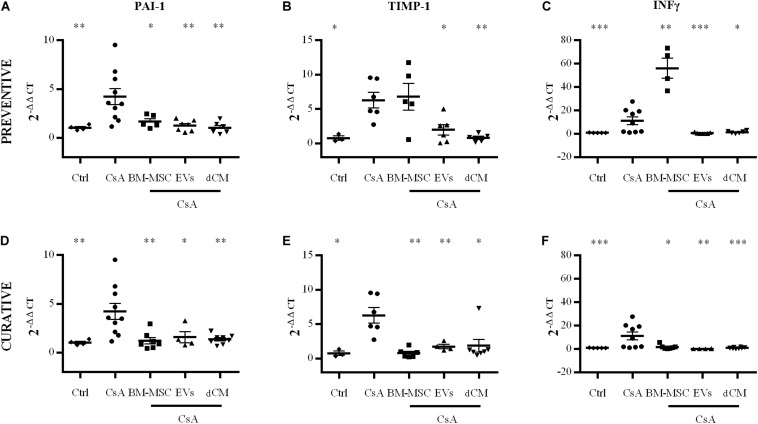
Methods: After 4 weeks of CsA-treatment (75 mg/kg daily) mice developed severe nephrotoxicity associated with a poor survival rate of 25%, and characterized by tubular vacuolization, casts, and cysts in renal histology. BM-MSC, EVs and dCM groups were administered as prophylaxis or as treatment of CsA nephrotoxicity. The effect of the cell therapies was analyzed by assessing renal function, histological damage, apoptotic cell death, and gene expression of fibrotic mediators.

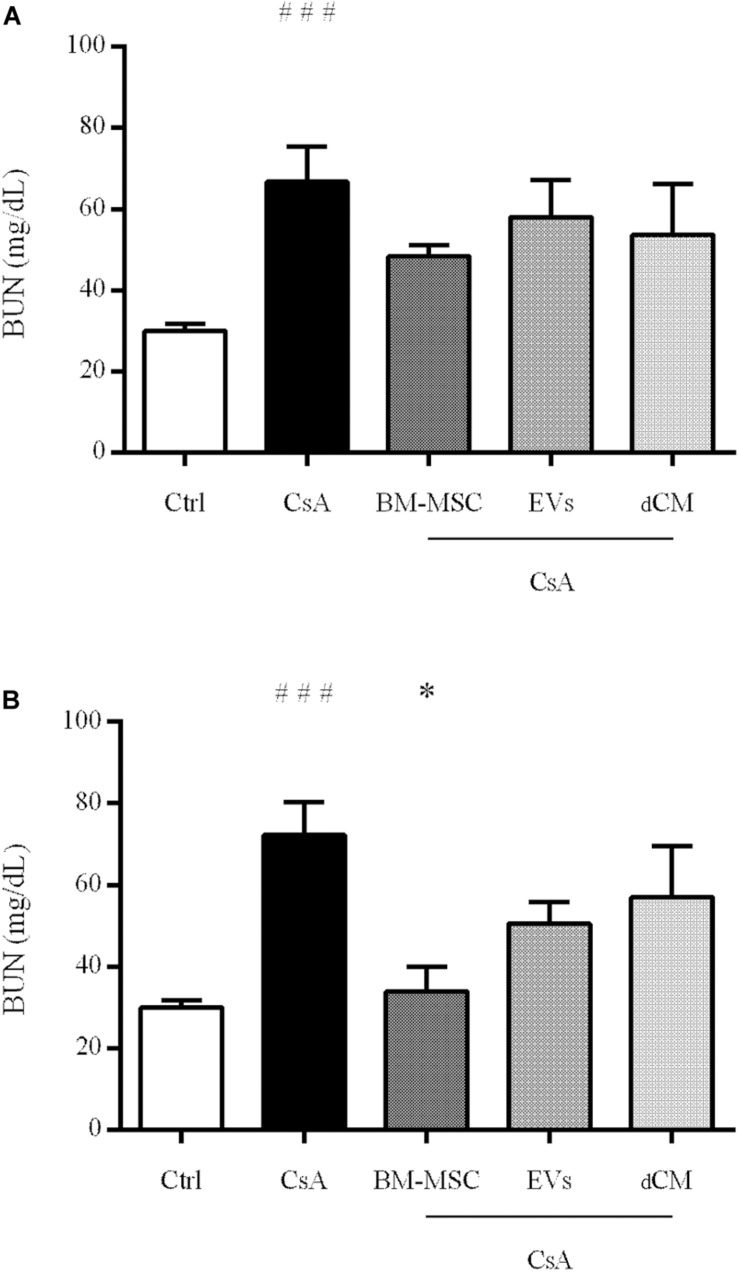
Results: Combined administration of CsA and BM-MSCs ameliorated the mice survival rates (6-15%), but significantly renal function, and histological parameters, translating into a reduction of apoptosis and fibrotic markers. On the other hand, EVs and dCM administration were only associated with a partial recovery of renal function or histological damage. Better results were obtained when used as treatment rather than as prophylactic regimen i.e., cell therapy was more effective once the damage was established.

Conclusion: In this study, we showed that BM-MSCs induce an improvement in renal outcomes in an animal model of CsA nephrotoxicity, particularly if the inflammatory microenvironment is already established. EVs and dCM treatment induce a partial recovery, indicating that further experiments are required to adjust timing and dose for better long-term outcomes.

Keywords: bone marrow mesenchymal stem cells; conditioned medium; cyclosporine A; extracellular vesicles; nephrotoxicity.


Figures

FIGURE 1
FIGURE 1
Scheme of BM-MSCs, their EVs and dCM administration as preventive and curative regiments in an in vivo model of CsA nephrotoxicity. In preventive treatment, cell therapies (BM-MSCs, EVs and dCM) were provided once per week intraperitoneal along 4 weeks. In curative treatment, cell therapies were provided later on 2 weeks after CsA challenges and subsequent kidney damage; therapeutic doses were provided together with CsA once per week completing the 4-week endpoint.
FIGURE 2
FIGURE 2
Murine BM-MSCs characterization by phenotype and multilineage differentiation. (A) Flow cytometry analysis of surface stem cells markers (Sca-1, CD44 and CD29). (B) Osteogenic, and (C) adipogenic differentiation showed positivity for alzarin red S and oil red O staining, respectively. (400× magnification).
FIGURE 3
FIGURE 3
Characterization of BM-EVs by NTA and electron microscopy. (A) NTA measurement shows the concentration and size distribution. The mean size of EVs was 196.7 ± 87.8 nm. (B) Representative cryo-electron microscopy images of EVs. Images from cryo-electron microscopy (scale bars 0.5 and 0.1 μm).
FIGURE 4
FIGURE 4
Characterization of EVs by flow cytometry. (A) Representative microparticle analysis showing Megamix-Plus SSC as internal size standards (160, 200, 240 and 500 nm). (B,C) Positive expression of tetraspanins as EVs markers: CD63 and CD9. (D–F) Positive expression of mesenchymal markers: CD44, CD29, and Sca-1. Shaded gray represents isotype as negative controls.
FIGURE 5
FIGURE 5
Impact of CsA-induced nephrotoxicity on mice body weight recorded weekly during the model. (A) Preventive treatment. (B) Curative treatment. (CsA, n = 70), (BM-MSCs, n = 35), (EVs, n = 34), and (dCM, n = 16) *Significantly different when compared CsA versus control group (∗∗∗P < 0.001). #Significantly different when compared CsA versus treatment groups (#P < 0.05). Data are expressed as mean ± SEM. One-way analysis of variance (ANOVA) followed by Dunnett’s multiple comparisons test was used to compare group’s means.
FIGURE 6
FIGURE 6
Representation of BUN (mg/dL) levels in mice with nephrotoxicity induced by CsA after different regimens of cell therapy (BM-MSC, EVs and dCM). (A) After 4 weeks of preventive treatment. (B) After 4 weeks of curative treatment. (n = 6 per group). #Significantly different compared to Control group (###P < 0.001). *Significantly different compared to CsA (P < 0.05). Data are expressed as mean ± SEM. One-way analysis of variance (ANOVA) followed by Dunnett’s multiple comparisons test was used to compare group’s means.
FIGURE 7
FIGURE 7
Histological changes in renal sections stained with PAS from mice with CsA-induced nephrotoxicity with or without different regimens of cell therapy (BM-MSC, EVs and dCM). (A) Representative micrographs of kidney histology of healthy C57BL/6 mice treated with castor oil as control group (A1) and mice treated with CsA (75mg/kg daily) indicating tubular vacuolization (red arrow), hyaline casts (black arrow) and cysts (asterisks) (A2). (B) Preventive treatments of CsA nephrotoxicity with BM-MSC (B1), EVs (B3), and dCM (B5); curative treatments of CsA nephrotoxicity with BM-MSC (B2), EVs (B4), and dCM (B6). PAS staining. Original Magnification: x200.
FIGURE 8
FIGURE 8
Quantitative evaluation of renal histological injury in renal sections stained with PAS after administration of BM-MSC, EVs, and dCM. Quantification of casts, tubular vacuolization and cysts per HPF in mice with (A) preventive treatment, and (B) curative treatment (n = 5 per group). Original Magnification: x200. #Significantly different compared to Control group (#P < 0.05; ##P < 0.01; ###P < 0.001). *Significantly different compared to CsA (*P < 0.05; **P < 0.01). Data are expressed as mean ± SEM. One-way analysis of variance (ANOVA) followed by Dunnett’s multiple comparisons test was used to compare group’s means.
FIGURE 9
FIGURE 9
Impact of cell therapies on the apoptosis in CsA-induced nephrotoxicity. The quantification of apoptotic-positive nuclei per cm2 was performed by TUNEL staining. (A) Preventive treatment. (B) Curative treatment. (n = 5 per group). #Significantly different compared to Control group (#P < 0.05). Data are expressed as mean ± SEM. One-way analysis of variance (ANOVA) followed by Dunnett’s multiple comparisons test was used to compare group’s means.
FIGURE 10
FIGURE 10
Impact of cell therapies on the expression of renal fibrosis markers, PAI-1, TIMP-1, and IFN-γ in CsA-induced nephrotoxicity. The quantification of gene expression was evaluated by real-time PCR using the 2−ΔΔCt method and normalizing with HPRT as the endogenous control. (A) Preventive treatment. (B) Curative treatment. (n = 6 per group). * Significantly different compared to CsA group (*P < 0.05; **P < 0.01; ***P < 0.001). Data are expressed as mean ± SEM. Unpaired Student’s t-test was used for statistical analysis.

References

    1. Aghajani Nargesi A., Lerman L. O., Eirin A. (2017). Mesenchymal stem cell-derived extracellular vesicles for kidney repair: current status and looming challenges. Stem Cell Res. Ther. 8:273. 10.1186/s13287-017-0727-7 - DOI - PMC - PubMed
    1. Bennett W. M., DeMattos A., Meyer M. M., Andoh T., Barry J. M. (1996). Chronic cyclosporine nephropathy: the Achilles’ heel of immunosuppressive therapy. Kidney Int. 50 1089–1100. - PubMed
    1. Bi B., Schmitt R., Israilova M., Nishio H., Cantley L. G. (2007). Stromal cells protect against acute tubular injury via an endocrine effect. J. Am. Soc. Nephrol. 18 2486–2496. - PubMed
    1. Bruno S., Grange C., Deregibus M. C., Calogero R. A., Saviozzi S., Collino F., et al. (2009). Mesenchymal stem cell-derived microvesicles protect against acute tubular injury. J. Am. Soc. Nephrol. 20 1053–1067. 10.1681/ASN.2008070798 - DOI - PMC - PubMed
    1. Burdmann E. A., Andoh T. F., Rosen S., Lindsley J., Munar M. Y., Elzinga L. W., et al. (1994). Experimental nephrotoxicity, hepatotoxicity and pharmacokinetics of cyclosporin G versus cyclosporin A. Kidney Int. 45 684–691. - PubMed