. 2020 Jul;251(3):336-347.
doi: 10.1002/path.5469. Epub 2020 Jun 15.

Trop2 is upregulated in the transition to dysplasia in the metaplastic gastric mucosa

Affiliations

Trop2 is upregulated in the transition to dysplasia in the metaplastic gastric mucosa

Katherine M Riera et al. J Pathol. 2020 Jul.

Abstract

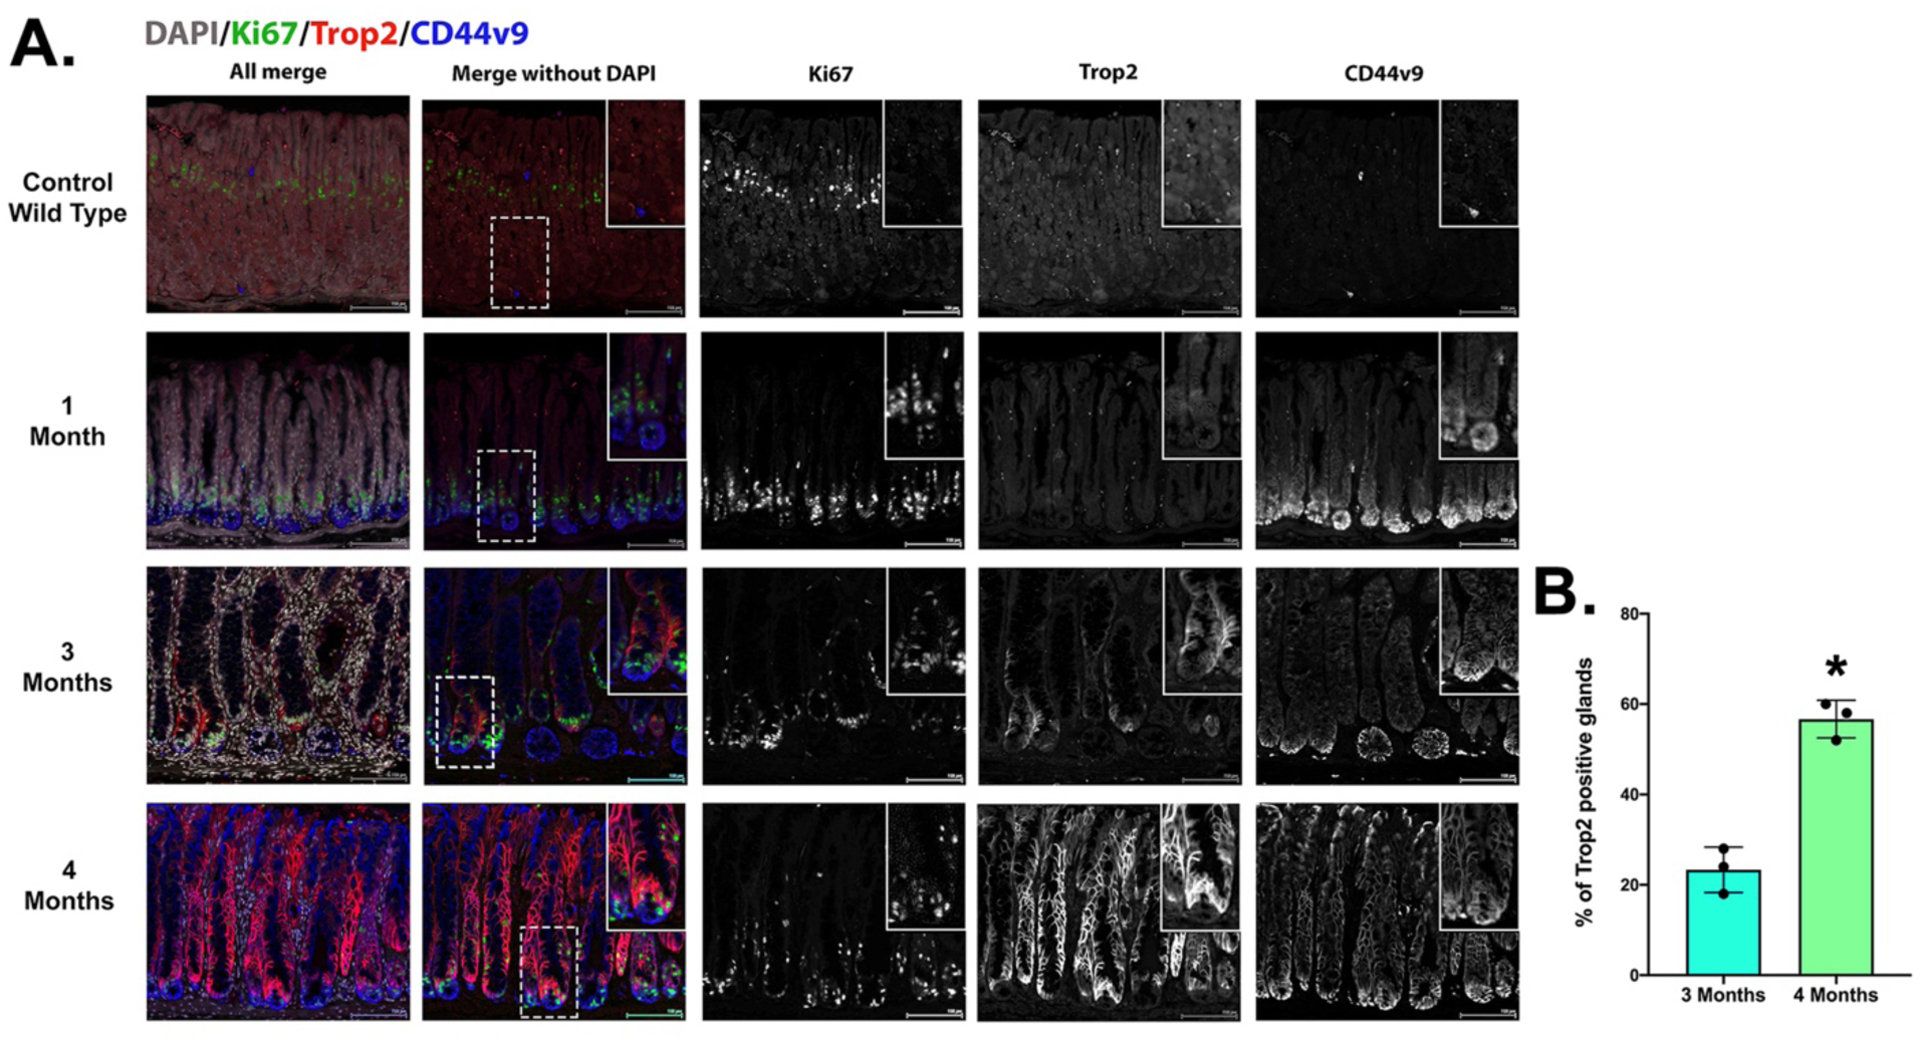
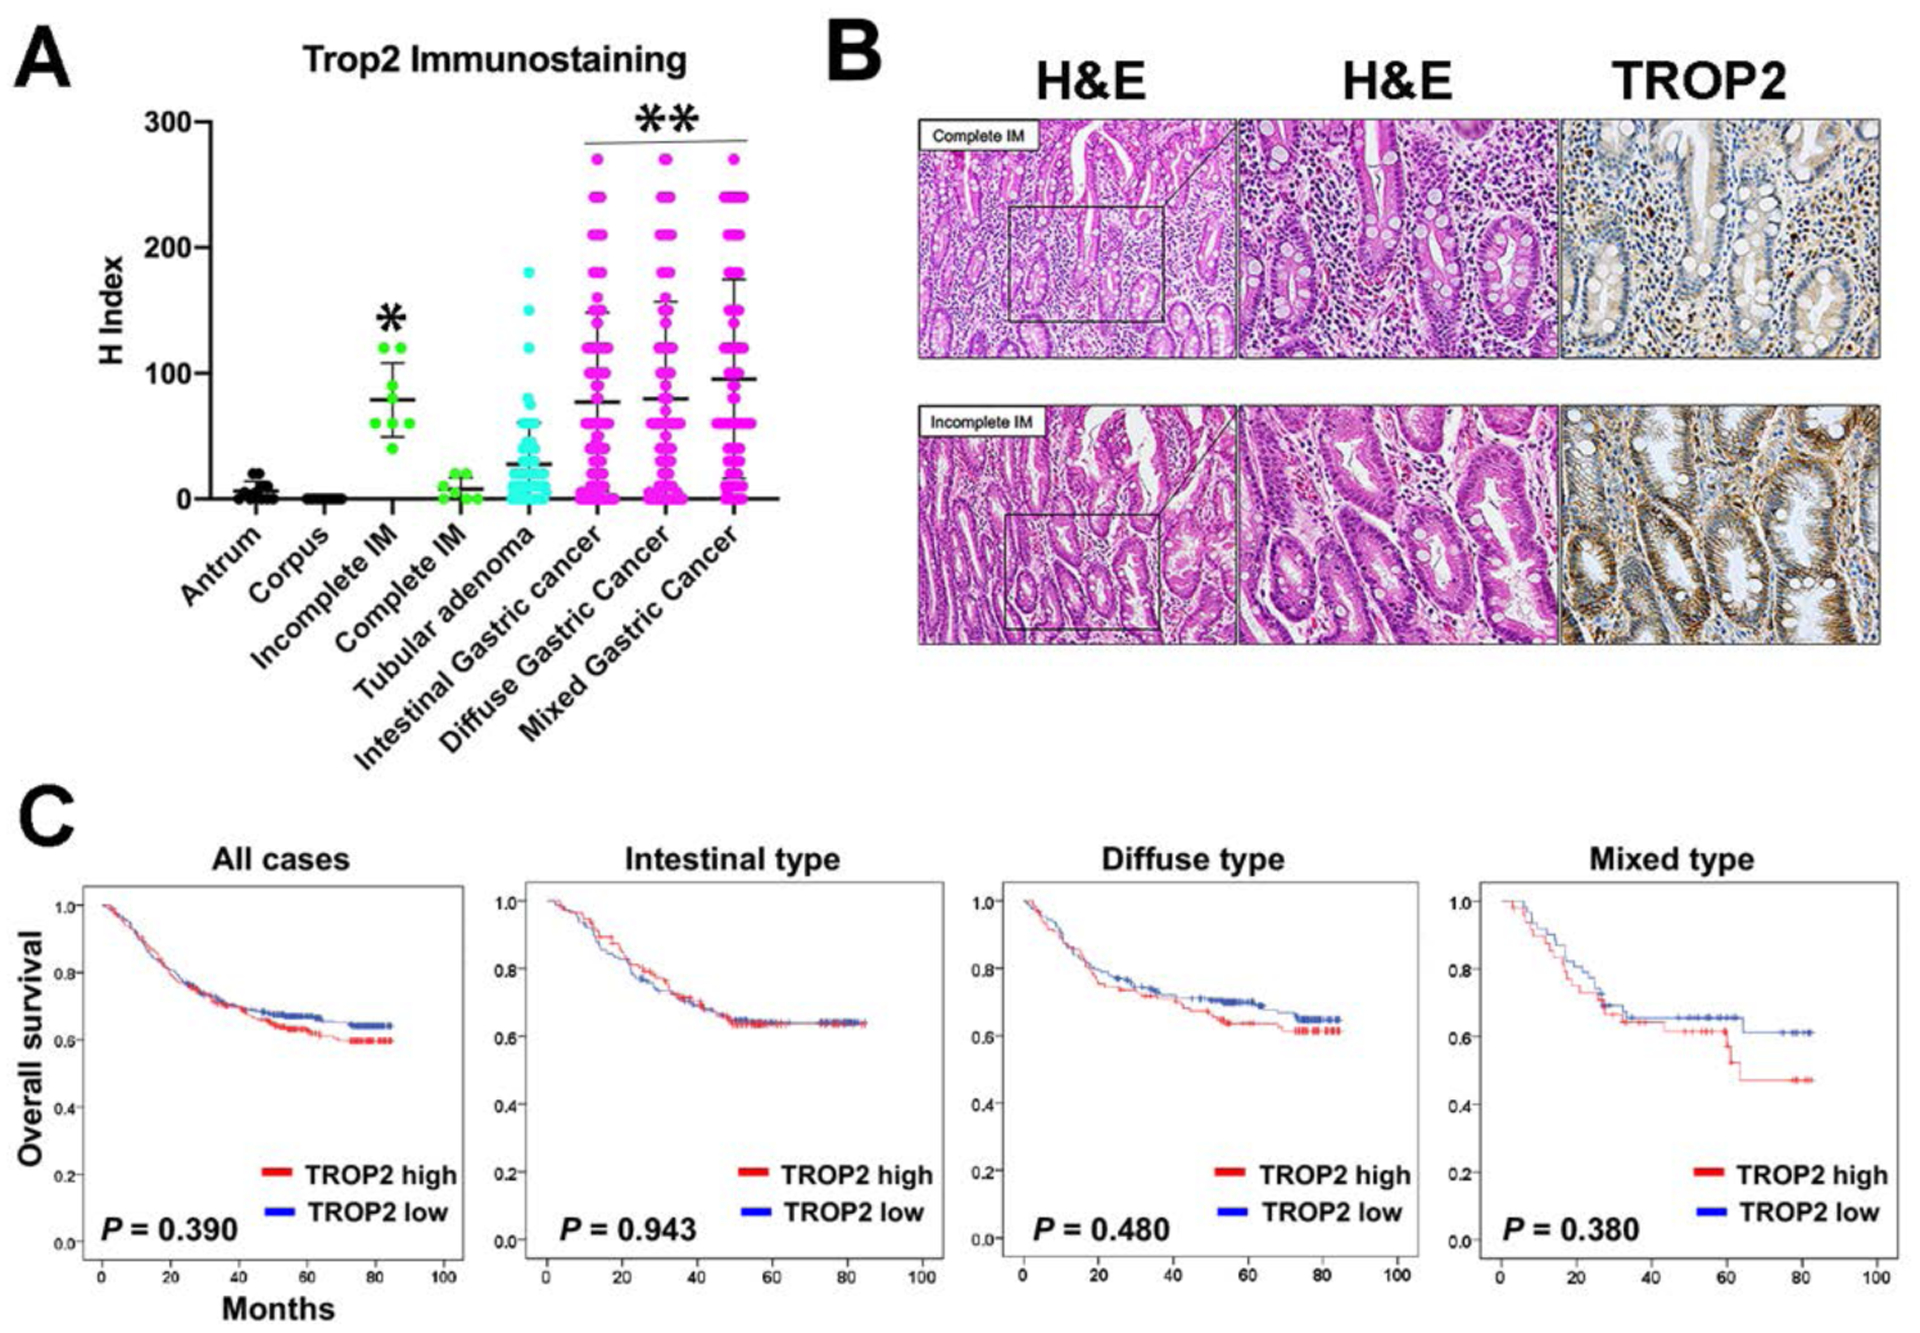
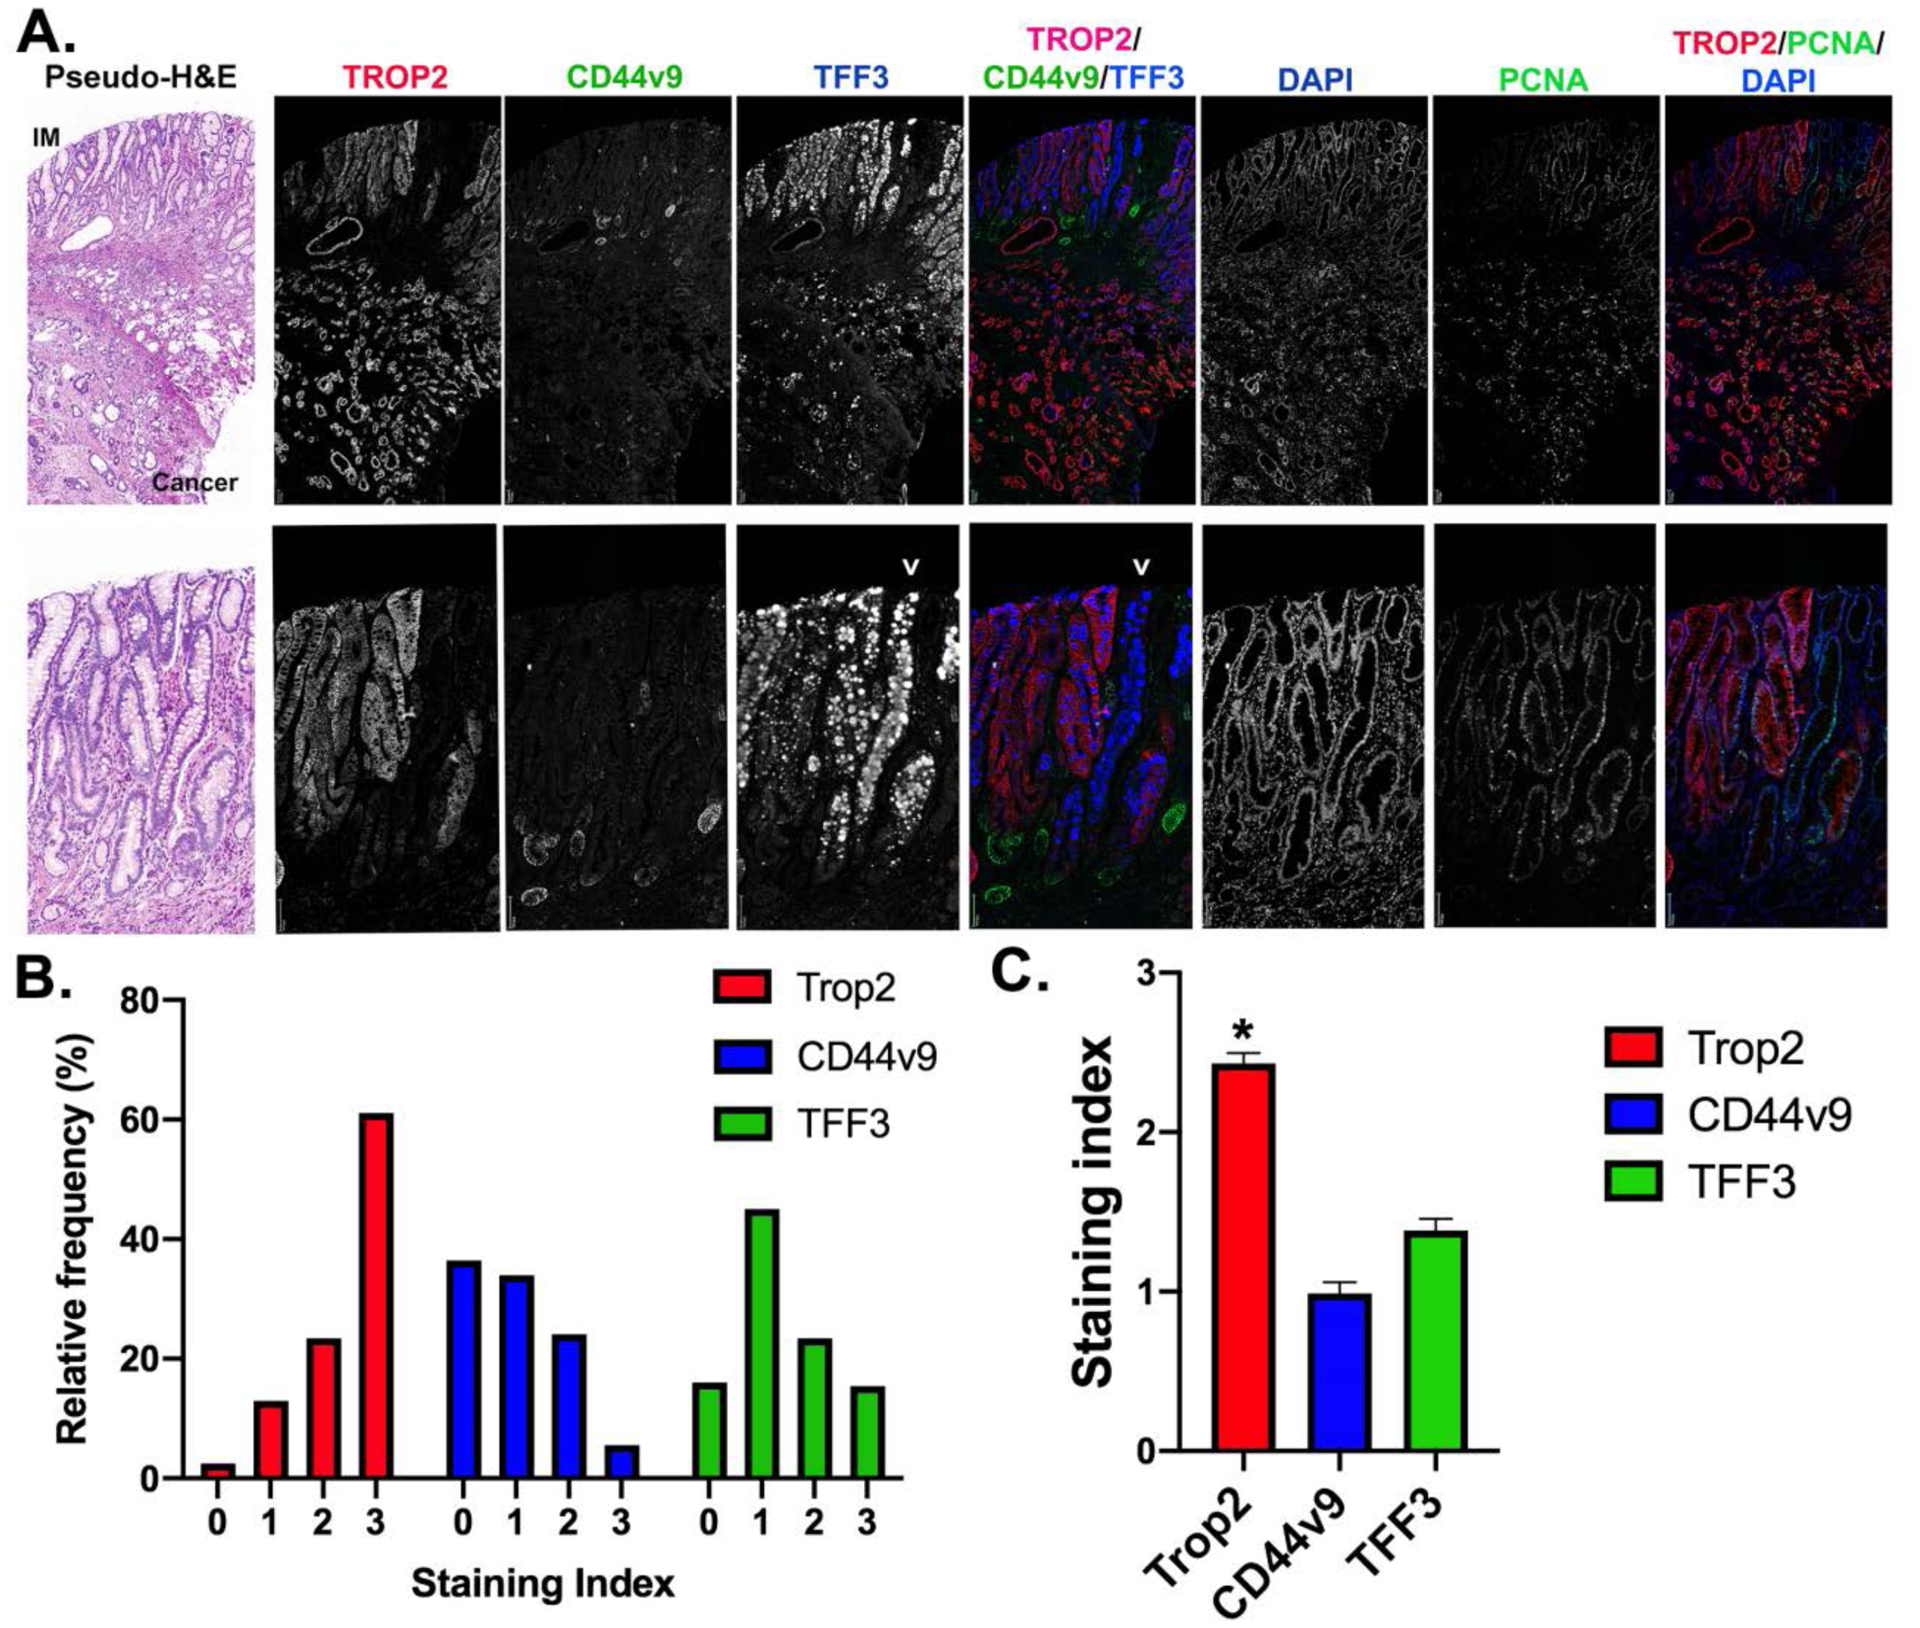
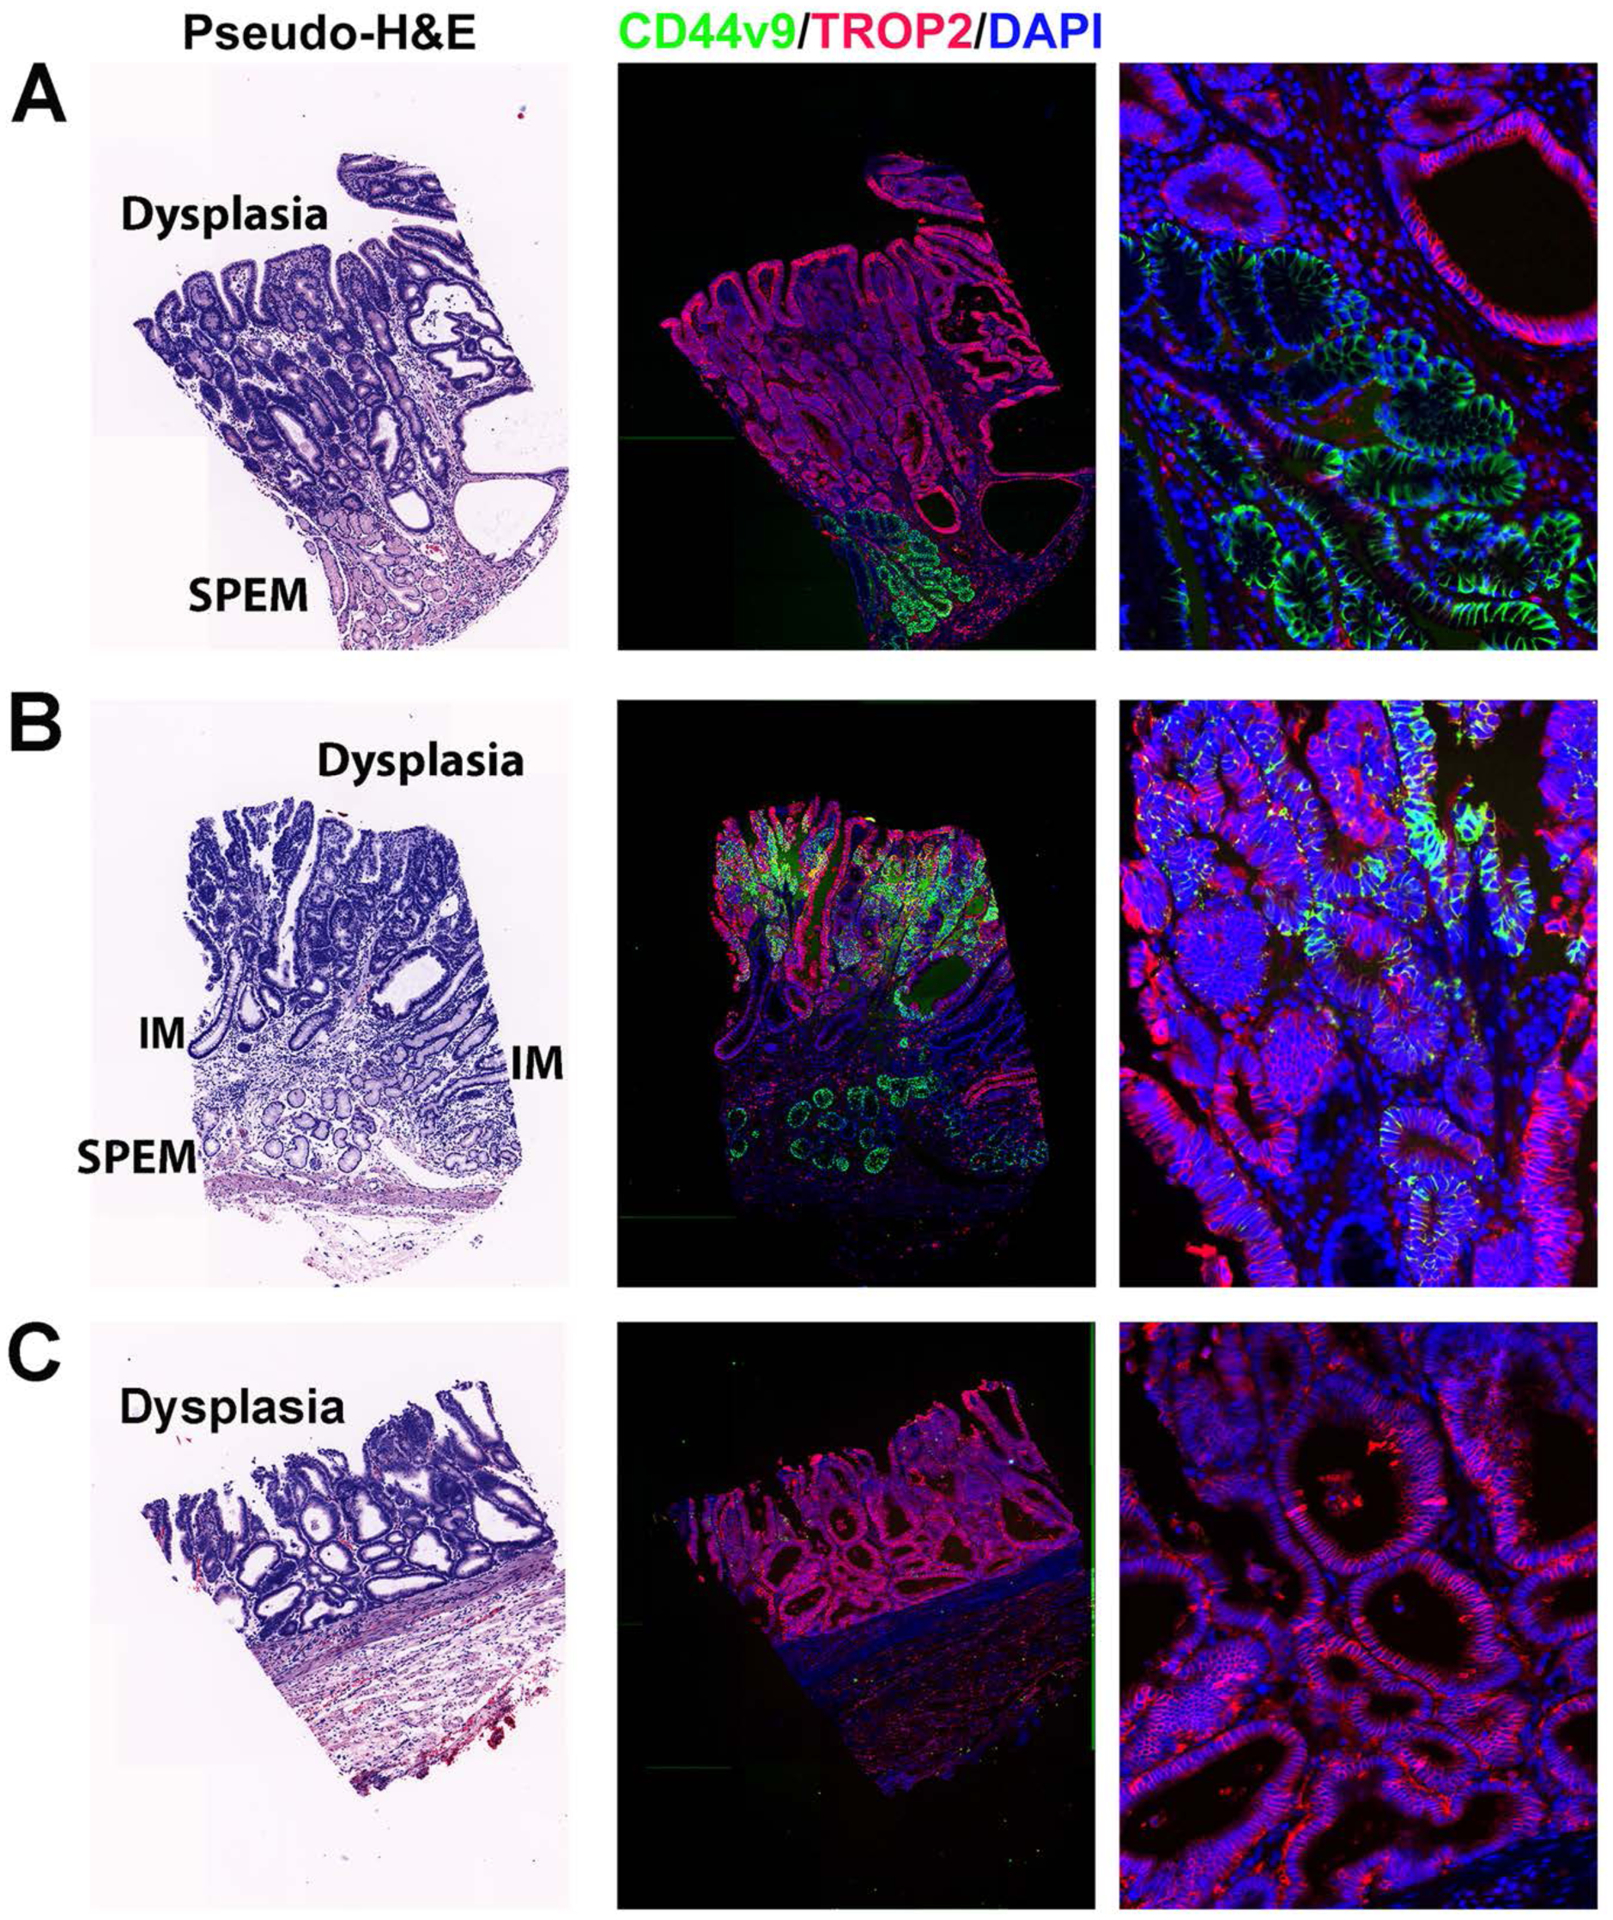
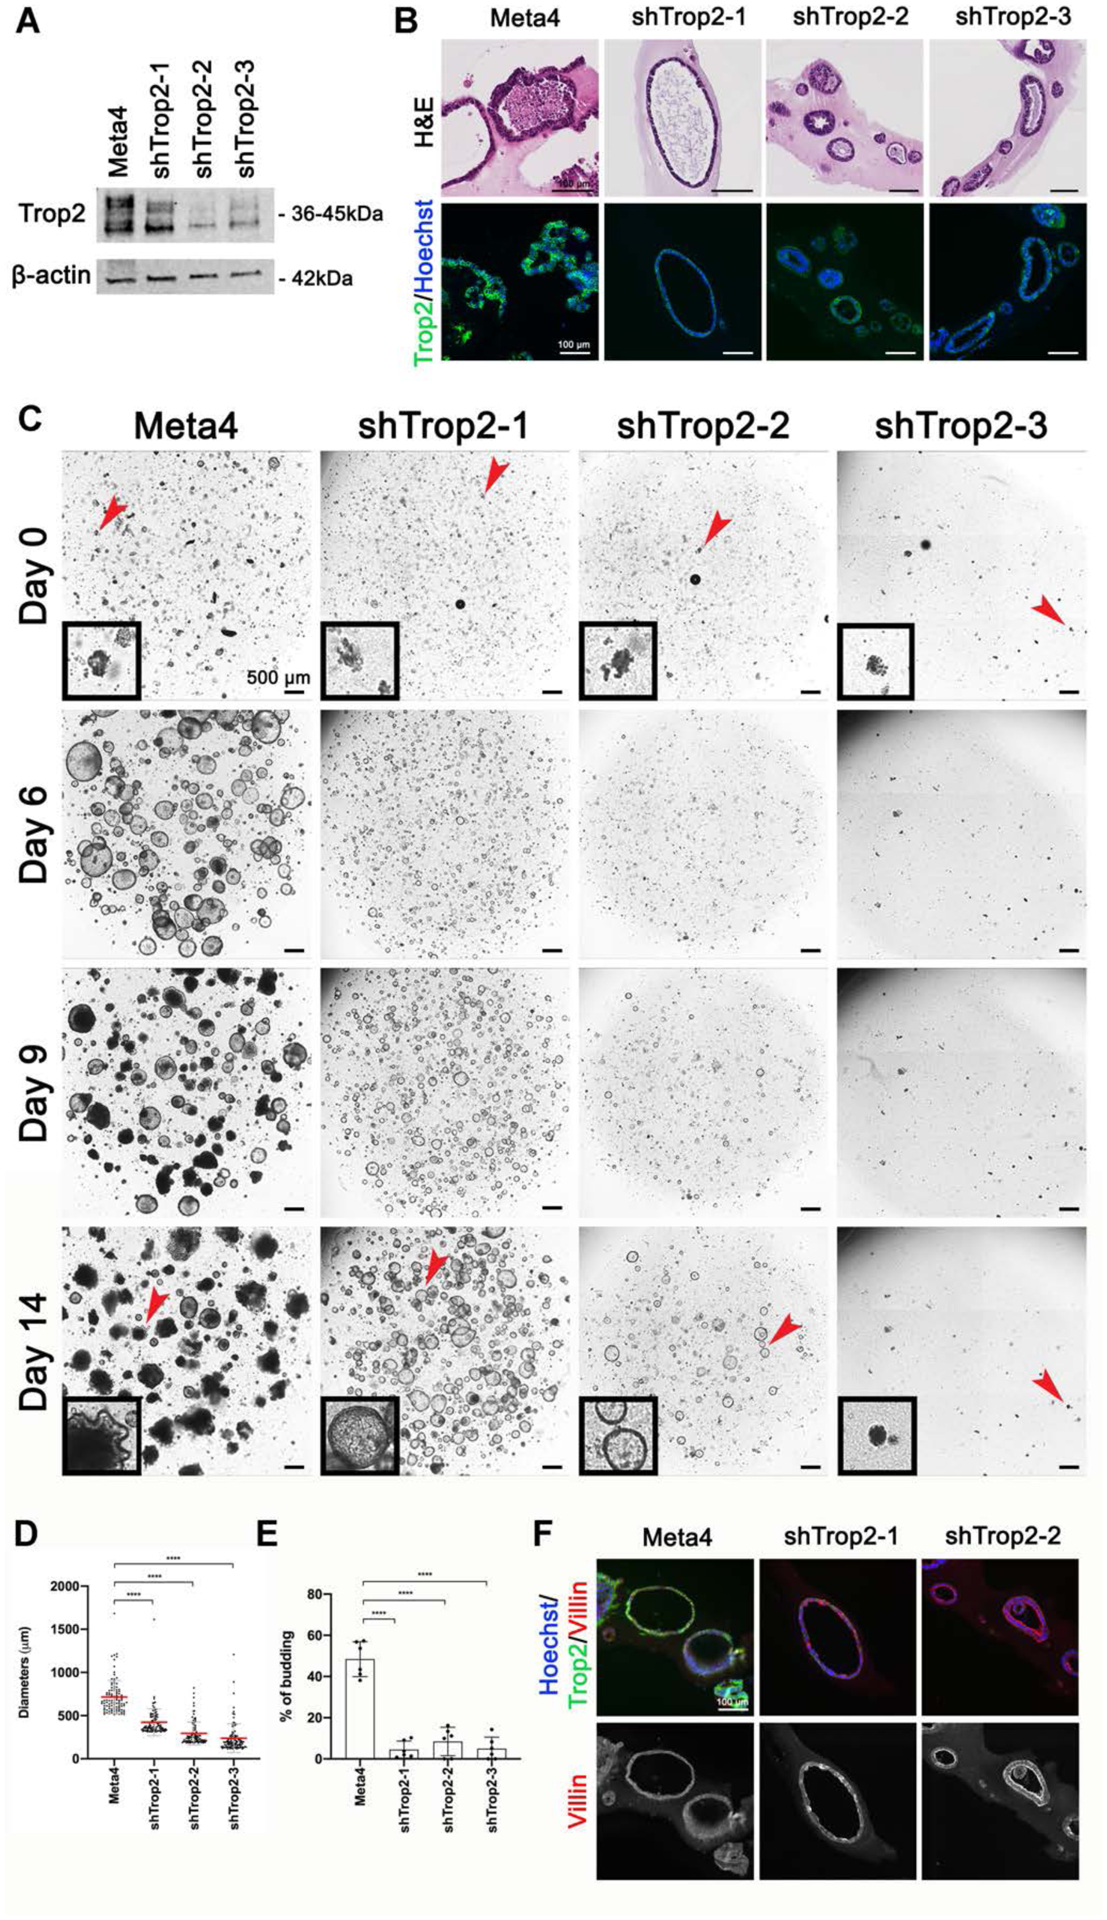
Intestinal-type gastric adenocarcinoma arises in a field of pre-existing metaplasia. While biomarkers of cancer and metaplasia have been identified, the definition of dysplastic transition as a critical point in the evolution of cancer has remained obscure. We have evaluated Trop2 as a putative marker of the transition from metaplasia to dysplasia in the stomach in multiple mouse models of metaplasia induction and progression. In addition, TROP2 expression was evaluated in human samples by immunostaining tissue microarrays for metaplasia, dysplasia, and gastric cancer. Dysplastic mouse organoids were evaluated in vitro following shRNA knockdown of Trop2 expression. In mouse models, no Trop2 was observed in the normal corpus and Trop2 was not induced in acute models of metaplasia induction with either L635 or DMP-777. In Mist1-Kras mice, Trop2 expression was not observed in metaplasia at 1 month after Kras induction, but was observed in dysplastic glands at 3-4 months after Kras induction. In human tissues, no Trop2 was observed in normal corpus mucosa or SPEM, but Trop2 expression was observed in incomplete intestinal metaplasia, with significantly less expression in complete intestinal metaplasia. Trop2 expression was observed in all dysplastic and 84% of gastric cancer lesions, although expression levels were variable. Dysplastic mouse organoids from Mist1-Kras mice expressed Trop2 strongly. Knockdown of Trop2 with shRNA markedly reduced organoid growth and budding behavior, and induced the upregulation of apical villin expression. We conclude that Trop2 is upregulated in the transition to dysplasia in the stomach and promotes dysplastic cell behaviors. © 2020 Pathological Society of Great Britain and Ireland. Published by John Wiley & Sons, Ltd.

Keywords: CD44 variant 9; SPEM; Tacstd2; dysplasia; gastric cancer; intestinal metaplasia; metaplasia.


Conflict of interest statement

Disclosures: The authors have no conflicts of interest.

Figures

Figure 1:
Figure 1:. Trop2 expression is up-regulated 3 to 4 months after induction of Kras(G12D) expression in Mist1-Kras mice.
A. Sections of mouse stomach from uninduced Mist1-Kras mice (Control Wild type) and mice 1, 3 and 4 months after Kras(G12D) induction with tamoxifen treatment were stained for CD44v9 (blue), Ki67 (green) and Trop2 (red) along with nuclear staining with DAPI (greyscale). Scale bar = 100 μm. B. The percentage of glands with Trop2 positive cells was quantified (50 glands per mouse) in the corpus of Mist1-Kras mice 3 or 4 months after tamoxifen induction (n=3 mice). No glands were positive in mice (n=3) at 1 month after induction. Data are shown as mean±S.D. *<0.05 by Mann-Whitney U.
Figure 2:
Figure 2:. TROP2 expression is higher in incomplete intestinal metaplasia (IM), adenoma and cancer.
A. Tissue arrays containing normal, metaplastic, adenomatous and cancer lesions were stained with antibodies against TROP2 with immunohistochemistry: antrum (n = 11), corpus (n = 13), incomplete IM (n = 8), complete IM (n = 7), tubular adenoma (n = 71), intestinal type gastric cancer (n = 289), diffuse type gastric cancer (n = 334), mixed type gastric cancer (n = 111). Staining was quantified for each core by histology index (H Index). Data are shown for mean±SD. Significance by Tukey’s test was *p<0.01 versus normal or complete intestinal metaplasia; **p<0.001 versus all non-cancer samples. B. Examples of TROP2 immunostaining in complete and incomplete IM. Serial sections were stained with hematoxylin and eosin (H&E) and TROP2 immunohistochemistry. Higher magnification of the delineated region is shown for hematoxylin and eosin and TROP2 immunohistochemistry (far right). Basolateral TROP2 staining was prominently present in incomplete IM, but was absent in complete IM. C. Kaplan-Meyer survival curves for gastric cancers based on TROP2 staining.
Figure 3:
Figure 3:. Expression of TROP2 in a cancer, dysplastic lineages and IM.
A. representative core from tissue microarrays of early gastric cancers. The slides were stained for TROP2 (red), CD44v9 (green) and TFF3 (blue) as well as PCNA (green) and DAPI (blue). Single channel images are shown in grayscale for all, with triple composite overlays as noted. Higher magnification images are shown in the second row. A pseudo-H&E image is shown at the left. Arrowhead marks the position of a gland with intestinal metaplasia and strong TFF3 staining goblet cells without TROP2 expression, while the TFF3 expressing glands to the left have small granules and strong TROP2 staining. Bars = 100 μm. B and C. Staining indexes for TROP2, CD44v9 and TFF3 were calculated for 166 early gastric cancer cores represented on the arrays. B. Data are represented showing the distribution of staining index for each of the three markers. C. Date are represented as mean±SEM for each of the markers. The staining for TROP2 in the early cancers was significantly higher than for either TROP2 or CD44v9 (*p<0.001).
Figure 4:
Figure 4:. Expression of TROP2 in human metaplasia and dysplasia.
Representative staining of cores from tissue microarrays of samples of intramucosal dysplasia. Slides were stained for TROP2 (red), CD44v9 (green) and DAPI (blue). A higher magnification image is shown at the right. A pseudo-H&E stain image is shown at the left. Regions of dysplasia, SPEM and IM are noted in the H&E. A. An example of TROP2-positive dysplasia arising above CD44v9-positive SPEM. B. A rare case of TROP2-positive dysplasia observed in only 1 out of 60 cores that also showed strong positivity for CD44v9. C. An example of intramucosal dysplasia that is positive for only TROP2.
Figure 5:
Figure 5:. Knockdown of Trop2 in dysplastic organoids decreases growth and normalizes morphology.
A. Western blot for Trop2 demonstrates strong expression of Trop2 in Meta4 organoids, with decreased expression in organoids lines stably infected with 3 different shRNA lentiviral vectors (shTrop2–1, shTrop2–2 and shTrop2–3). B. Representative H&E stains and immunofluorescence staining for Trop2 (green) and Hoechst nuclear stain (blue) in Meta4 organoids, shTrop2–1, shTrop2–2 and shTrop2–3. Bar = 100 μm. Note the growth of knockdown organoids as single layer spheres compared with the complex multilayered structures in Meta4 organoids. C. Phase contrast imaging of live Meta4 and shRNA Trop2 knockdown organoids growing in Matrigel culture for 0, 6, 9 and 14 days. Note the reduced growth and budding formation in the Trop2 knockdown organoids, shTrop2–1, shTrop2–2 and shTrop2–3. Black box insets display a representative organoid at Day 0 and 14. Red arrowheads indicate enlarged area. Bar = 500 μm. D. Diameters (μm) of Meta4 (n=100), shTrop2–1 (n=100), shTrop2–2 (n=100) and shTrop-3 (n=77) measured after 14 days in 3D cultures. Data are shown for mean ± SD. The p values were calculated using Mann-Whitney test. ****p<0.0001. E. Quantitation of the average budding rate in Meta4 organoids and the 3 shRNA Trop2 knockdown organoid lines, shTrop2–1, shTrop2–2 and shTrop2–3, after 14 days in 3D cultures. Data are shown for mean ± SD. The p values were calculated using unpaired t-test. ****p<0.0001. F. Immunofluorescence staining for Trop2 (green), Villin (red) and Hoechst nuclear stain (blue) in Meta4, shTrop2–1 and shTrop2–2 organoids. Bar = 100 μm.

References

    1. Ferlay J, Soerjomataram I, Dikshit R, et al. Cancer incidence and mortality worldwide: sources, methods and major patterns in GLOBOCAN 2012. Int J Cancer 2015; 136: E359–386. - PubMed
    1. Bray F, Ferlay J, Soerjomataram I, et al. Global cancer statistics 2018: GLOBOCAN estimates of incidence and mortality worldwide for 36 cancers in 185 countries. CA: a cancer journal for clinicians 2018; 68: 394–424. - PubMed
    1. Correa P, Piazuelo MB. The gastric precancerous cascade. Journal of digestive diseases 2012; 13: 2–9. - PMC - PubMed
    1. Lennerz JKM, Kim S, Oates EL, et al. The transcription factor MIST1 is a novel human gastric chief cell marker whose expression is lost in metaplasia, dysplasia and carcinoma. Amer J Pathol 2010; 177: 1514–1533. - PMC - PubMed
    1. Schmidt PH, Lee JR, Joshi V, et al. Identification of a metaplastic cell lineage associated with human gastric adenocarcinoma. LabInvest 1999; 79: 639–646. - PubMed

Publication types

MeSH terms