Comment
. 2020 Jun 29;222(2):214-222.
doi: 10.1093/infdis/jiaa274.

Simulated Sunlight Rapidly Inactivates SARS-CoV-2 on Surfaces

Affiliations
Comment

Simulated Sunlight Rapidly Inactivates SARS-CoV-2 on Surfaces

Shanna Ratnesar-Shumate et al. J Infect Dis. .

Abstract

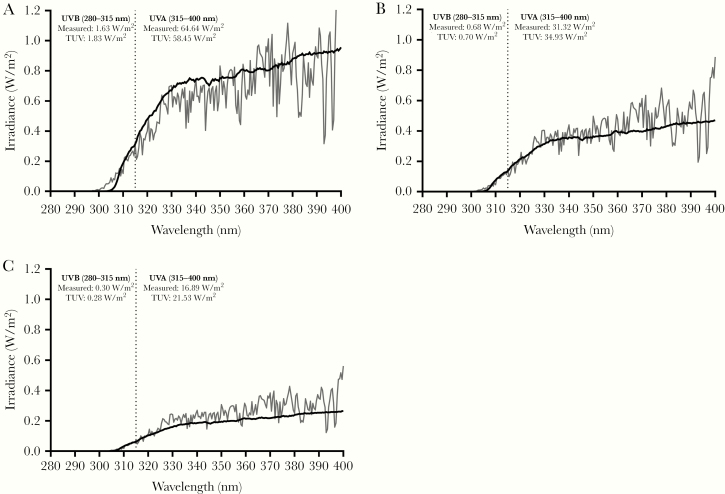
Previous studies have demonstrated that SARS-CoV-2 is stable on surfaces for extended periods under indoor conditions. In the present study, simulated sunlight rapidly inactivated SARS-CoV-2 suspended in either simulated saliva or culture media and dried on stainless steel coupons. Ninety percent of infectious virus was inactivated every 6.8 minutes in simulated saliva and every 14.3 minutes in culture media when exposed to simulated sunlight representative of the summer solstice at 40°N latitude at sea level on a clear day. Significant inactivation also occurred, albeit at a slower rate, under lower simulated sunlight levels. The present study provides the first evidence that sunlight may rapidly inactivate SARS-CoV-2 on surfaces, suggesting that persistence, and subsequently exposure risk, may vary significantly between indoor and outdoor environments. Additionally, these data indicate that natural sunlight may be effective as a disinfectant for contaminated nonporous materials.

Keywords: COVID-19; SARS-CoV-2; environmental persistence; sunlight.


Figures

Figure 1.
Figure 1.
Schematic of the coupon exposure system. An environmentally controlled chamber with a quartz window to allow introduction of simulated sunlight was used to expose small coupons contaminated with dried SARS-CoV-2. Coupons were placed on mounting strip that attached to the interior wall of the chamber. A custom solar simulator consisting of a xenon arc lamp, a series of optical filters, and mirrors was used to illuminate the inside of the chamber with simulated sunlight. The temperature inside the chamber was maintained by circulating temperature-conditioned propylene glycol through the chamber walls. Relative humidity (RH) was maintained by supplying a low flow of humidity-controlled air through the chamber. The temperature and RH in the chamber and surface temperature of coupons were monitored continuously throughout the experiments.
Figure 2.
Figure 2.
Representative spectra for simulated sunlight. Spectra utilized in the present study (black lines) and those predicted by the National Center for Atmospheric Research tropospheric ultraviolet and visible (TUV) radiation model (gray lines) for noon at 40°N latitude at sea level on (A) 21 June, (B) 21 February, and (C) 21 December are shown. Integrated irradiances for the UVA and UVB portions of the spectra for both the measured and TUV radiation model spectra are also shown and demonstrate good agreement between the measured and model spectra. The default settings for overhead ozone, surface albedo, clouds, and aerosols were utilized in the TUV radiation model estimates. Vertical dashed line at 315 nm denotes the boundary between UVA (315–400 nm) and UVB (280–315 nm).
Figure 3.
Figure 3.
Integrated UVB intensities for different times of day and year. Estimates of the integrated UVB irradiances are shown for different months and hours of the day at 40°N latitude and sea level (solid black lines). Horizontal dashed lines represent the integrated UVB irradiance levels for the spectra utilized in the present study and demonstrate that the spectra utilized span UVB irradiances expected throughout the year from the winter to summer solstices. Estimates of integrated UVB irradiance were generated using the National Center for Atmospheric Research tropospheric ultraviolet and visible radiation model run hourly for the 21st day of each month at sea level with default settings for overhead ozone, surface albedo, clouds, and aerosols.
Figure 4.
Figure 4.
Inactivation rates for SARS-CoV-2 suspended in simulated saliva as a function of UVB irradiance. Linear regression fits for SARS-CoV-2 suspended in simulated saliva and recovered from stainless steel coupons following exposure to different light conditions are shown. Inactivation rates for exposure to any level of UVB irradiance were significantly faster than that observed in darkness (P < .0001). Additionally, the inactivation rates observed for UVB irradiances of 1.6 and 0.7 W/m2 were significantly greater than that observed for 0.3 W/m2 (P ≤ .0065). The slope of the regression line for darkness was not significantly different from zero. Goodness of fit parameters, specifically r2 and standard deviation of the residuals (RMSE), for each fit were: (A) r2 = 0.922, RMSE = 0.24; (B) r2 = 0.906, RMSE = 0.28; (C) r2 = 0.670, RMSE = 0.40; and (D) r2 = 0.041, RMSE = 0.32. Abbreviations: CI, confidence interval; TCID50, median tissue culture infectious dose.
Figure 5.
Figure 5.
Inactivation rates for SARS-CoV-2 suspended in growth medium (gMEM) as a function of UVB level. Linear regression fits for SARS-CoV-2 suspended in gMEM and recovered from stainless steel coupons following exposure to different light conditions are shown. Inactivation rates for exposure to UVB irradiances of 1.6 and 0.7 W/m2 were significantly faster than that observed in darkness (P ≤ .0033). Inactivation rate for exposure to an irradiance of 0.3 W/m2 was significantly lower than that observed for an irradiance of 1.6 W/m2 (P = .014) but was not different from 0.7 W/m2 or darkness (P ≥ .227). The slopes of the regression lines for darkness and 0.3 W/m2 were not significantly different from zero. Goodness of fit parameters, specifically r2 and standard deviation of the residuals (RMSE), for each fit were: (A) r2 = 0.818, RMSE = 0.24; (B) r2 = 0.699, RMSE = 0.27; (C) r2 = 0.129, RMSE = 0.35; and (D) r2 = 0.236, RMSE = 0.24. Abbreviations: CI, confidence interval; TCID50, median tissue culture infectious dose.
Figure 6.
Figure 6.
SARS-CoV-2 inactivation rates as a function of UVB level. Inactivation of SARS-CoV-2 on stainless steel coupons was significantly greater in the presence of simulated sunlight than that observed in darkness. The UVB level and the suspension matrix both significantly affected the measured inactivation rate. * P < .05 when compared to saliva at the same UVB irradiance level. Values are best fit slopes from linear regression with associated 95% confidence intervals. Abbreviations: gMEM, growth medium; TCID50, median tissue culture infectious dose.

Comment in

Comment on

  • Airborne SARS-CoV-2 Is Rapidly Inactivated by Simulated Sunlight.
    Schuit M, Ratnesar-Shumate S, Yolitz J, Williams G, Weaver W, Green B, Miller D, Krause M, Beck K, Wood S, Holland B, Bohannon J, Freeburger D, Hooper I, Biryukov J, Altamura LA, Wahl V, Hevey M, Dabisch P. Schuit M, et al. J Infect Dis. 2020 Jul 23;222(4):564-571. doi: 10.1093/infdis/jiaa334. J Infect Dis. 2020. PMID: 32525979 Free PMC article.

References

    1. Sohrabi C, Alsafi Z, O’Neill N, et al. . World Health Organization declares global emergency: A review of the 2019 novel coronavirus (COVID-19). Int J Surg 2020; 76:71–6. - PMC - PubMed
    1. Guo ZD, Wang ZY, Zhang SF, et al. . Aerosol and surface distribution of severe acute respiratory syndrome coronavirus 2 in hospital wards, Wuhan, China, 2020 [published online ahead of print 10 April 2020]. Emerg Infect Dis doi: 10.3201/eid2607.200885. - PMC - PubMed
    1. Ong SWX, Tan YK, Chia PY, et al. . Air, surface environmental, and personal protective equipment contamination by severe acute respiratory syndrome coronavirus 2 (SARS-CoV-2) from a symptomatic patient [published online ahead of print 4 March 2020]. JAMA doi: 10.1001/jama.2020.3227. - DOI - PMC - PubMed
    1. van Doremalen N, Bushmaker T, Morris DH, et al. . Aerosol and surface stability of SARS-CoV-2 as compared with SARS-CoV-1. N Engl J Med 2020; 382:1564–7. - PMC - PubMed
    1. Chin AH, Shu JTS, Mahen RP, et al. . Stability of SARS-CoV-2 in different environmental conditions. Lancet Microbe 2020; 1:E10. - PMC - PubMed