

Prostate Cancer Incidence 5 Years After US Preventive Services Task Force Recommendations Against Screening
- PMID: 32432713
- PMCID: PMC7781461
- DOI: 10.1093/jnci/djaa068
Prostate Cancer Incidence 5 Years After US Preventive Services Task Force Recommendations Against Screening
Abstract
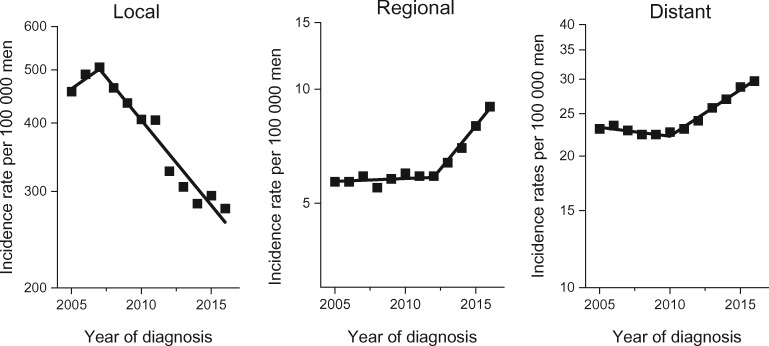
Background: Previous studies reported that prostate cancer incidence rates in the United States declined for local-stage disease and increased for regional- and distant-stage disease following the US Preventive Services Task Force recommendations against prostate-specific antigen-based screening for men aged 75 years and older in 2008 and for all men in 2012. It is unknown, however, whether these patterns persisted through 2016.
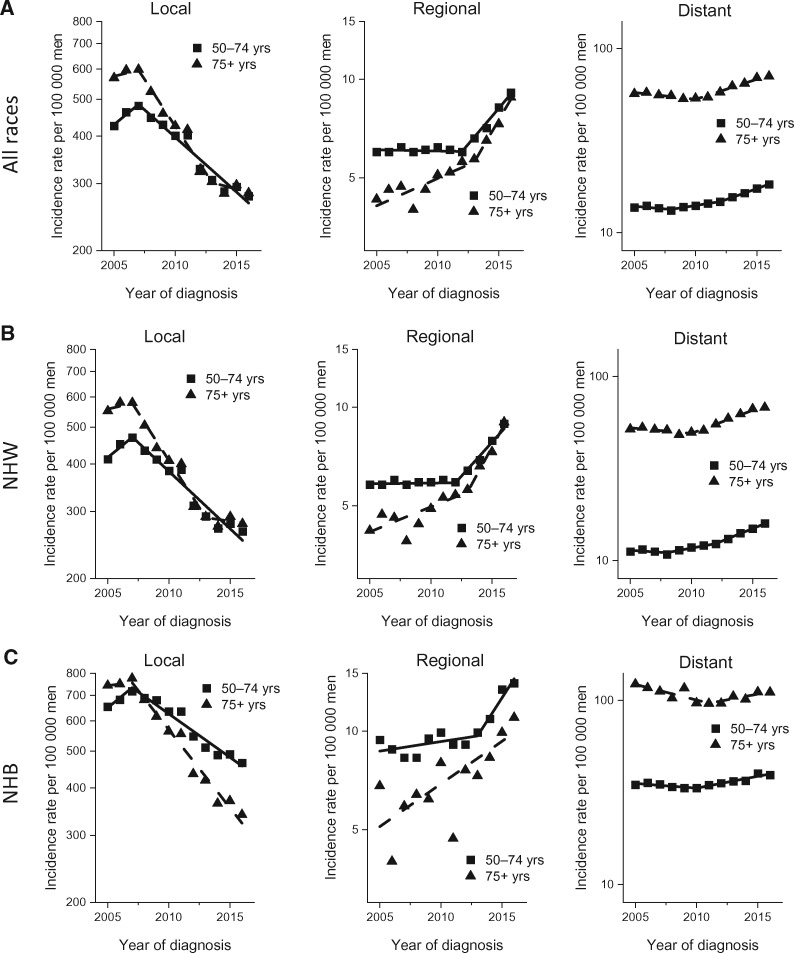
Methods: Based on the US Cancer Statistics Public Use Research Database, we examined temporal trends in invasive prostate cancer incidence from 2005 to 2016 in men aged 50 years and older stratified by stage (local, regional, and distant), age group (50-74 years and 75 years and older), and race and ethnicity (all races and ethnicities, non-Hispanic Whites, and non-Hispanic Blacks) with joinpoint regression models to estimate annual percent changes. Tests of statistical significance are 2-sided (P < .05).
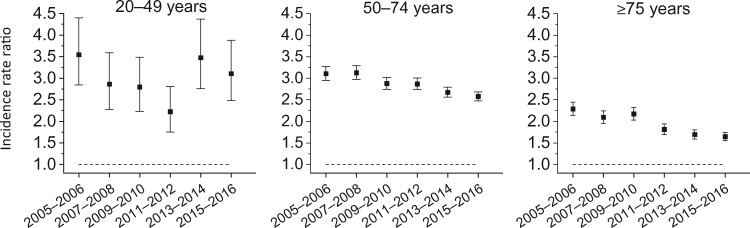
Results: For all races and ethnicities combined, incidence for local-stage disease declined beginning in 2007 in men aged 50-74 years and 75 years and older, although the decline stabilized during 2013-2016 in men aged 75 years and older. Incidence decreased by 6.4% (95% CI = 4.9%-9% to 7.9%) per year from 2007 to 2016 in men aged 50-74 years and by 10.7% (95% CI = 6.2% to 15.0%) per year from 2007 to 2013 in men aged 75 years and older. In contrast, incidence for regional- and distant-stage disease increased in both age groups during the study period. For example, distant-stage incidence in men aged 75 years and older increased by 5.2% (95% CI = 4.2% to 6.1%) per year from 2010 to 2016.
Conclusions: Regional- and distant-stage prostate cancer incidence continue to increase in the United States in men aged 50 years and older, and future studies are needed to identify reasons for the rising trends.
© The Author(s) 2020. Published by Oxford University Press. All rights reserved. For permissions, please email: journals.permissions@oup.com.
Figures
Comment in
-
Response to Lehrer and Rheinstein.J Natl Cancer Inst. 2020 Oct 1;112(10):1069-1070. doi: 10.1093/jnci/djaa093. J Natl Cancer Inst. 2020. PMID: 32602890 Free PMC article. No abstract available.
-
Re: Prostate Cancer Incidence 5 Years After US Preventive Services Task Force Recommendations Against Screening.J Natl Cancer Inst. 2020 Oct 1;112(10):1067-1068. doi: 10.1093/jnci/djaa092. J Natl Cancer Inst. 2020. PMID: 32602898 Free PMC article. No abstract available.
-
Rates of advanced prostate cancer continue to increase.CA Cancer J Clin. 2020 Nov;70(6):427-429. doi: 10.3322/caac.21641. Epub 2020 Sep 28. CA Cancer J Clin. 2020. PMID: 32986246 No abstract available.
References
-
- Siegel RL, Miller KD, Jemal A.. Cancer statistics, 2020. CA A Cancer J Clin. 2020;70(1):7–30. - PubMed
-
- Jemal A, Ma J, Siegel R, et al. Prostate cancer incidence rates 2 years after the US Preventive Services Task Force Recommendations Against Screening. JAMA Oncol. 2016;2(12):1657–1660. - PubMed
-
- U.S. Preventive Services Task Force. Screening for Prostate Cancer: U.S. Preventive Services Task Force Recommendation Statement. Ann Int Med. 2008;149(3):185–191. - PubMed
Publication types
MeSH terms
Substances
LinkOut - more resources
Full Text Sources
Medical
