. 2020 May 20;5(1):56.
doi: 10.1038/s41392-020-0151-9.

Drp1-dependent remodeling of mitochondrial morphology triggered by EBV-LMP1 increases cisplatin resistance

Affiliations

Drp1-dependent remodeling of mitochondrial morphology triggered by EBV-LMP1 increases cisplatin resistance

Longlong Xie et al. Signal Transduct Target Ther. .

Erratum in

Abstract

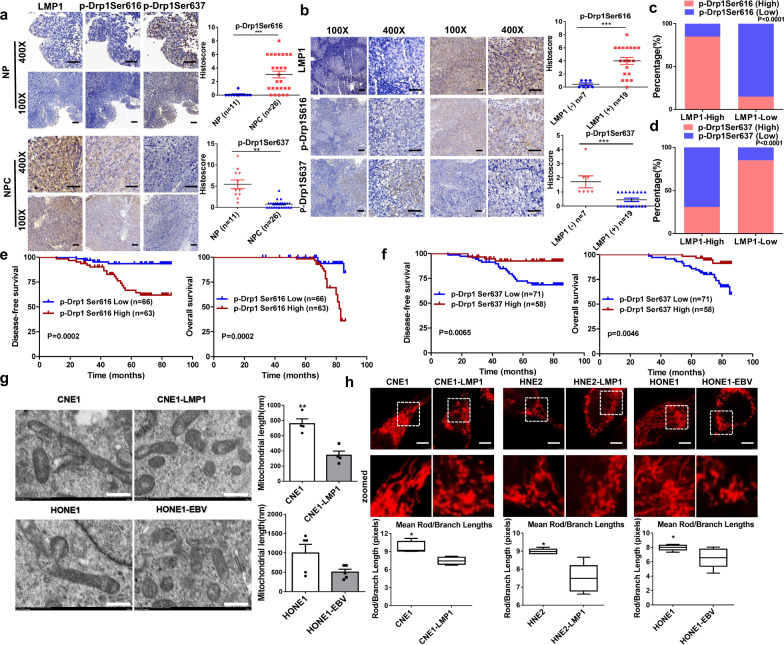
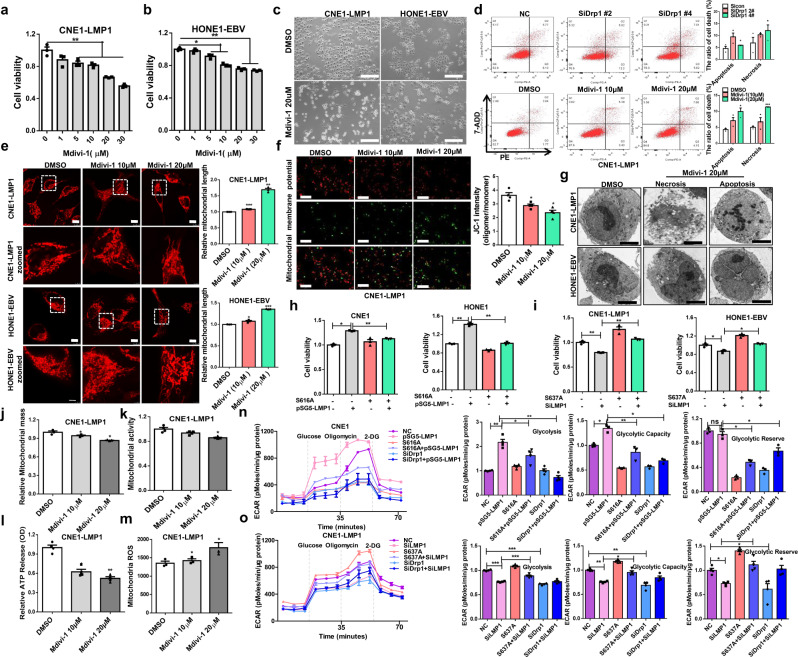
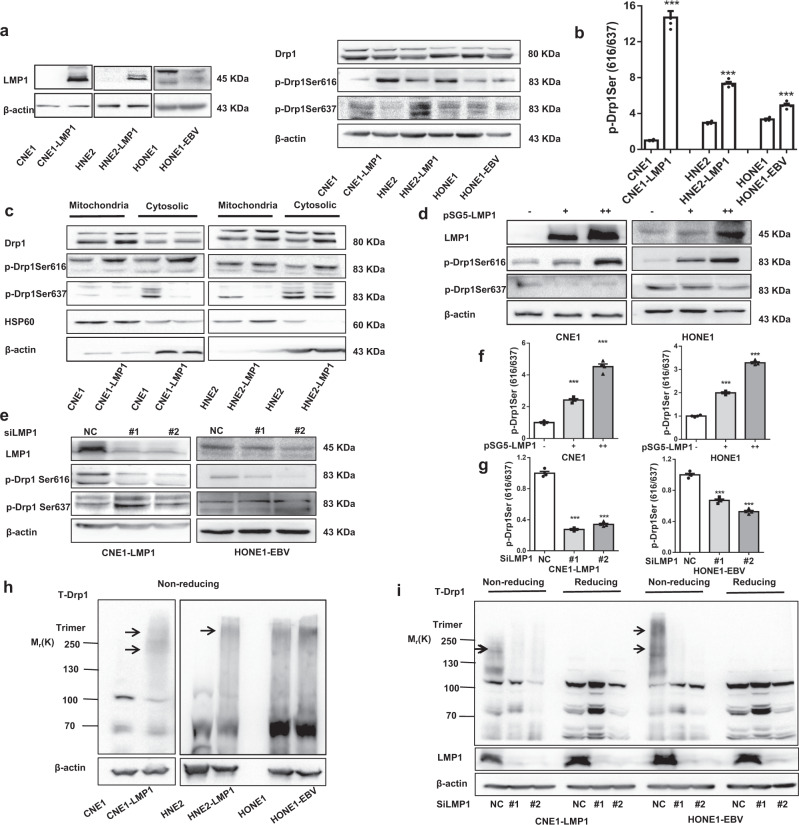
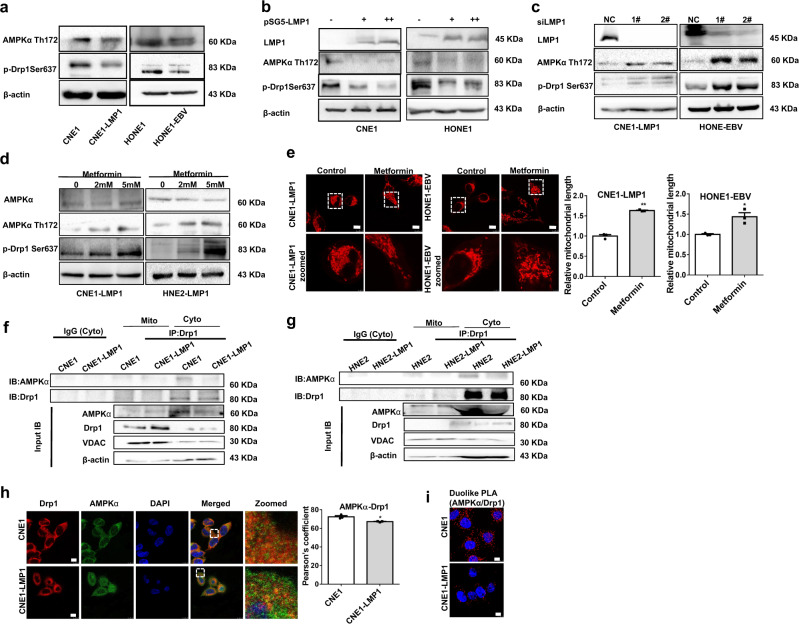
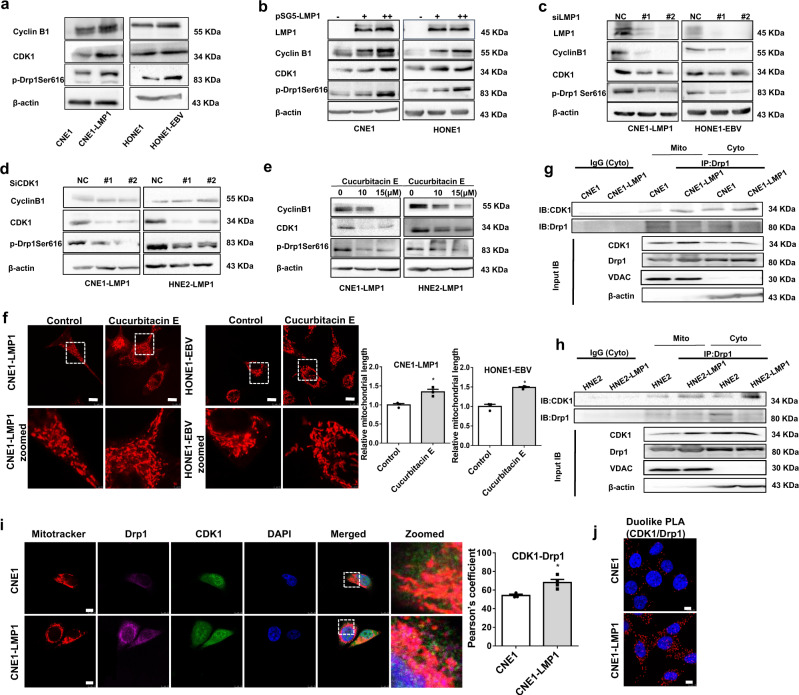
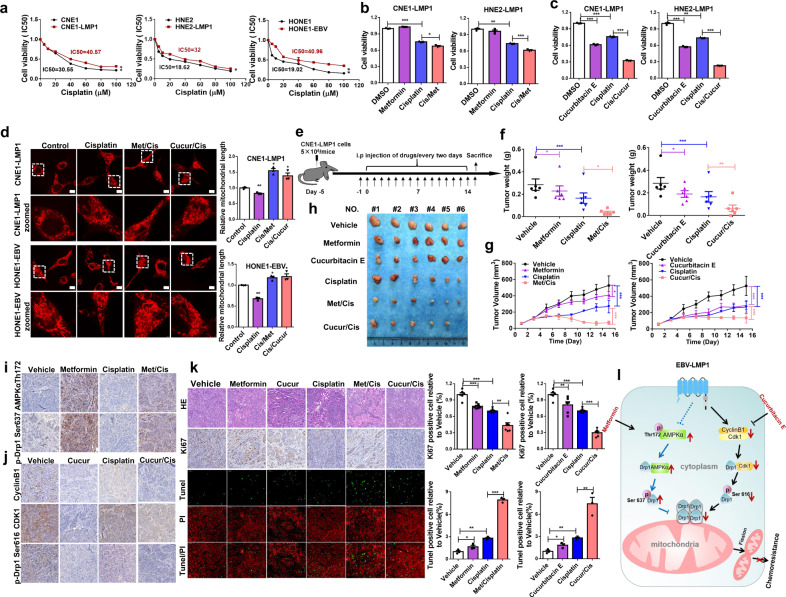
Latent membrane protein 1 (LMP1) is a major Epstein-Barr virus (EBV)-encoded oncoprotein involved in latency infection that regulates mitochondrial functions to facilitate cell survival. Recently, mitochondrial fission has been demonstrated as a crucial mechanism in oncovirus-mediated carcinogenesis. Mitochondrial dynamin-related protein 1 (Drp1)-mediated mitochondrial fission has an impact on the chemoresistance of cancers. However, the mechanism by which oncogenic stress promotes mitochondrial fission, potentially contributing to tumorigenesis, is not entirely understood. The role of Drp1 in the oncogenesis and prognosis of EBV-LMP1-positive nasopharyngeal carcinoma (NPC) was determined in our study. We show that EBV-LMP1 exhibits a new function in remodeling mitochondrial morphology by activating Drp1. A high level of p-Drp1 (Ser616) or a low level of p-Drp1 (Ser637) correlates with poor overall survival and disease-free survival. Furthermore, the protein level of p-Drp1 (Ser616) is related to the clinical stage (TNM stage) of NPC. Targeting Drp1 impairs mitochondrial function and induces cell death in LMP1-positive NPC cells. In addition, EBV-LMP1 regulates Drp1 through two oncogenic signaling axes, AMPK and cyclin B1/Cdk1, which promote cell survival and cisplatin resistance in NPC. Our findings provide novel insight into the role of EBV-LMP1-driven mitochondrial fission in regulating Drp1 phosphorylation at serine 616 and serine 637. Disruption of Drp1 could be a promising therapeutic strategy for LMP1-positive NPC.


Conflict of interest statement

The authors declare no competing interests.

Figures

Fig. 1
Fig. 1
EBV-LMP1 is positively correlated with Drp1 activation in human NPC patient tissues and prominently changes mitochondrial morphology. a Representative IHC staining of p-Drp1 Ser616 and p-Drp1 Ser637 levels from tissue slices of 26 nasopharyngeal squamous cell carcinoma patients and 11 nasopharyngitis patients (100×: scale bar, 100 μm; 400×: scale bar, 50 μm; ***P < 0.001 by Student’s t-test). b Representative IHC photos for the expression of LMP1 and p-Drp1 Ser616 and p-Drp1 Ser637 in NPC tissues (***P < 0.001). c The percentage of specimens displaying low or high LMP1 and p-Drp1 Ser616 (***P < 0.001). d The percentage of specimens displaying low or high LMP1 and p-Drp1 Ser637 (**P < 0.01). e Disease-free survival (left) and overall survival (right) analysis according to p-Drp1 Ser616 expression. The tissue microarray of NPC patients was divided into two groups: good prognosis (low expression of p-Drp1 Ser616) and poor prognosis (high expression of p-Drp1 Ser616). f Disease-free survival (left) and overall survival (right) analysis according to p-DRP1 Ser637 expression. The NPC patient tissues in the microarray were divided into two groups: good prognosis (high expression of p-Drp1 Ser637) and poor prognosis (low expression of p-Drp1 Ser637). g Transmission electron microscopy photomicrographs of mitochondrial structure in EBV-LMP1-positive and EBV-LMP1-negative cells. Scale bar, 500 nm. Quantification of mitochondrial length is shown in bar graphs. h Confocal microscopy analysis of mitochondrial morphology. Red: MitoTracker Red. Images were analyzed using ImageJ software (scale bar, 2.5 μm, *P < 0.05)
Fig. 2
Fig. 2
Inhibition of Drp1 activity impairs mitochondrial function and leads to cell death. a, b The cells were treated with different concentrations of Mdivi-1 or DMSO control for 24 h. Cell viability was analyzed by MTS assay (*P < 0.05, **P < 0.01). c Morphology of NPC cells treated with Mdivi-1 or DMSO (scale bar, 100 μm). d Flow cytometry analysis of cell death in NPC cells with Drp1 knockdown or Mdivi-1 treatment (*P < 0.05, **P < 0.01). e Mitochondrial morphology of CNE1-LMP1 and HONE1-EBV cells treated with or without Mdivi-1 (20 μM) and stained with MitoTracker Red (scale bar, 10 μm). f The mitochondrial potential was detected through JC-1 staining. Red fluorescence, which indicated normal mitochondrial potential, was converted into green fluorescence after a reduction in mitochondrial potential. Scale bar, 5 μm. Data are presented as the mean ± S.E.M. (n = 3, *P < 0.05). g Transmission electron microscopy analysis of photomicrographs of CNE1-LMP1 and HONE1-EBV cells treated with DMSO or Mdivi-1 (scale bar, 5 μm.) h MTS assay analysis of the viability of CNE1 and HONE1 cells with CRISPR/Cas9-mediated endogenous modification of Drp1 S616A. i MTS assay analysis of the viability of CNE1-LMP1 and HONE1-EBV cells with CRISPR/Cas9-mediated endogenous modification of Drp1 S637A. jm CNE1-LMP1 cells were treated with or without Mdivi-1 (10 μM or 20 μM) for 24 h or transfected with siNC or siDNM1L for 48 h. Flow cytometry was performed to determine mitochondrial mass using MitoTracker Green FM (M7514) in NPC cells j. The relative fluorescence intensity of cancer cells stained with MitoTracker Red (M7512) was measured to examine the changes in mitochondrial activity k. Effects of Drp1 on adenosine triphosphate (ATP) l. To assess mitochondrial ROS, cells were stained with MitoSOX, and relative signal intensities were analyzed using flow cytometry m. Values represent the mean ± SD of three independent experiments (*P < 0.05, **P < 0.01, ***P < 0.001). n, o The ECAR was determined using a Seahorse XF96 analyzer to evaluate glycolytic flux. Glycolysis, glycolytic capacity, and glycolytic reserve were determined by the sequential addition of 10 mM glucose, 1 PM oligomycin, and 50 mM 2-D-glucose. Values represent the mean ± SD of four experiments performed five times (*P < 0.05, **P < 0.01, ***P < 0.001). Values were normalized to cell number. S616A-mutated or Drp1‐knockdown CNE1 cells transfected with pSG5-LMP1 n. S637A-mutated or Drp1‐knockdown CNE1-LMP1 cells transfected with LMP1 siRNA o
Fig. 3
Fig. 3
EBV-LMP1 activates the mitochondrial fission protein Drp1. a, b The effect of LMP1 on Drp1 phosphorylation. NPC cell lysates were subjected to western blot (WB) analysis with the antibodies indicated a. The expression ratio of p-Drp1 Ser616 to p-Drp1 Ser637 was calculated via densitometric analysis of each immunoblot using ImageJ software b. c Subcellular fractions were isolated from NPC cell lines and subjected to WB analysis. d, e Cell lysates of EBV-LMP1 overexpression or knockdown cell lines were subjected to WB for measurement of the phosphorylation of Drp1 Ser616 and Drp1 Ser637. f, g The expression ratio of p-Drp1 Ser616 to p-Drp1 Ser637 was calculated via densitometric analysis of each immunoblot using ImageJ software. h, i Drp1 oligomers were resolved from monomers by nonreducing SDS–PAGE, and specific bands are denoted by arrows. Nonreducing SDS–PAGE detected the effect of EBV-LMP1 on Drp1 self-assembly
Fig. 4
Fig. 4
EBV-LMP1 decreases the phosphorylation of Drp1 Ser637 by AMPK. a WB analysis of the expression of AMPKα Thr172 and p-Drp1 Ser637 in NPC cells. b, c The protein levels of LMP1, AMPKα Thr172, and p-Drp1 Ser637 were detected by WB in LMP1-overexpressing or LMP1-knockdown cells. d, e LMP1-positive cells were treated with or without metformin (2 mM or 5 mM) for 24 h. WB assays were performed to determine the expression levels of LMP1, AMPKα Thr172, and p-Drp1 Ser637 d. Confocal microscopy analysis of cell morphology with MitoTracker Red e. f, g Proteins were immunoprecipitated from the mitochondria or cytoplastic lysate and subjected to WB analysis. h Confocal microscopy images of CNE1 and CNE1-LMP1 cells immunostained with anti-AMPKα (green) and anti-Drp1 (red) antibodies (scale bar, 10 μm). Quantification of the AMPKα-Drp1 Pearson’s coefficient is shown in bar graphs (mean ± SD, *P < 0.05 by Student’s t-test). i The in situ PLA was performed to examine the interaction between AMPKα and Drp1 in CNE1, and CNE1-LMP1 cells (scale bar, 10 μm)
Fig. 5
Fig. 5
EBV-LMP1 promotes the phosphorylation of Drp1 Ser616 by upregulating cyclin B1/Cdk1 complex activity. a WB analysis of the expression of cyclin B1, Cdk1, and p-Drp1 Ser616 in NPC cells. b, c The protein levels of LMP1, cyclin B1, Cdk1, and p-Drp1 Ser616 were determined by WB analysis in LMP1-overexpressing and LMP1-knockdown cells. d, e WB was performed to determine the protein levels of cyclin B1, Cdk1, and p-Drp1 Ser616. LMP1-positive cells were treated with or without cucurbitacin E (10 μM) for 24 h d. LMP1-positive cells were transfected with siNC or siCDK1 for 48 h e. f CNE1-LMP1 and HONE1-EBV cells were treated with or without cucurbitacin E (10 μM) for 2 h and stained with MitoTracker Red, which was detected by confocal microscopy (scale bars, 10 μm). g, h Proteins were immunoprecipitated from the mitochondrial or cytoplasmic lysates to test the interaction of Drp1 and Cdk1. i Confocal microscopy images of CNE1 and CNE1-LMP1 cells immunostained with anti-Cdk1 (green) and anti-Drp1 (purple) antibodies, and mitochondria markers (red). The scale bars represent 10 μm. Quantification of the Cdk1-Drp1 Pearson’s coefficient is shown in bar graphs (mean ± SD, *P < 0.05 by Student’s t-test). j The interaction between Cdk1 and Drp1 in CNE1, and CNE1-LMP1 cells was analyzed by an in situ PLA assay (scale bar, 10 μm)
Fig. 6
Fig. 6
Metformin and cucurbitacin E enhance the sensitivity of NPC to cisplatin by inhibiting the activity of Drp1 in vitro and in vivo. a EBV-LMP1-positive and EBV-LMP1-negative cells were treated with increasing concentrations of cisplatin for 24 h. Cell viability was determined by MTS assay. Values are presented as the mean ± S.E.M. from three independent experiments (*P < 0.05; **P < 0.01). b CNE1-LMP1 and HNE2-LMP1 cells were treated with cisplatin (20 μM) alone or cisplatin (20 μM) in combination with metformin (5 mM) for 24 h. Cell viability was measured by MTS assay (*P < 0.05; ***P < 0.001). c CNE1-LMP1 and HNE2-LMP1 cells were treated with cisplatin (20 μM) alone or cisplatin (20 μM) in combination with cucurbitacin E (10 μM) for 24 h. Cell viability was measured with an MTS assay (***P < 0.001). d CNE1-LMP1 and HONE1-EBV cells were treated with control, cisplatin, the combination of cisplatin and metformin, or cucurbitacin E for 5 h. The morphology of mitochondria was analyzed by confocal microscopy (scale bars, 10 μm). e The overall diagram of the study design. The nasopharyngeal carcinoma xenograft model was established using CNE1-LMP1 cells. f, g The tumor weight f and tumor volume g of CNE1-LMP1-derived xenograft tumors with various treatments. The asterisks indicate a significant difference (*P < 0.05, **P < 0.01, ***P < 0.001). h Representative images of xenografts from different treatment groups. i Immunohistochemistry staining to determine the protein levels of AMPKα Thr172 and p-Drp1 Ser637 in xenograft tumor tissues. j Immunohistochemistry to determine the protein levels of cyclin B1, Cdk1, and p-Drp1 Ser616 in representative tumor tissues. k Immunohistochemistry to determine the protein levels of Ki67. Apoptosis was analyzed by TUNEL assay. The asterisks indicate a significant difference (*P < 0.05, **P < 0.01, ***P < 0.001). l Schematic illustrating that EBV-LMP1 confers chemotherapy resistance by differentially regulating the Drp1 signaling axis. EBV-LMP1 mediates the imbalance of Drp1 phosphorylation at Ser616 and Ser637 via the downstream cyclin B1/Cdk1 and AMPK signaling axes

References

    1. Sabharwal SS, Schumacker PT. Mitochondrial ROS in cancer: initiators, amplifiers or an Achilles’ heel? Nat. Rev. Cancer. 2014;14:709–21. doi: 10.1038/nrc3803. - DOI - PMC - PubMed
    1. Xie LL, et al. Mitochondrial network structure homeostasis and cell death. Cancer Sci. 2018;109:3686–3694. doi: 10.1111/cas.13830. - DOI - PMC - PubMed
    1. Chen H, Chan DC. Emerging functions of mammalian mitochondrial fusion and fission. Hum. Mol. Genet. 2005;14:R283–9. doi: 10.1093/hmg/ddi270. - DOI - PubMed
    1. Zhu PP, et al. Intra- and intermolecular domain interactions of the C-terminal GTPase effector domain of the multimeric dynamin-like GTPase Drp1. J. Biol. Chem. 2004;279:35967–74. doi: 10.1074/jbc.M404105200. - DOI - PubMed
    1. Archer SL. Mitochondrial dynamics–mitochondrial fission and fusion in human diseases. N. Engl. J. Med. 2013;369:2236. doi: 10.1056/NEJMra1215233. - DOI - PubMed

Publication types

MeSH terms