

Sugary drink warnings: A meta-analysis of experimental studies
- PMID: 32433660
- PMCID: PMC7239392
- DOI: 10.1371/journal.pmed.1003120
Sugary drink warnings: A meta-analysis of experimental studies
Abstract
Background: Policymakers worldwide are considering requiring warnings for sugary drinks. A growing number of experimental studies have examined sugary drink warnings' impacts, but no research to our knowledge has synthesized this literature. To inform ongoing policy debates, this study aimed to identify the effects of sugary drink warnings compared with control conditions.
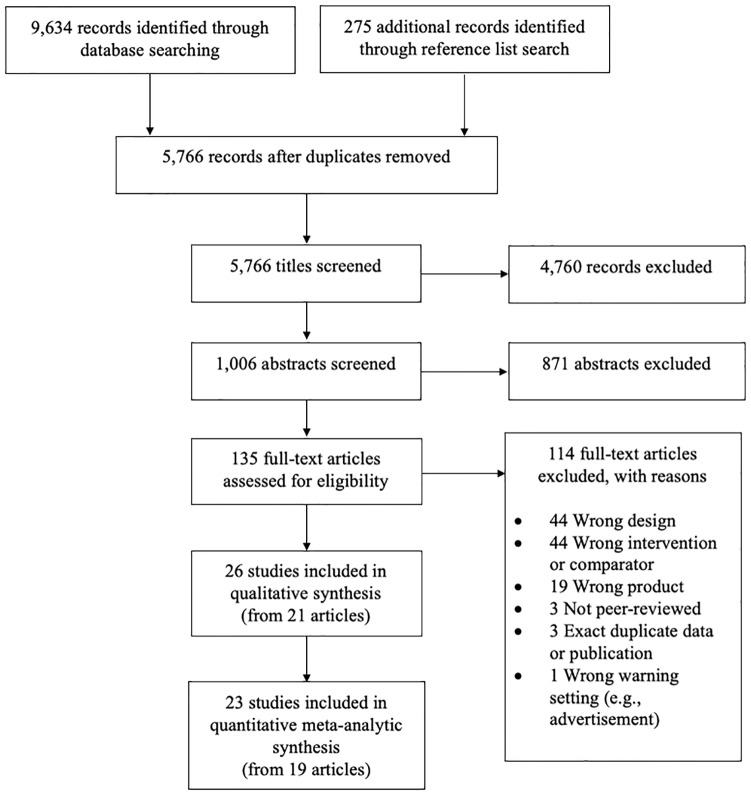
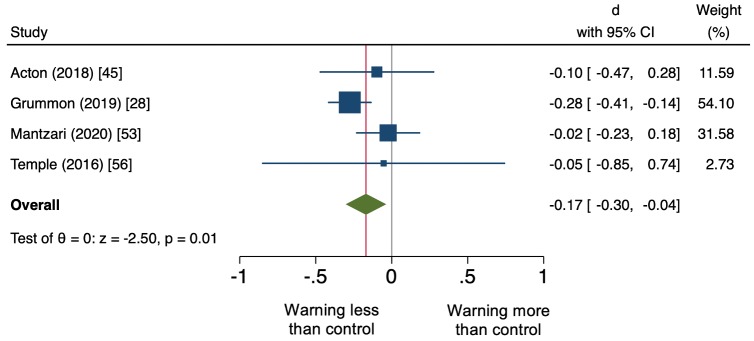
Methods and findings: We systematically searched 7 databases on June 21, 2019, and October 25, 2019. We also searched reference lists of relevant articles. Two investigators independently screened titles, abstracts, and full texts to identify peer-reviewed articles that used an experimental protocol to examine the effects of sugary drink warnings compared to a control condition. Two investigators independently extracted study characteristics and effect sizes from all relevant full-text articles. We meta-analyzed any outcome assessed in at least 2 studies, combining effect sizes using random effects meta-analytic procedures. Twenty-three experiments with data on 16,241 individuals (mean proportion female, 58%) were included in the meta-analysis. Most studies took place in Latin America (35%) or the US or Canada (46%); 32% included children. Relative to control conditions, sugary drink warnings caused stronger negative emotional reactions (d = 0.69; 95% CI: 0.25, 1.13; p = 0.002) and elicited more thinking about the health effects of sugary drinks (d = 0.65; 95% CI: 0.29, 1.01; p < 0.001). Sugary drink warnings also led to lower healthfulness perceptions (d = -0.22; 95% CI: -0.27, -0.17; p < 0.001) and stronger disease likelihood perceptions (d = 0.15; 95% CI: 0.06, 0.24; p = 0.001). Moreover, sugary drink warnings reduced both hypothetical (d = -0.32; 95% CI: -0.44, -0.21; p < 0.001) and actual consumption and purchasing behavior (d = -0.17; 95% CI: -0.30, -0.04; p = 0.012). Statistically significant effects were not observed for perceptions of added sugar or positive sugary drink attitudes (p's > 0.10). Moderation analyses revealed that health warnings (e.g., "Beverages with added sugar contribute to obesity") led to greater reductions in hypothetical sugary drink purchases than did nutrient warnings (e.g., "High in sugar"; d = -0.35 versus -0.18; Qb = 4.04; p = 0.04). Limitations of this study include that we did not review grey literature and that we were unable to conduct moderation analyses for several prespecified moderators due to an insufficient number of studies.
Conclusions: This international body of experimental literature supports sugary drink warnings as a population-level strategy for changing behavior, as well as emotions, perceptions, and intentions.
Protocol registry: PROSPERO ID 146405.
Conflict of interest statement
The authors have declared that no competing interests exist.
Figures
References
-
- Singh GM, Micha R, Khatibzadeh S, Shi P, Lim S, Andrews KG, et al. Global, regional, and national consumption of sugar-sweetened beverages, fruit juices, and milk: a systematic assessment of beverage intake in 187 countries. PLoS ONE. 2015;10:e0124845 10.1371/journal.pone.0124845 - DOI - PMC - PubMed
Publication types
MeSH terms
Grants and funding
LinkOut - more resources
Full Text Sources
Medical
