. 2020 May 26;4(10):2202-2212.
doi: 10.1182/bloodadvances.2020001750.

Competitive tight-binding inhibition of VKORC1 underlies warfarin dosage variation and antidotal efficacy

Affiliations

Competitive tight-binding inhibition of VKORC1 underlies warfarin dosage variation and antidotal efficacy

Shuang Li et al. Blood Adv. .

Abstract

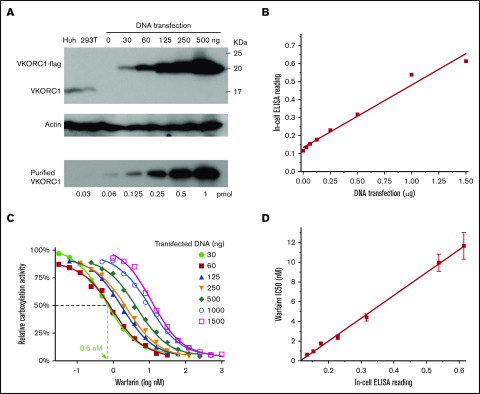
Dose control of warfarin is a major complication in anticoagulation therapy and overdose is reversed by the vitamin K antidote. Improving the dosage management and antidotal efficacy requires mechanistic understanding. Here we find that effects of the major predictor of warfarin dosage, SNP -1639 G>A, follow a general correlation that warfarin 50% inhibitory concentration decreases with cellular level of vitamin K epoxide reductase (VKORC1), suggesting stoichiometric inhibition. Characterization of the inhibition kinetics required the use of microsomal VKORC1 with a native reductant, glutathione, that enables effective warfarin inhibition in vitro. The kinetics data can be fitted with the Morrison equation, giving a nanomolar inhibition constant and demonstrating that warfarin is a tight-binding inhibitor. However, warfarin is released from purified VKORC1-warfarin complex with increasing amount of vitamin K, indicating competitive inhibition. The competition occurs also in cells, resulting in rescued VKORC1 activity that augments the antidotal effects of vitamin K. Taken together, warfarin is a competitive inhibitor that binds VKORC1 tightly and inhibits at a stoichiometric (1:1) concentration, whereas exceeding the VKORC1 level results in warfarin overdose. Thus, warfarin dosage control should use VKORC1 level as a major indicator, and improved antidotes may be designed based on their competition with warfarin.


Conflict of interest statement

Conflict-of-interest disclosure: The authors declare no competing financial interests.

Figures

None
Graphical abstract
Figure 1.
Figure 1.
Cellular effects of SNP −1639 G>A. (A) Vector construction. VKORC1 promoter with the SNP −1639 G>A is placed before the VKORC1 cDNA in the pBudCE4.1 vector for carboxylation assay. The vector carries a luciferase gene to control for transfection efficiency. (B) Warfarin inhibition of the SNPs. Inhibition curves (left) relative IC50 level (right). (C) Cellular mRNA level of the SNPs. (D) Cellular protein level of the SNPs. The western blots use the anti-VKORC1 (left) and anti-flag (right) antibodies, with β-actin level (bottom) as controls. (E) Protein level comparison by in-cell ELISA. All error bars represent 3 repeats. **P < .01 by Student t test.
Figure 2.
Figure 2.
General correlation between warfarin IC50and VKORC1 levels. (A) Quantification of cellular VKORC1 levels. Endogenous VKOR and VKOR transfection in various amounts (top) and purified VKORC1 protein in various amounts (bottom). Anti-VKORC1 antibody was used for the western blots, which were developed simultaneously to allow direct comparison and quantification. (B) In-cell ELISA quantification of the protein level of transfected VKORC1. (C) Warfarin inhibition curves with different amounts of transfected VKORC1. (D) Correlation between warfarin IC50 (from panel C) and VKORC1 protein level. ELISA reading of the protein level is converted from DNA transfection amount (from panel B). Error bars are estimated from the inhibition curves.
Figure 3.
Figure 3.
Microsomal VKORC1 maintains warfarin sensitivity with glutathione reduction. (A) Warfarin inhibition curves of VKORC1 reduced by DTT, GSH, and GSH/GSSG. Error bars are from 3 repeats. (B) Relative IC50 levels. Error bars are calculated from Morrison fitting of the inhibition curves in panel A. The IC50 levels observed with DTT, GSH, and GSH/GSSG are 2.4 ± 0.76 µM, 52 ± 12 nM, and 82 ± 7 nM, respectively.
Figure 4.
Figure 4.
Tight-binding inhibition kinetics of warfarin. (A) Warfarin inhibition curves at different concentrations of microsomal VKORC1. The concentration of total microsome proteins and that of the VKOR protein in microsomes (estimated in panel B) are indicated. Error bars are from 3 repeats. (B) Estimation of microsomal VKORC1 concentration. Series dilutions of total microsome proteins and purified protein are compared. (C) Correlation between warfarin IC50 and estimated microsomal VKORC1 concentration. (D) Effective VKORC1 concentration determined from extrapolation of the linear part of Morrison curves. The green circles in panels A and D exemplify that estimated (from panel B) and effective VKOR concentrations are similar.
Figure 5.
Figure 5.
Vitamin K competition releases tightly bound warfarin. (A) Warfarin inhibition curves with different concentrations of purified VKORC1-warfarin complex and with K as the substrate. (B) Relative VKORC1 activity at varying concentrations of VKORC1-warfarin and K. (C) Warfarin inhibition of cellular activity of transfected VKORC1 under different K concentrations. The dashed line illustrates that, under the same warfarin concentration, VKORC1 activity is inhibited at 5 nM K but retained at 4 μM K. The double arrow indicates relative activity of the unknown enzyme (not inhibited by warfarin) at high warfarin concentration with 4 μM K. (D) Correlation between cellular warfarin IC50 and K concentration (from panel C). (E) Relative activities of VKORC1 and the unknown enzyme in absence of warfarin. The total carboxylation activity from VKORC1 and the unknown enzyme is measured with endogenous level of VKORC1 (30 ng; Figure 2A) transfected into DKO cells. Activity of the unknown enzyme is measured without the VKORC1 transfection, and subtraction of this activity from the total activity gives the VKORC1 activity. The curves show Michaelis-Menten fittings, and the dashed line illustrates that activity of the unknown enzyme is considerably lower than that of VKORC1 at a high K concentration (4 μM).
Figure 6.
Figure 6.
Mechanism and implication of warfarin tight-binding inhibition. (A) Difference between GSH and DTT. (Top) GSH maintains the native conformation of VKORC1 required for the tight binding of warfarin. This conformation is stabilized by a disulfide bond in the partially oxidized state. (Bottom) DTT fully reduces VKORC1, generating a conformation hindering warfarin binding. (B) Stoichiometric binding of warfarin explains the change of therapeutic window (orange and blue shades). The SNP inhibition curves are from Figure 1B. The dashed line indicates VKORC1 activity inhibited to the same level for the 2 SNPs.

References

    1. Goy J, Crowther M. Approaches to diagnosing and managing anticoagulant-related bleeding. Semin Thromb Hemost. 2012;38(7):702-710. - PubMed
    1. Wadelius M, Pirmohamed M. Pharmacogenetics of warfarin: current status and future challenges. Pharmacogenomics J. 2007;7(2):99-111. - PubMed
    1. Au N, Rettie AE. Pharmacogenomics of 4-hydroxycoumarin anticoagulants. Drug Metab Rev. 2008;40(2):355-375. - PubMed
    1. Gage BF, Eby C, Johnson JA, et al. . Use of pharmacogenetic and clinical factors to predict the therapeutic dose of warfarin. Clin Pharmacol Ther. 2008;84(3):326-331. - PMC - PubMed
    1. Owen RP, Gong L, Sagreiya H, Klein TE, Altman RB. VKORC1 pharmacogenomics summary. Pharmacogenet Genomics. 2010;20(10):642-644. - PMC - PubMed

Publication types

MeSH terms