. 2020 Jun;13(6):e008179.
doi: 10.1161/CIRCEP.119.008179. Epub 2020 May 20.

Triggered Ca2+ Waves Induce Depolarization of Maximum Diastolic Potential and Action Potential Prolongation in Dog Atrial Myocytes

Affiliations

Triggered Ca2+ Waves Induce Depolarization of Maximum Diastolic Potential and Action Potential Prolongation in Dog Atrial Myocytes

Georg Gussak et al. Circ Arrhythm Electrophysiol. 2020 Jun.

Abstract

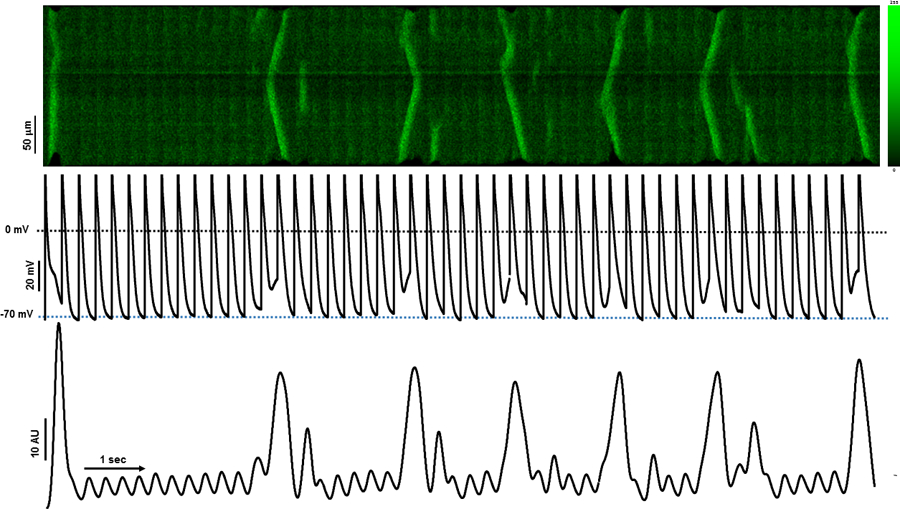
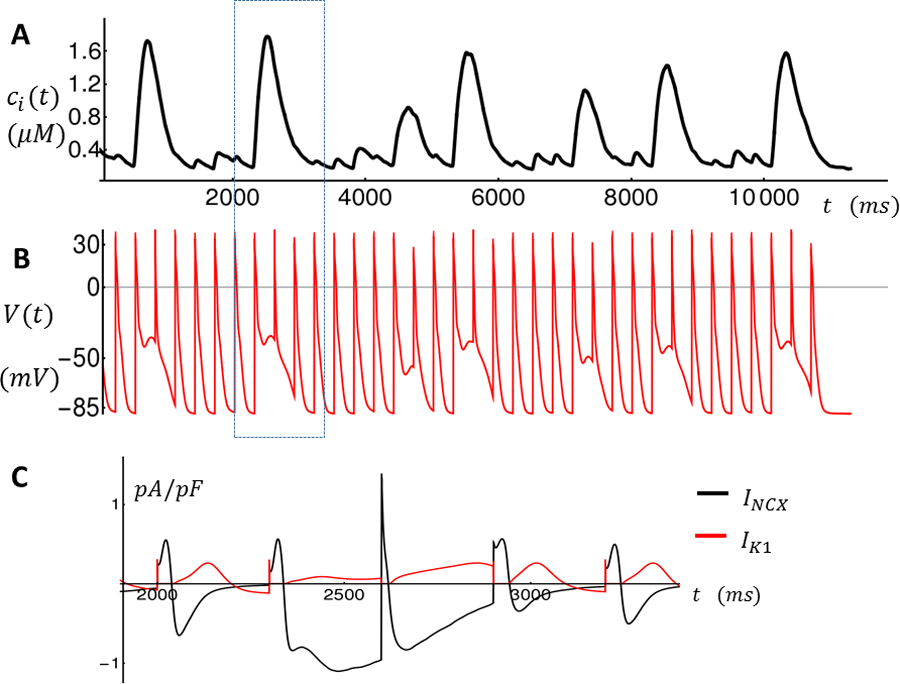
Background: We have identified a novel form of abnormal Ca2+ wave activity in normal and failing dog atrial myocytes which occurs during the action potential (AP) and is absent during diastole. The goal of this study was to determine if triggered Ca2+ waves affect cellular electrophysiological properties.

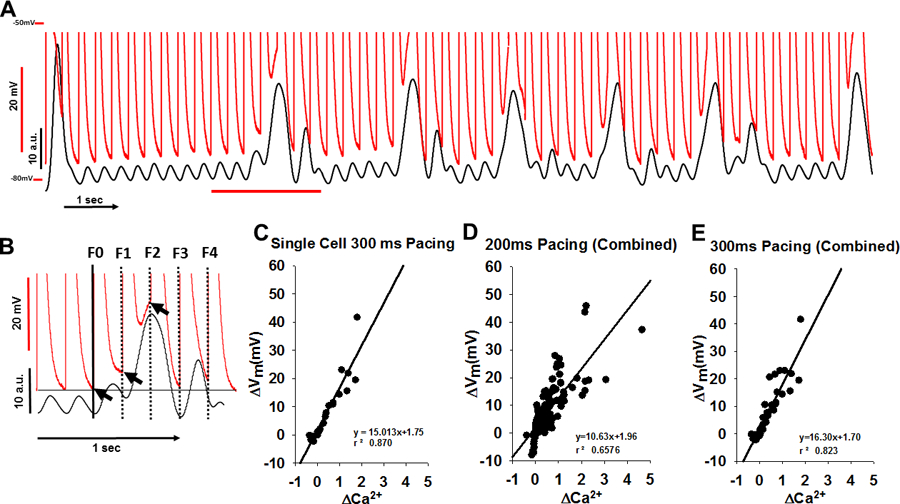
Methods: Simultaneous recordings of intracellular Ca2+ and APs allowed measurements of maximum diastolic potential and AP duration during triggered calcium waves (TCWs) in isolated dog atrial myocytes. Computer simulations then explored electrophysiological behavior arising from TCWs at the tissue scale.

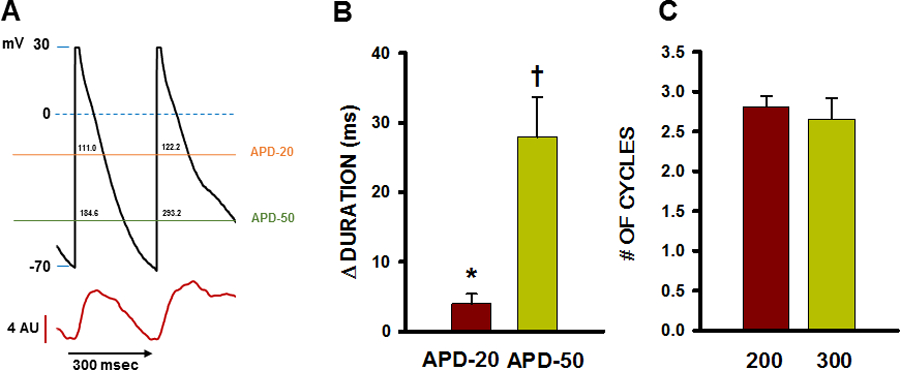
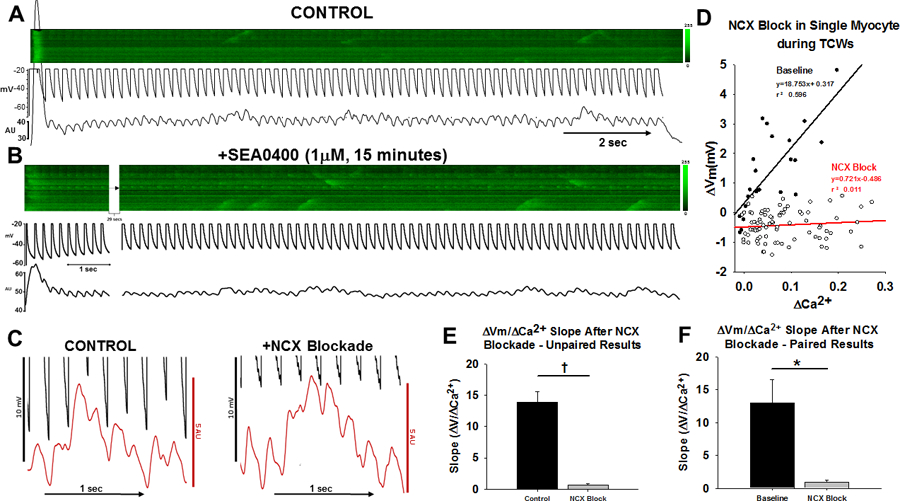
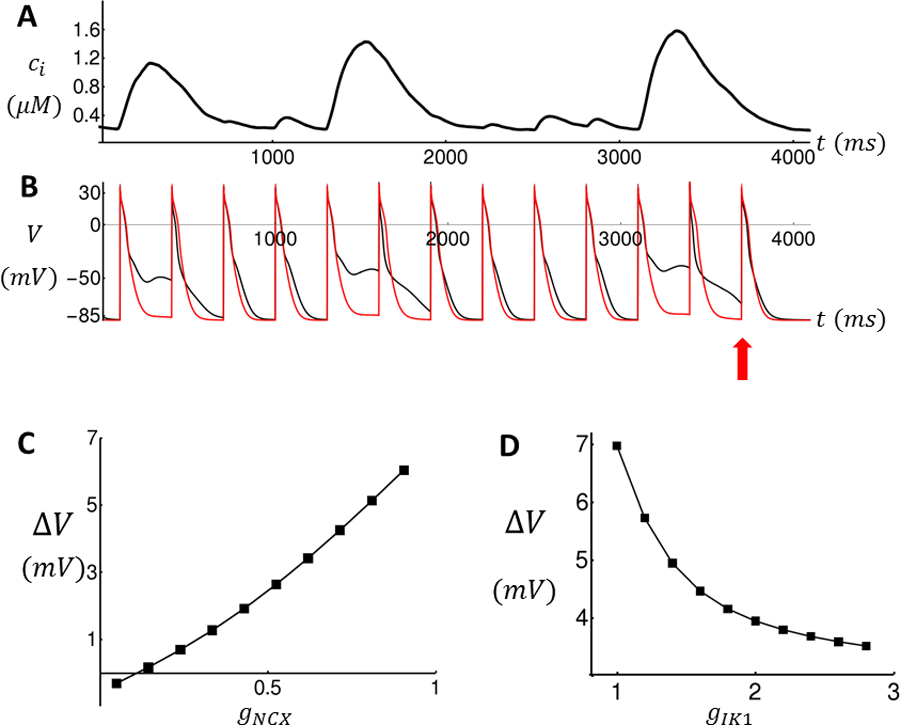
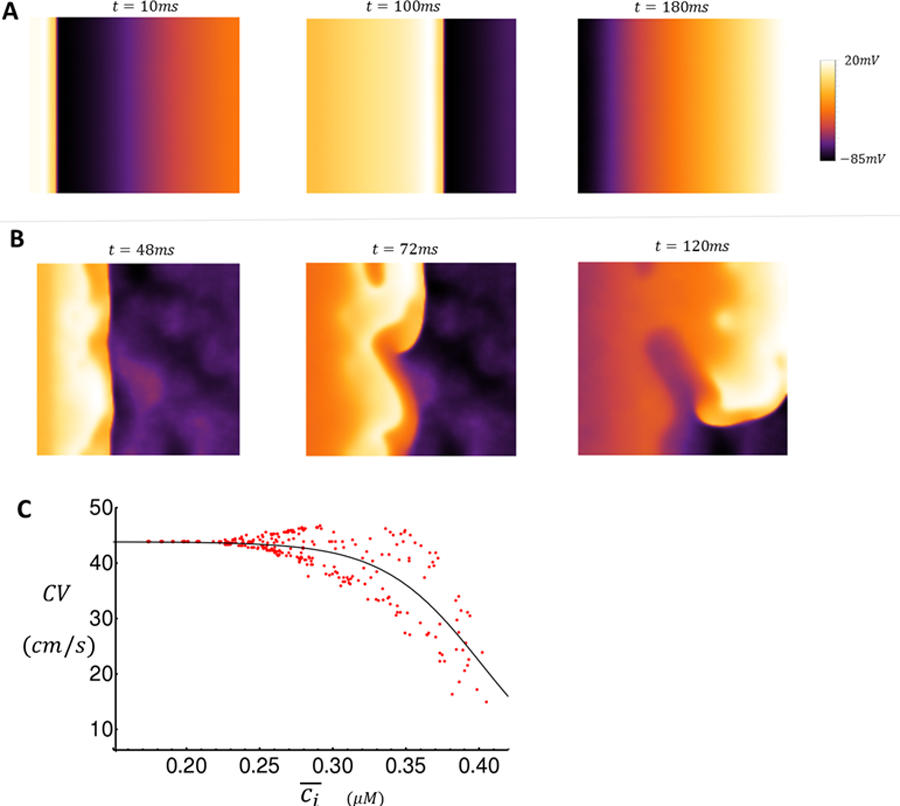
Results: At 3.3 to 5 Hz, TCWs occurred during the AP and often outlasted several AP cycles. Maximum diastolic potential was reduced, and AP duration was significantly prolonged during TCWs. All electrophysiological responses to TCWs were abolished by SEA0400 and ORM10103, indicating that Na-Ca exchange current caused depolarization. The time constant of recovery from inactivation of Ca2+ current was 40 to 70 ms in atrial myocytes (depending on holding potential) so this current could be responsible for AP activation during depolarization induced by TCWs. Modeling studies demonstrated that the characteristic properties of TCWs are potentially arrhythmogenic by promoting both conduction block and reentry arising from the depolarization induced by TCWs.

Conclusions: Triggered Ca2+ waves activate inward NCX and dramatically reduce atrial maximum diastolic potential and prolong AP duration, establishing the substrate for reentry which could contribute to the initiation and maintenance of atrial arrhythmias.

Keywords: action potential; atrial fibrillation; calcium channel; computer simulation; diastole.


Figures

Figure 1.
Figure 1.
Effects of triggered calcium waves on membrane potential (Vm). The image shows a confocal Xt-linescan recording (top) with simultaneous voltage Vm (middle trace) and mean F vs time profile (Ft, bottom trace) of a dog left atrial myocyte paced at BCL=300ms. Fluorescence intensity scale is presented in arbitrary fluorescence units.
Figure 2.
Figure 2.
The ΔVm-ΔCa2+ relationship during triggered Ca2+ waves (TCWs). A. The superposition (top) of Vm and fluorescence from Figure 1 during rapid pacing. B. Method for measuring Vm and Ca2+: the mean fluorescence and corresponding voltage changes were measured immediately prior to the stimulus and compared to Vm immediately prior to beginning of a TCW (from expanded section in red from A). The horizontal black line indicates MDP in the absence of a wave. Arrows indicate Vm at which MDP was measured. C. Relationship between TCW magnitude and the magnitude of depolarization. D-E. Summary data from 7 myocytes (3 dogs) at 200ms pacing (D) and 5 myocytes (3 dogs) at 300 ms pacing (E).
Figure 3.
Figure 3.
Relationship between TCWs and change in APD and number of cycles affected by TCWs. A. Representative recording of APD prolongation during a TCW showing how APD at −20mV (APD-20) and APD at −50mV (APD-50) were measured. Values in milliseconds are indicated above each horizontal line within the AP waveform at APD-20 and APD-50. B. Summarized changes in APD during TCWs (CL = 300 msec). n = 25 waves in 12 myocytes from 6 dogs. * p<0.02; p<0.001 as determined by t-test. C. Summary of number of consecutive APs affected by each TCW at BCL= 200 and 300 msec. n = 29–43 myocytes in 4–6 dogs for each condition. NS as determined by t-test.
Figure 4.
Figure 4.
TCW effect on membrane potential in the absence and presence of NCX blockade A-B. Vm, linescan images and average fluorescence recordings from an experiment in which TCWs (CL = 200 ms) before (A) and during (B) superfusion with SEA0400. C. Expanded scale recordings from A and B. D. Summarized ΔVm-ΔCa2+ relationships before and during SEA0400 from this experiment. D. Summary of all results paired results of four myocytes (3 dogs) in which recordings were obtained before and during superfusion with SEA at CL = 200ms. E. Summary of results from all unpaired (11 myocytes/6 dogs in control; 7 myocytes/4 dogs during SEA) and F paired experiments (4 cells/3dogs). * p<0.05; p<0.001 by t-test.
Figure 5.
Figure 5.
Intracellular Ca2+ concentration and membrane voltage as a function of time during rapid pacing. A. Average cytosolic Ca2+ concentration Ci is shown for the last 36 beats. Large Ca2+ releases indicate TCWs. B. Membrane voltage V (t) as a function of time. C. Time course of Ik1 and INCX for the time interval enclosed by the dashed rectangle indicated in A-B.
Figure 6.
Figure 6.
The effect of ionic conductances on membrane depolarization due to TCWs. (A) Ca2+ transient recorded from simulation shown in Figure 5 and used as a Ca2+ clamp to drive the AP model. (B) Voltage time course of atrial AP model with gNCX = 1 (black line) and gNCX = 0.1 (red line). (C) Plot of ΔV vs NCX proportionality factor gNCX for the penultimate beat. ΔV = V(t) − Vmin, where t is the time of the last AP upstroke (red arrow) and where Vmin = −89mV is the resting potential of the ionic model. (D) Plot of ΔV vs Ik1 proportionality factor gIK1.
Figure 7.
Figure 7.
Snapshots of wave propagation on 2D tissue (A–B) and dependence of CV on Ca2+ concentration (C). A. Snapshots of AP propagation (CL = 300ms) in the absence of TCWs at indicated times after the 10th paced beat. B. Snapshots of voltage distribution when TCWs occur at the indicated times after the 16th paced beat. C. Plot of CV vs ci¯. A cable of length lx = 100 cells and width ly = 5 is paced at 300ms for 50 beats at the first 10 cells. CV is measured as the speed of propagation between cells 10 and 100. Here, ci¯ is the average Ca2+ concentration in the strip of tissue at the time of each stimulus.

References

    1. Lau DH, Nattel S, Kalman JM, Sanders P. Modifiable Risk Factors and Atrial Fibrillation. Circulation. 2017;136:583–596. - PubMed
    1. Laredo M, Waldmann V, Khairy P, Nattel S. Age as a Critical Determinant of Atrial Fibrillation: A Two-sided Relationship. Can J Cardiol. 2018;34:1396–1406. - PubMed
    1. Hohendanner F, Heinzel FR, Blaschke F, Pieske BM, Haverkamp W, Boldt HL, Parwani AS. Pathophysiological and therapeutic implications in patients with atrial fibrillation and heart failure. Heart Fail Rev. 2018;23:27–36. - PubMed
    1. Hohendanner F, Messroghli D, Bode D, Blaschke F, Parwani A, Boldt LH, Heinzel FR. Atrial remodelling in heart failure: recent developments and relevance for heart failure with preserved ejection fraction. ESC Heart Fail. 2018;5:211–221. - PMC - PubMed
    1. Molina CE, Abu-Taha IH, Wang Q, Rosello-Diez E, Kamler M, Nattel S, Ravens U, Wehrens XHT, Hove-Madsen L, Heijman J, et al. Profibrotic, Electrical, and Calcium-Handling Remodeling of the Atria in Heart Failure Patients With and Without Atrial Fibrillation. Front Physiol. 2018;9:1383. - PMC - PubMed

Publication types

Substances