. 2020 Jul 22;107(2):351-367.e19.
doi: 10.1016/j.neuron.2020.04.023. Epub 2020 May 19.

Cortical Observation by Synchronous Multifocal Optical Sampling Reveals Widespread Population Encoding of Actions

Affiliations

Cortical Observation by Synchronous Multifocal Optical Sampling Reveals Widespread Population Encoding of Actions

Isaac V Kauvar et al. Neuron. .

Abstract

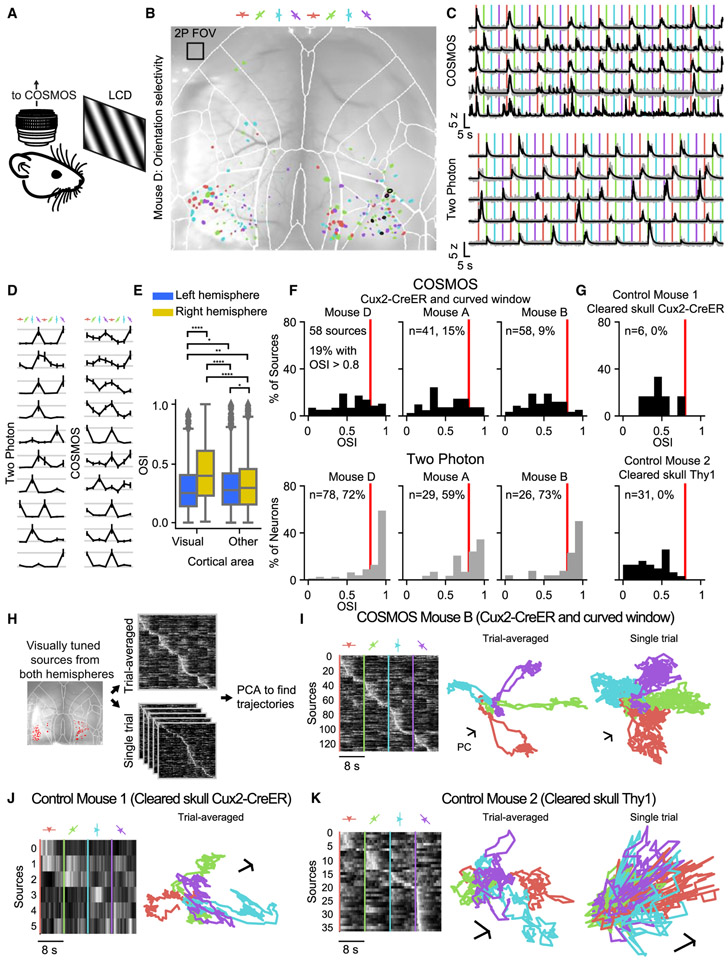
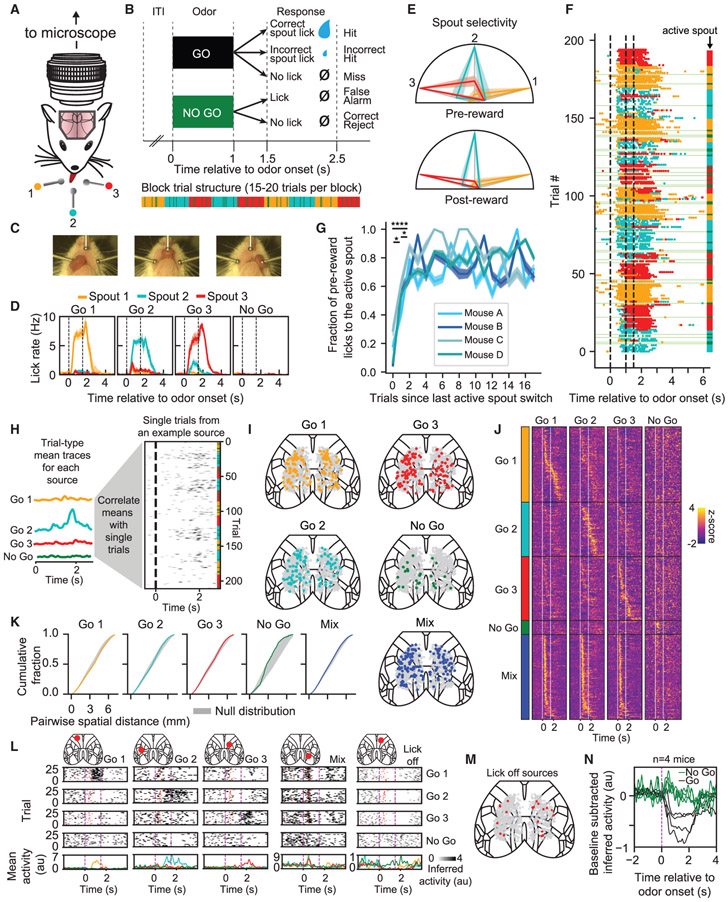
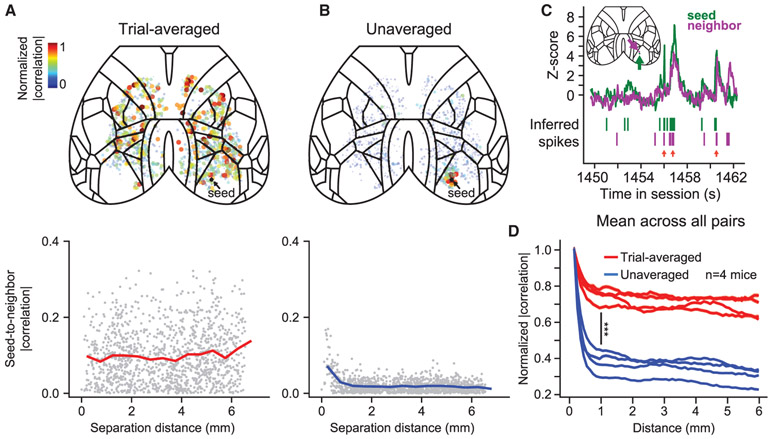
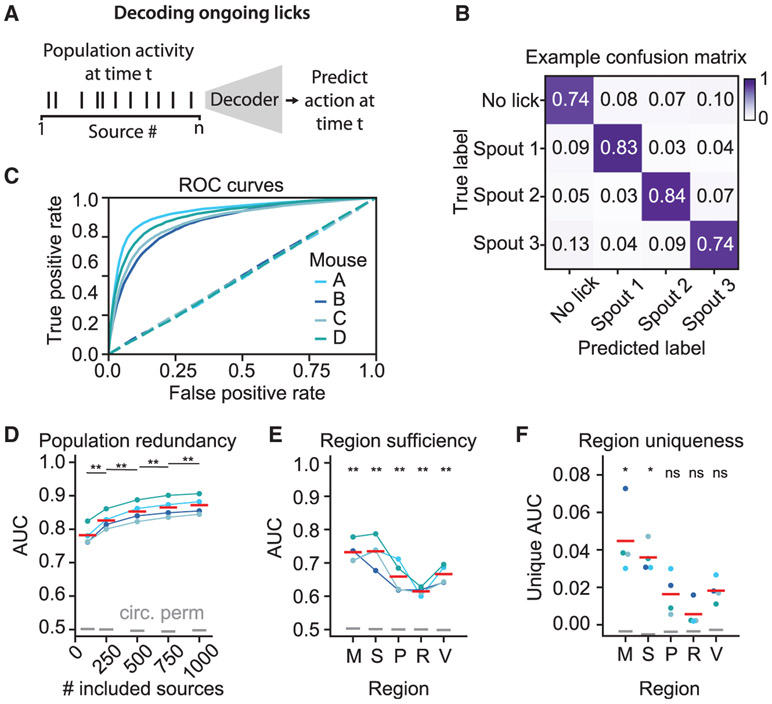
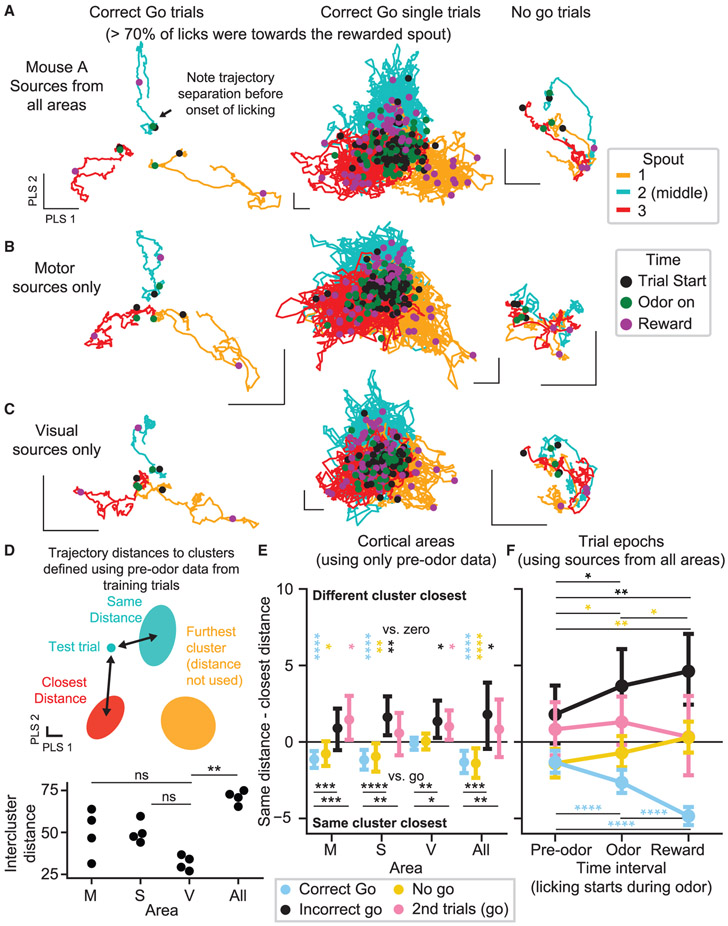
To advance the measurement of distributed neuronal population representations of targeted motor actions on single trials, we developed an optical method (COSMOS) for tracking neural activity in a largely uncharacterized spatiotemporal regime. COSMOS allowed simultaneous recording of neural dynamics at ∼30 Hz from over a thousand near-cellular resolution neuronal sources spread across the entire dorsal neocortex of awake, behaving mice during a three-option lick-to-target task. We identified spatially distributed neuronal population representations spanning the dorsal cortex that precisely encoded ongoing motor actions on single trials. Neuronal correlations measured at video rate using unaveraged, whole-session data had localized spatial structure, whereas trial-averaged data exhibited widespread correlations. Separable modes of neural activity encoded history-guided motor plans, with similar population dynamics in individual areas throughout cortex. These initial experiments illustrate how COSMOS enables investigation of large-scale cortical dynamics and that information about motor actions is widely shared between areas, potentially underlying distributed computations.

Keywords: COSMOS; calcium imaging; cortex; licking; motor planning; multifocal; neural decoding; neural dynamics; population dynamics; synchronous; widefield.


Conflict of interest statement

Declaration of Interests The authors have made all the designs and protocols for COSMOS freely available for nonprofit use; Stanford University is also submitting a patent application to further facilitate commercial translation.

Figures

Figure 1.
Figure 1.. COSMOS Enables Recovery of High SNR Neural Sources across the Curved Surface of Dorsal Cortex
(A) Schematic of cortical window superimposed upon the Allen Brain Atlas. (B) Example preparation. (C) Transgenic strategy (bottom) to drive sparse GCaMP expression (green; top) in superficial cortical layers. (D) COSMOS macroscope (left) and lenslet array (right). (E) Raw macroscope data contain two juxtaposed images focused at different depths (offset by 620 μm). (F) Point spread function captured using a 10-μm fluorescent source. (G) Light transmission versus a conventional macroscope at different aperture settings. (H) Merged image quality versus a conventional macroscope with the same light throughput. (I) Data processing pipeline. (J) Procedure for brain atlas alignment using intrinsic imaging. (K) Neural sources extracted versus a conventional macroscope (one mouse; n = 3 separate recordings per configuration; mean ± SEM; *Corrected p < 0.05, Kruskal-Wallis H test and post hoc t test). (L) Peak-signal-to-noise ratio (PSNR) for the best 100 sources recorded using each configuration. Circles represent outliers. (M) Example spatial footprints of extracted sources with f/2 macroscope. (N) Example spatial footprints with COSMOS. Numbering corresponds to traces in (O). (O) Example Z-scored traces from COSMOS.
Figure 2.
Figure 2.. Characterization of COSMOS Sources Using Visual Stimuli
(A) Sinusoidal grating stimuli were presented to mice during both COSMOS and two-photon imaging, using an identical monitor. (B) Highlighted COSMOS sources that were stimulus responsive (in a Cux2-CreER; Ai148 mouse; one-way ANOVA, p < 0.01). Box indicates 550 μm x 550 μm field-of-view size for the two-photon microscope used to collect comparative data. (C and D) Single-trial (C) and peak-normalized trial-averaged (D) responses from selected visually responsive sources (from the mouse in B) from the right visual cortex under the COSMOS macroscope (top in C, right in D; black contours denote selected sources in B) and sources imaged under the two-photon microscope (bottom in C, left in D). In (D), vertical lines indicate grating onset times; error bars represent SEM. (E) Orientation selectivity index (OSI) distributions for all extracted sources within visual areas compared to sources in all other areas (pooled over three mice; corrected p values from Mann-Whitney U test are indicated). (F) OSI distributions plotted for all visually responsive sources in right visual areas, across three mice, under COSMOS (top) and two-photon microscopy (bottom). Red lines denote OSI = 0.8. Fraction of sources with OSI > 0.8 indicated as percentages. (G) OSI distributions for two additional mice (with cleared skulls but no windows). (H) Generation of neural trajectories using PCA. (I) Trial-averaged, visually responsive sources pooled across both visual cortices (from a single mouse), imaged under the COSMOS microscope (left). PCA trajectories for trial-averaged (middle) and single-trial data (right). Scale bars are arbitrary units but indicate an equivalent length in each dimension. (J and K) Trajectories for control mice 1 (J) and 2 (K) lacking cranial windows. *Corrected p < 0.05; **corrected p < 0.01; ***corrected p < 0.001; ****corrected p < 0.0001.
Figure 3.
Figure 3.. Behavioral and Neural Correlates of Specific Targeted Motor Actions
(A) Head-fixed behavioral task. (B) Trial structure. (C) Video frames illustrating mouse licking each spout. (D) Lick rate during each trial type averaged across n = 4 mice. Error bars represent SEM across animals. (E) Lick selectivity averaged across n = 4 mice. Error bars represent SEM across animals. Licks taken after odor presentation but before (left) or after (right) reward delivery. Colored lines represent normalized lick count toward each spout on trials when a given spout is active. (F) Raster showing all licks during a single experimental session. “No-go” trials are indicated in green. (G) Lick selectivity after active spout switch (error bars represent SEM; corrected p values from paired t test). (H) Analysis for establishing tuning of sources to different trial types. (I) Spatial distribution of task-related classes. (J) Trial-averaged traces, ordered by task-related class and cross-validated peak time. (K) Cumulative fraction of source separations at each distance. For this mouse, no task classes were significantly different than the null distribution (p > 0.05). (L) Example single-trial traces that exhibit different responses to each trial type. (M) All “lick off” sources from one mouse. (N) Averaged, baseline-subtracted, “lick off” sources for each mouse. *Corrected p < 0.05; ****corrected p < 0.0001.
Figure 4.
Figure 4.. Unaveraged Data Exhibit More Localized Correlation Structure Than Trial-Averaged Data
(A) Seeded trial-averaged activity correlations (for a single seed): top, spatial distribution; bottom, correlation versus distance to the seed (black dot). (B) Seeded unaveraged activity correlations (format matches that in A). (C) Example illustrating unaveraged activity correlation (locations indicated on atlas inset). Red arrows indicate time points when the seed source and its neighbor are active simultaneously. (D) Summary across all mice of correlation analyses shown in (A) and (B). Lines for each mouse represent the mean correlation across all pairs of sources (binned and normalized). Statistic shown at 1-mm distance (***corrected p = 0.0001, paired t test; n = 4 mice).
Figure 5.
Figure 5.. Representations of Distinct Motor Actions Are Distributed across Dorsal Cortex
(A) Schematic for decoding ongoing licks. (B) Row-normalized lick confusion matrix for one mouse. (C) Receiver operating characteristic (ROC) curve for each mouse, averaged across folds. Dashed lines indicate ROC curves for shuffled data. (D) Improvement in the area under the ROC curve (AUC) as more neural sources are included. Red lines indicate means across mice. Gray lines indicate circularly permuted control. Corrected p values from paired t test are shown for each of the sources versus the closest evaluated number of sources. (E) Decoding using only sources from within single cortical regions (using the 75 sources per area with best discrimination ability; M, motor; S, somatosensory; p,= parietal; R, retrosplenial; V, visual). Corrected p values for two-sided t test are shown for each region versus AUC = 0.5. (F) Unique contribution of each region to decoding accuracy, measured as 1 – AUC (without region)/AUC (with region). Corrected p values from two-sided t test are shown for each region versus AUC = 0.0. ns denotes corrected p > 0.05; *corrected p < 0.05; **corrected p < 0.01.
Figure 6.
Figure 6.. The Direction of Future Licks Is Encoded by Neurons Distributed across the Dorsal Cortex
(A) Schematic of approach. (B) Row-normalized confusion matrix predicting preferred spout location from pre-odor neural data (chance is 0.33). (C) Predictions for one behavioral session (training trials and trials that contain any licks during the pre-odor period are not shown). (D) Preferred spout neural decoding performance using data from three different time epochs. Red lines denote means across mice. Black lines and gray lines denote random shuffle and circularly permuted controls, respectively. (E) Pre-odor neural decoding performance quantified for: motor (M), somatosensory (S), parietal (p), retrosplenial (R), and visual (V) areas. Each area-specific decoder used the 75 sources with best discrimination ability. Corrected paired t test values are shown versus both random controls in (D) and (E). Error bars in (D) and (E) show 99% bootstrapped confidence intervals over 20 model fits to different sets of training data. (F) Pre-reward neural decoding of the spout most licked during the pre-reward period (purple) and fraction of pre-reward licks toward the active spout (cyan), shown as a function of location within a trial block. Note that both sets of lines use identical data taken from testing trials. (G) Pre-odor behavioral decoding performance using data from both lower and upper cameras and a decoder trained on motion energy principal components derived from both the upper and lower videos (1,000 from each). ns denotes corrected p > 0.05; *corrected p < 0.05; **corrected p < 0.01; ***corrected p < 0.001.
Figure 7.
Figure 7.. Population Neural Activity Encodes Upcoming Lick Bouts toward Specific Spouts
(A–C) Neural trajectories from mouse A (trial averaged in first and third columns, single-trial in second column). Basis vectors computed as in the previous figure using PLS regression on entire training trials and sources from all (A), only motor (B), or only visual (C) areas. Scale bars are arbitrary units but indicate an equivalent length in each dimension. (D) Schematic of analysis scheme used in (E) and (F). Bottom panel shows summed intercluster Mahalanobis distance for clusters fit to data from each mouse. Corrected p values from a paired t test are shown versus visual data. M, motor; S, somatosensory; V, visual, All, all sources. (E) Distributions of (same cluster Mahalanobis distances) – (next closest cluster distances). Data are pooled across four mice. Comparisons versus zero were computed using a Wilcoxon test. Comparisons versus “correct go” trials used a Mann-Whitney U test. 223 “correct go,” 110 “no go,” 29 “incorrect go,” and 37 second trials from 4 mice. (F) Format matches that of (E), using sources from all areas and comparing pre-odor clusters to single-test-trial trajectories averaged over different time epochs: before odor, during odor, and after reward onset. Statistics were computed across time intervals using a Wilcoxon test. Error bars in (E) and (F) show 99% bootstrapped confidence intervals. ns denotes corrected p > 0.05; *corrected p < 0.05; **corrected p < 0.01; ***corrected p < 0.001; ****corrected p < 0.0001. All statistical comparisons were FDR (false discovery rate) corrected, and comparisons that yielded corrected p > 0.05 are not shown in (E) and (F).

Similar articles

Cited by

References

    1. Abrahamsson S, Chen J, Hajj B, Stallinga S, Katsov AY, Wisniewski J, Mizuguchi G, Soule P, Mueller F, Dugast Darzacq C, et al. (2013). Fast multicolor 3D imaging using aberration-corrected multifocus microscopy. Nat. Methods 10, 60–63. - PMC - PubMed
    1. Akrami A, Kopec CD, Diamond ME, and Brody CD (2018). Posterior parietal cortex represents sensory history and mediates its effects on behaviour. Nature 554, 368–372. - PubMed
    1. Allen WE, Kauvar IV, Chen MZ, Richman EB, Yang SJ, Chan K, Gradinaru V, Deverman BE, Luo L, and Deisseroth K (2017). Global Representations of Goal-Directed Behavior in Distinct Cell Types of Mouse Neocortex. Neuron 94, 891–907.e6. - PMC - PubMed
    1. Barthas F, and Kwan AC (2017). Secondary Motor Cortex: Where ‘Sensory’ Meets ‘Motor’ in the Rodent Frontal Cortex. Trends Neurosci. 40, 181–193. - PMC - PubMed
    1. Bouchard MB, Voleti V, Mendes CS, Lacefield C, Grueber WB, Mann RS, Bruno RM, and Hillman EMC (2015). Swept confocally-aligned planar excitation (SCAPE) microscopy for high speed volumetric imaging of behaving organisms. Nat. Photonics 9, 113–119. - PMC - PubMed

Publication types

LinkOut - more resources