. 2020 Jun 8;53(5):603-617.e8.
doi: 10.1016/j.devcel.2020.04.019. Epub 2020 May 19.

Microtubule Nucleation Properties of Single Human γTuRCs Explained by Their Cryo-EM Structure

Affiliations

Microtubule Nucleation Properties of Single Human γTuRCs Explained by Their Cryo-EM Structure

Tanja Consolati et al. Dev Cell. .

Abstract

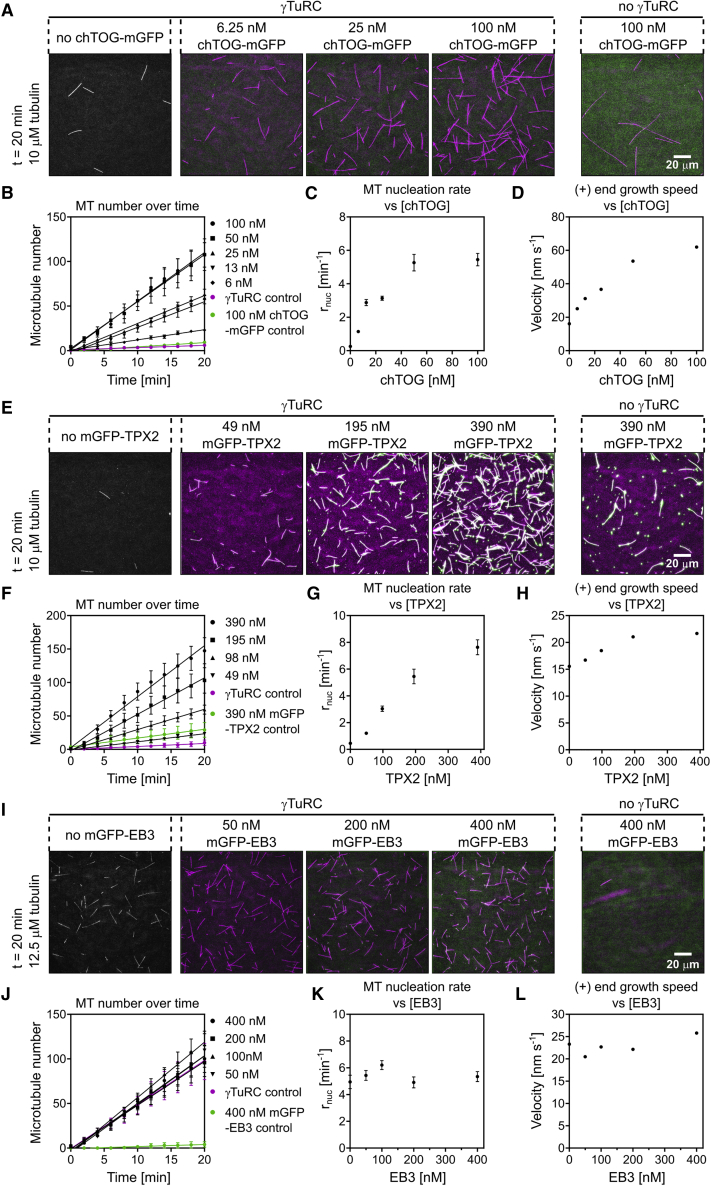
The γ-tubulin ring complex (γTuRC) is the major microtubule nucleator in cells. The mechanism of its regulation is not understood. We purified human γTuRC and measured its nucleation properties in a total internal reflection fluorescence (TIRF) microscopy-based real-time nucleation assay. We find that γTuRC stably caps the minus ends of microtubules that it nucleates stochastically. Nucleation is inefficient compared with microtubule elongation. The 4 Å resolution cryoelectron microscopy (cryo-EM) structure of γTuRC, combined with crosslinking mass spectrometry analysis, reveals an asymmetric conformation with only part of the complex in a "closed" conformation matching the microtubule geometry. Actin in the core of the complex, and MZT2 at the outer perimeter of the closed part of γTuRC appear to stabilize the closed conformation. The opposite side of γTuRC is in an "open," nucleation-incompetent conformation, leading to a structural asymmetry explaining the low nucleation efficiency of purified human γTuRC. Our data suggest possible regulatory mechanisms for microtubule nucleation by γTuRC closure.

Keywords: CLMS; MZT2; TIRF microscopy; TPX2; actin; chTOG; cryo-electron microscopy; microtubule nucleation; γ-tubulin ring complex; γTuRC structure.


Conflict of interest statement

Declaration of Interests The authors declare no competing interests.

Figures

None
Graphical abstract
Figure 1
Figure 1
Purification and Characterization of γTuRC-mBFP-BAP (A) Overview of purification steps. (B) Coomassie-stained SDS-PAGE of purified γTuRC. Protein bands corresponding to γTuRC subunits as identified by mass spectrometry are labeled. (C) Western blots of purified γTuRC using antibodies against γ-tubulin, GCP2, GCP4, actin, and mBFP. Biotinylation of the BAP was assessed by immunoblotting using horse radish peroxidase (HRP)-coupled streptavidin. (D) Negative-stain electron microscopy of purified γTuRC showing the expected 25-nm diameter ring structures. Two examples (white arrows) are shown as insets at higher magnification. (E) Schematic of TIRFM-based real-time γTuRC nucleation assay. Biotinylated fluorescent γTuRC is immobilized on a biotin-PEG-functionalized glass surface via NeutrAvidin. αβ-tubulin is added to initiate microtubule nucleation by immobilized γTuRC. (F) Representative TIRFM images showing the mBFP channel to visualize γTuRC on the surface (left panel) and showing the CF640R-tubulin channel to visualize nucleated microtubules (right panel) at t = 20 min after start of microtubule nucleation by a temperature jump to 33°C. 373 pM γTuRC was used for immobilization and the final CF640R-tubulin concentration was 15 μM. A representative control at 15 μM CF640R-tubulin without γTuRC is also shown. Intensities in the images are directly comparable. (G) Bar graph of the average microtubule number nucleated by surface-immobilized γTuRC (373 pM used for immobilization) within 15 min in presence of 15 μM CF640R-tubulin (n = 3). Error bars are SD. Scale bars as indicated. t = 0 is 2 min after placing the sample at 33°C. See also Figures S1 and S2A.
Figure 2
Figure 2
γTuRC Nucleates and Caps Microtubules at Their Minus End (A–C) Comparison between γTuRC microtubule nucleation assay and microtubule seed assay. Both assays were performed in the presence of 15 μM CF640R-tubulin. For γTuRC microtubule nucleation assay 373 pM γTuRC were used for immobilization. (A) Representative time series of individual microtubules (2 top rows of panels) nucleated on a γTuRC surface showing a static (purple arrow) and a fast-growing microtubule end. A control without γTuRC (bottom row) shows a microtubule growing from a stabilized microtubule “seed,” displaying two growing microtubule ends with the minus end (purple arrow) growing more slowly than the plus end. (B) Representative TIRFM kymographs of microtubules nucleated by surface-immobilized γTuRC. For comparison a kymograph of a microtubule grown from a microtubule seed at the same tubulin concentration is shown. (C) Box-and-whiskers plots of microtubule plus-end (top) and minus-end (bottom) growth speeds for γTuRC nucleation assays and microtubule seed assays. (D and E) mGFP-EB3 tracks the growing plus end of γTuRC nucleated microtubules. Assays were performed in the presence of 12.5 μM CF640R-tubulin and 200 nM mGFP-EB3 using 373 pM γTuRC for immobilization. Data were pooled from two independent experiments. Number of microtubule growth speeds measured per conditions: γTuRC nucleation assay, plus-end growth: n = 86, minus-end growth: n = 71; microtubule seed assay, plus-end growth: n = 110, minus-end growth: n = 123. For the box-and-whiskers plots, boxes range from 25th to 75th percentile, the whiskers span from 10th to 90th percentile, and the horizontal line marks the mean value. (D) Representative time series of merged TIRFM images of two individual microtubules (magenta) nucleated from a γTuRC surface. mGFP-EB3 (green, white arrow) tracks the growing microtubule plus end, while the microtubule minus end is static. (E) Corresponding TIRFM kymographs. (F and G) Microtubules are nucleated by single γTuRC molecules. Assays were performed in the presence of 20 μM CF640R-tubulin using 27 pM γTuRC for immobilization. (F) Representative time series of merged TIRFM images showing individual microtubules (magenta) nucleated from single immobilized γTuRC molecules (cyan, white arrow). (G) Corresponding TIRFM kymographs. All experiments were performed at 33°C. Scale bars as indicated. t = 0 is 2 min after placing the sample at 33°C. See also Figure S2B; Video S1. γTuRC Nucleated Microtubules Are Capped at Their Minus Ends, Related to Figure 2A, Video S2. mGFP-EB3 Tracks the Growing Microtubule Plus End of γTuRC Nucleated Microtubules, Related to Figure 2D, Video S3. Microtubules Originate from Single Immobilized γTuRC Molecules, Related to Figure 2F.
Figure 3
Figure 3
The Microtubule Nucleation Efficiency of γTuRC Depends on γTuRC Surface Density and Tubulin Concentration (A and B) Microtubule nucleation at 33°C in the presence of 15 μM CF640R-tubulin at varying γTuRC concentrations used for immobilization (23, 47, 93, 187, 249, and 373 pM). (A) Representative time series of TIRFM images at the indicated γTuRC concentrations (top panel). For comparison, spontaneous microtubule nucleation in the absence of γTuRC at the same tubulin concentration is shown (bottom panel). (B) Plots showing (i) a linear increase in microtubule number over time, (ii) the mean γTuRC surface density (mBFP fluorescence in the field of view), (iii) the mean microtubule plus-end growth speed, and (iv) the mean microtubule nucleation rate (bottom right) at different γTuRC concentrations. Number of microtubule growth speeds measured per conditions: 23 pM, n = 27; 47 pM, n = 64; 93 pM, n = 96; 187 pM, n = 191; 249 pM, n = 160; 373 pM, n = 302. (C and D) Microtubule nucleation in presence of 373 pM γTuRC used for immobilization at varying CF640R-tubulin concentrations (7.5, 10, 12.5, 15, 18, and 20 μM). (C) Representative time series of TIRFM images of microtubule nucleation in the presence of the indicated CF640R-tubulin concentrations (top panel). For comparison, spontaneous microtubule nucleation in the absence of γTuRC is shown for the highest tested tubulin concentration (20 μM) (bottom panel). Spontaneous microtubule nucleation was always much less than γTuRC-mediated nucleation comparing the same tubulin concentrations (not shown). (D) Plots showing (i) the linear increase in microtubule number over time, (ii) the mean γTuRC surface density (mBFP fluorescence in the field of view), (iii) the mean microtubule plus-end growth speed, and (iv) the mean microtubule nucleation rate at different tubulin concentrations. Arrows mark the critical tubulin concentration for microtubule elongation (gray) defined as the intercept of the fit in Figure 3Diii with the x axis and the minimal concentration required for γTuRC-mediated nucleation (purple) and for spontaneous nucleation in the absence of γTuRC (green) both defined empirically as the tubulin concentration at which on average 1 or more microtubules become visible within 20 min in the field of view (164 × 164 μm). Number of microtubule growth speeds measured per conditions: 7.5 μM, n = 9; 10 μM, n = 51; 12.5 μM, n = 210; 15 μM, n = 190; 18 μM, n = 237; 20 μM, n = 244. Data for plots were pooled from at least three independent experiments. The plot of the nucleation rate against tubulin concentration (see Figure 3Div) was fit using a power law function. All other lines represent a linear regression. Nucleation rates (rnuc) were taken from the slope of the linear regression of the increase of microtubule number over time (see Figures 3Bi and 3Di). All experiments were performed at 33°C. All error bars are SEM. For symbols without visible error bars, error bars are smaller than the symbol size. Field of view was always 164 × 164 μm. AU, arbitrary units. Fluorescence intensities are directly comparable. Scale bars as indicated. t = 0 is 2 min after placing the sample at 33°C. See also Figure S2C; Videos S4 and S5.
Figure 4
Figure 4
Microtubule Associated Proteins Can Increase the Microtubule Nucleation Efficiency of γTuRC (A–D) γTuRC-mediated microtubule nucleation in the presence of different chTOG-mGFP concentrations (6, 13, 25, 50, and 100 nM). Assays were performed in the presence of chTOG-mGFP and 10 μM CF640R-tubulin using 373 pM γTuRC for immobilization. (A) Representative TIRFM images of γTuRC-mediated microtubule nucleation in the presence of different chTOG-mGFP concentrations, as indicated. Microtubules are magenta, chTOG-mGFP is green. Plots showing, (B) linearly increasing microtubule numbers over time, (C) the mean microtubule nucleation rate, and (D) the mean microtubule growth speed at different chTOG-mGFP concentrations. Number of microtubule growth speeds measured per conditions: 23 pM, n = 27; 47 pM, n = 64; 93 pM, n = 96; 187 pM, n = 191; 249 pM, n = 160; 373 pM, n = 302. (E–H) γTuRC-mediated microtubule nucleation in the presence of different mGFP-TPX2 concentrations (49, 98, 195, and 390 nM). Assays were performed in the presence of mGFP-TPX2 and 10 μM CF640R-tubulin using 373 pM γTuRC for immobilization. (E) Representative TIRFM images of γTuRC-mediated microtubule nucleation in the presence of mGFP-TPX2 concentrations (green), as indicated. Plots showing, (F) linearly increasing microtubule numbers over time, (G) the mean microtubule nucleation rate, and (H) the mean microtubule growth speed at different mGFP-TPX2 concentrations. Number of microtubule growth speeds measured per conditions: 0 nM, n = 15; 49 nM, n = 50; 98 nM, n = 77; 195 nM, n = 143; 390 nM, n = 105. (I–L) γTuRC-mediated microtubule nucleation in the presence of different mGFP-EB3 concentrations (50, 100, 200, and 400 nM). Assays were performed in the presence of mGFP-EB3 and 12.5 μM CF640R-tubulin using 373 pM γTuRC for immobilization. (I) Representative merged TIRFM images of γTuRC-mediated microtubule nucleation in the presence of different mGFP-EB3 concentrations (green), as indicated. Plots showing, (J) linearly increasing microtubule numbers over time, (K) the mean microtubule nucleation rate, and (L) the mean microtubule growth speed at different mGFP-EB3 concentrations. Number of microtubule growth speeds measured per conditions: 0 nM, n = 210; 50 nM, n = 132; 100 nM, n = 230; 200 nM, n = 191; 400 nM, n = 290. As controls, representative TIRFM images in either the absence of microtubule associated proteins or absence of γTuRC are shown for the highest tested concentration of the various microtubule-associated proteins. Lines represent the linear regression. Nucleation rates (rnuc) were taken from the slope of the linear regression of the increase of microtubule number over time (see Figures 4B, 4F, and 4J). All experiments were performed at 33°C. All error bars are SEM. For symbols without visible error bars, error bars are smaller than the symbol size. Field of view was always 164 × 164 μm. AU, arbitrary units. Fluorescence intensities are directly comparable. Scale bars as indicated. t = 0 is 2 min after placing the sample at 33°C. See also Figures S3 and S4; Videos S6 and S7.
Figure 5
Figure 5
Cryo-EM Structure of Human γTuRC (A) Surface rendering of the cryo-EM structure viewed from the top and side. γTuRC is shaped like a cone with a base diameter of 300 and height of 200 Å. (B) γTuRC contains 14 stalk protomers that support 14 globular densities. Subunits in the lowermost position 1 and the uppermost position 14 are aligned. Docking of the human GCP4 crystal structure (PDB:3RIP) into any of the spiral cone positions reveals that the 14 stalk densities correspond to GCP proteins (position 1 is shown here as an example). A low resolution version of the cryo-EM map is shown to focus on the overall shape of the complex. (C) The 14 globular densities instead correspond to γ-tubulin, as revealed by atomic docking of PDB:1Z5V, here shown docked into position 8 as an example. Nucleotide density (GTPγS in the crystal structure used) is shown in red.
Figure 6
Figure 6
GCP Subunit Assignment (A) GCP2 and GCP3 are known to form a stable heterodimer. Homology modeling indicates that GCP3 contains a unique α-helical extension, resulting in a distinctive feature that radially departs from the GCP spiral structure. This structural feature allows us to assign GCP2 and GCP3 around the γTuRC complex. (B) GCP4 can be assign by docking the human crystal structure into the cryo-EM map. This fitting exercise, even in the absence of any further real-space refinement, allows us to appreciate the match between amino acidic side chains from the X-ray model and the density features in the cryo-EM map. We therefore assign GCP4 to positions 9 and 11 in the map. Rigid-body docking of N-terminal (GRIP1) and MID-C-terminal domains (GRIP2) is required to optimize the fitting of each individual structure. Cryo-EM density obtained with Phenix’s ResolveCryoEM is shown to highlight the fit of amino acidic side chains (central panel). The cryo-EM density sharpened with RELION post-processing is used elsewhere in the figure. (C) Top panel: circular representation of the CLMS results. Intra-subunit crosslinks are displayed as purple lines. Inter-subunit crosslinks are represented as green lines. Bottom panel: inter-molecular crosslinks between GCP subunits and actin help establish the subunit order around the γTuRC spiral. (D) GCP5 in position 10 contains a characteristic predicted helical extension in the MID domain. (E) Assigned to position 12, GCP6 contains the largest N-terminal extension (marked in black) and MID domain insertion (marked in red) among GCP protomers. Also see Figures S5 and S6.
Figure 7
Figure 7
Analysis of the Unassigned Cryo-EM Density in the γTuRC Complex (A) Unoccupied density appears to seal off the interface of GCP2 and GCP3, lining the outer perimeter of the GCP spiral (marked with an orange circle). A 90° tilted view highlights unassigned density can be observed departing from the C-terminal end of GCP3 in position 14 (shown in red). (B) The feature on the outer perimeter of the GCP spiral occupies the same position observed for Scp110 in γTuSC. CLMS identifies this feature as MZT2, as this factor is crosslinked with residues clustered on the outer face of the GCP2-GCP3 interface across a region of diameter smaller than 60 Å. (C) Two orthogonal views corresponding to additional density found in the lumen of the γTuRC spiral. Part of this density can be assigned to actin (magenta), which was found to be co-purified in our preparation. Additional unassigned density shown in gray contains three recognizable alpha helical bundles. (D) The luminal density bridges γ-tubulin in position 2 and GCP3 in position 8. Also see Figure S6.

Comment in

References

    1. Abella J.V., Galloni C., Pernier J., Barry D.J., Kjær S., Carlier M.F., Way M. Isoform diversity in the Arp2/3 complex determines actin filament dynamics. Nat. Cell Biol. 2016;18:76–86. - PubMed
    1. Adams P.D., Afonine P.V., Bunkóczi G., Chen V.B., Davis I.W., Echols N., Headd J.J., Hung L.W., Kapral G.J., Grosse-Kunstleve R.W. PHENIX: a comprehensive Python-based system for macromolecular structure solution. Acta Crystallogr. D Biol. Crystallogr. 2010;66:213–221. - PMC - PubMed
    1. Afonine P.V., Poon B.K., Read R.J., Sobolev O.V., Terwilliger T.C., Urzhumtsev A., Adams P.D. Real-space refinement in PHENIX for cryo-EM and crystallography. Acta Crystallogr D Struct Biol. 2018;74:531–544. - PMC - PubMed
    1. Akhmanova A., Steinmetz M.O. Control of microtubule organization and dynamics: two ends in the limelight. Nat. Rev. Mol. Cell Biol. 2015;16:711–726. - PubMed
    1. Aldaz H., Rice L.M., Stearns T., Agard D.A. Insights into microtubule nucleation from the crystal structure of human gamma-tubulin. Nature. 2005;435:523–527. - PubMed

Publication types