. 2020 Jun 2;31(6):1189-1205.e13.
doi: 10.1016/j.cmet.2020.05.001. Epub 2020 May 19.

GLP-1 Receptor Signaling in Astrocytes Regulates Fatty Acid Oxidation, Mitochondrial Integrity, and Function

Affiliations

GLP-1 Receptor Signaling in Astrocytes Regulates Fatty Acid Oxidation, Mitochondrial Integrity, and Function

Katharina Timper et al. Cell Metab. .

Abstract

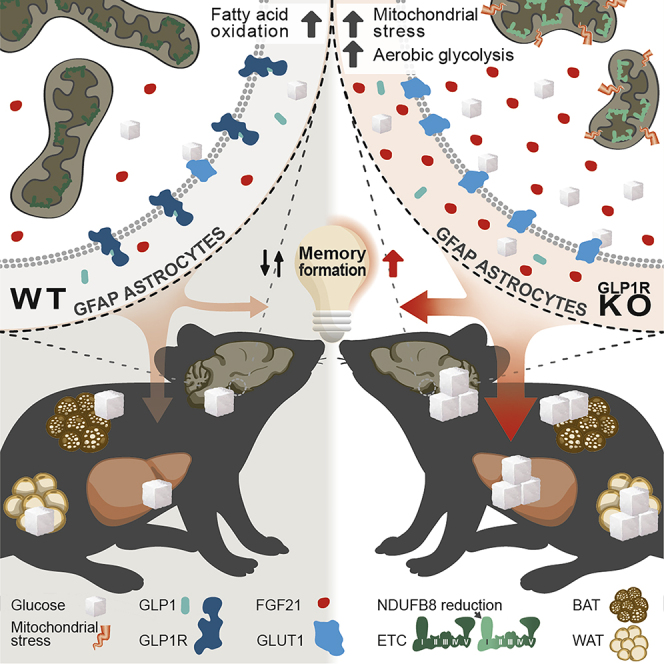
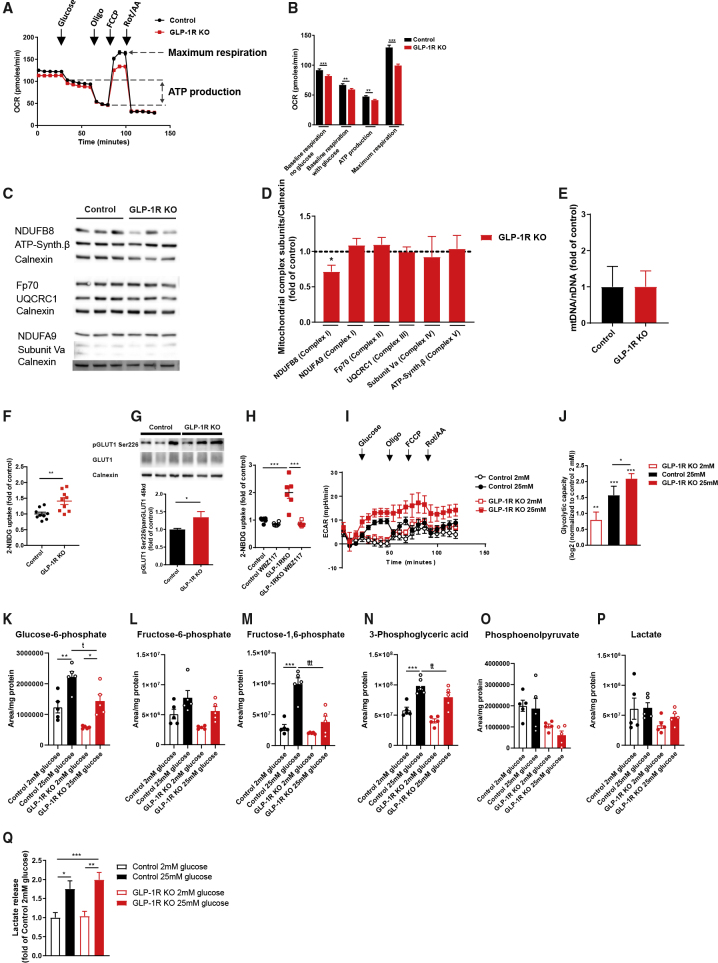
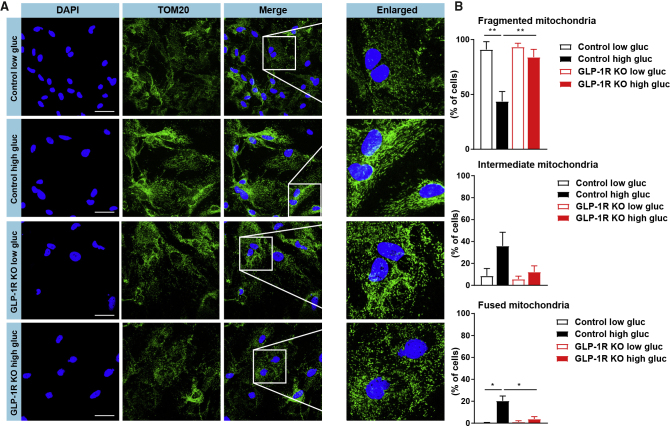
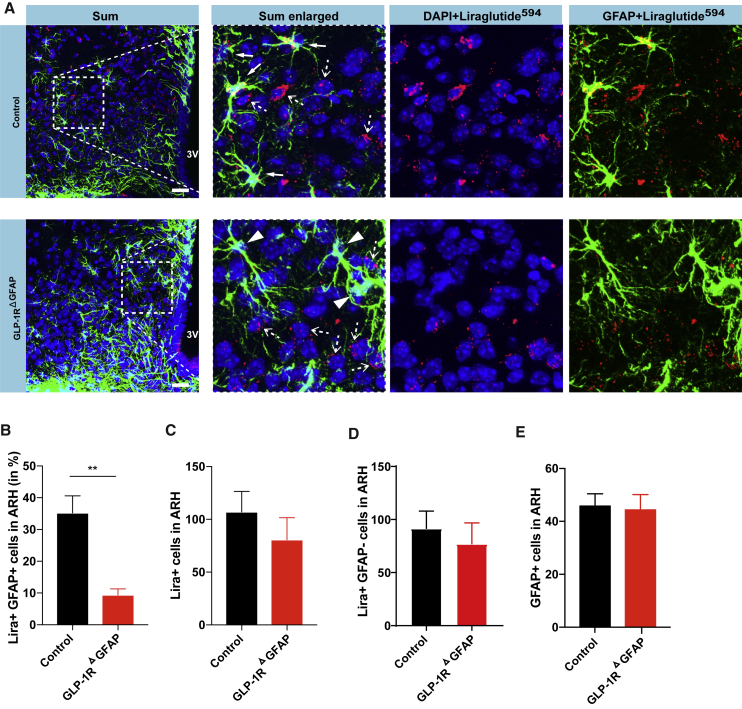
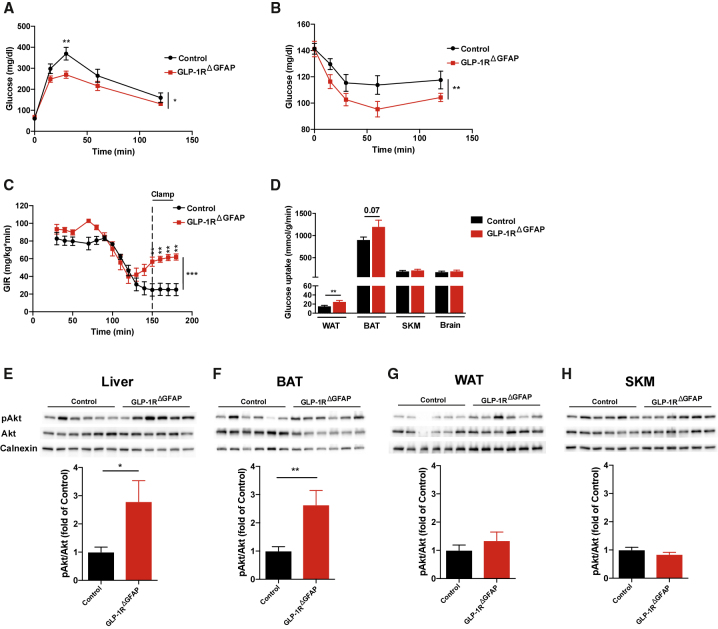
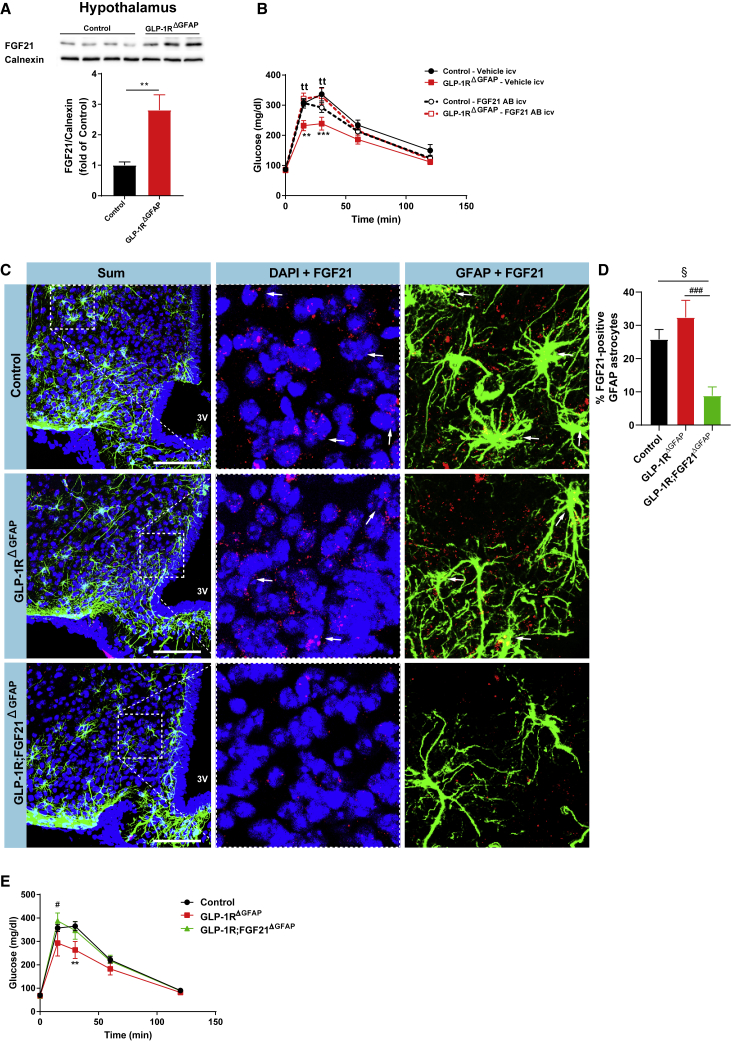
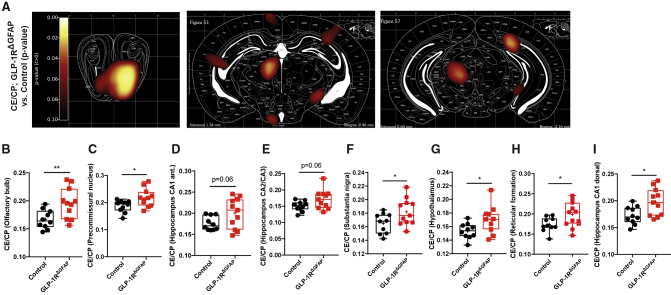
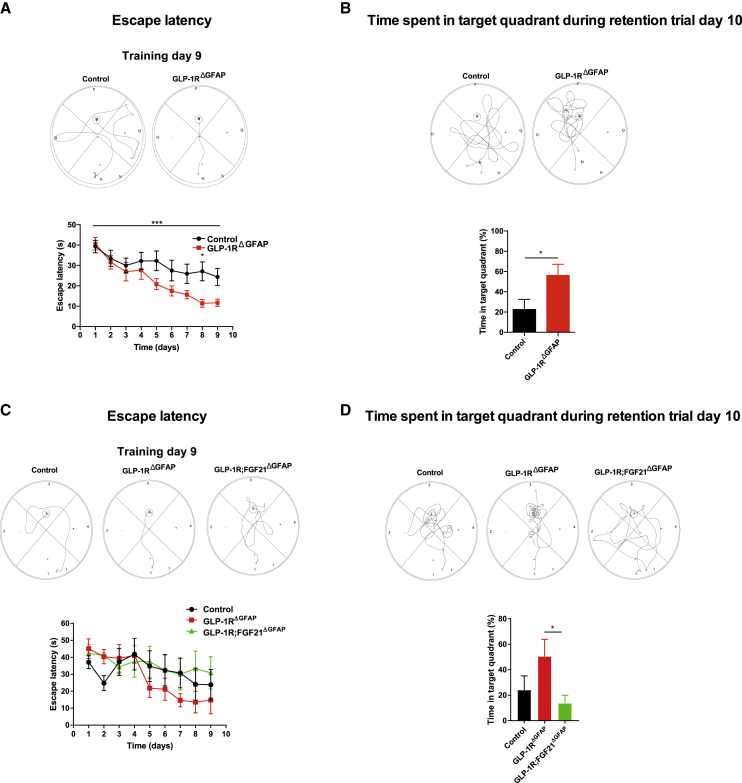
Astrocytes represent central regulators of brain glucose metabolism and neuronal function. They have recently been shown to adapt their function in response to alterations in nutritional state through responding to the energy state-sensing hormones leptin and insulin. Here, we demonstrate that glucagon-like peptide (GLP)-1 inhibits glucose uptake and promotes β-oxidation in cultured astrocytes. Conversely, postnatal GLP-1 receptor (GLP-1R) deletion in glial fibrillary acidic protein (GFAP)-expressing astrocytes impairs astrocyte mitochondrial integrity and activates an integrated stress response with enhanced fibroblast growth factor (FGF)21 production and increased brain glucose uptake. Accordingly, central neutralization of FGF21 or astrocyte-specific FGF21 inactivation abrogates the improvements in glucose tolerance and learning in mice lacking GLP-1R expression in astrocytes. Collectively, these experiments reveal a role for astrocyte GLP-1R signaling in maintaining mitochondrial integrity, and lack of GLP-1R signaling mounts an adaptive stress response resulting in an improvement of systemic glucose homeostasis and memory formation.

Keywords: FGF-21; GLP-1; astrocytes; energy homeostasis; glucose metabolism; hepatic glucose production; mitochondria; obesity; stress response; ß-oxidation.


Conflict of interest statement

Declaration of Interests The authors declare no competing interests.

Figures

None
Graphical abstract
Figure 1
Figure 1
GLP-1R Ablation in Hypothalamic Astrocytes Alters Mitochondrial Function Associated with Increased Glucose Uptake and Glycolytic Flux (A and B) Representative analysis (A) and quantification (B) of baseline oxygen consumption rate (OCR) before (no gluc) and after glucose (with gluc) administration. ATP-linked and maximum respiration OCR in GLP-1R-deficient (GLP-1R KO) and control hypothalamic astrocytes (representative experiment from n = 8 independently isolated astrocyte cultures). (C and D) Western blot analysis (C) and quantification of expression (D) of respiratory chain subunits in GLP-1R KO and control hypothalamic astrocytes (n = 4 independently isolated astrocyte cultures). (E) Mitochondrial content in GLP-1R KO and control hypothalamic astrocytes (ratio of mitochondrial DNA to nuclear DNA [mtDNA/nDNA]) (n = 3 independently isolated astrocyte cultures). (F) Glucose uptake in GLP-1R KO and control hypothalamic astrocytes (n = 9 independently isolated astrocyte cultures). (G) Representative immunoblots of Ser-226 GLUT-1 phosphorylation in GLP-1R KO and control hypothalamic astrocytes. Quantification of pSer226-GLUT1 levels was performed after normalization to total GLUT1 and calnexin as loading control (n = 12 independently isolated astrocyte cultures). (H) Glucose uptake in the presence or absence of the GLUT-1 inhibitor WBZ117 in GLP-1R KO and control hypothalamic astrocytes (n = 6 independently isolated astrocyte cultures). (I) Representative glycolytic flux analysis in GLP-1R KO and control hypothalamic astrocytes upon incubation with 2 or 25 mM glucose. (J) Log2-transfomed proportional values and quantification of glycolytic capacity normalized to control 2 mM glucose as described in (I) from n = 4 independently isolated astrocyte cultures. (K–P) Cellular glycolytic metabolites in GLP-1R KO and control hypothalamic astrocytes upon administration of 2 or 25 mM glucose for 1 h (n = 5 independently isolated astrocyte cultures). (Q) Lactate secretion of GLP-1R KO and control hypothalamic astrocytes upon administration of 2 or 25 mM glucose for 1 h (n = 15 independently isolated astrocyte cultures). Data are presented as mean ± SEM. p ≤ 0.05, ∗∗p ≤ 0.01, ∗∗∗p ≤ 0.001 as determined by unpaired Mann-Whitney test (D), two-tailed Student’s t test (B, F, and G), and two-way ANOVA followed by Bonferroni post hoc test (H and J–Q). See also Figures S1–S4.
Figure 2
Figure 2
Reduction of GLP-1R Expression Alters Mitochondrial Integrity in Hypothalamic Astrocytes (A) Representative confocal images of immunocytochemistry detection of TOM20 (green) and nuclear counterstaining (DAPI, blue) in cultured GLP-1R-deficient (GLP-1R KO) and control primary hypothalamic mouse astrocytes in response to a 20 min incubation with low glucose (2 mM glucose) or high glucose (25 mM glucose) after incubation at 2 mM glucose. Scale bars, 50 μm. (B) Quantification of mitochondrial morphology in GLP-1R KO and control primary hypothalamic mouse astrocytes upon treatment conditions as described in (A) (n = 3 independently isolated astrocyte cultures). Data are presented as mean ± SEM. p ≤ 0.05, ∗∗p ≤ 0.01 as determined by two-way ANOVA followed by Bonferroni post hoc test.
Figure 3
Figure 3
Generation of a Mouse Model with Inducible Astrocyte-Specific GLP-1R Deletion Representative confocal images (A) and quantification (B–E) of immunohistochemistry detection of liraglutide594 uptake (red), GFAP (green), and corresponding nuclear counterstaining (DAPI, blue) in the arcuate nucleus of the hypothalamus (ARH) of GLP-1RΔGFAP and control mice (n = 4 mice per genotype). Filled arrows, liraglutide594-positive, GFAP-double-positive cells; dotted arrows, liraglutide594-positive, GFAP-negative cells; arrowheads, liraglutide594-negative, GFAP-positive cells. 3V, third ventricle, Scale bars, 100 μm. Data are presented as mean ± SEM of (B) the percentage of liraglutide594-positive, GFAP-positive astrocytes; (C) the average number of all liraglutide594-positive cells; (D) the average number of all liraglutide594-positive, GFAP-negative cells; and (E) all GFAP-positive cells per hemi-ARH. ∗∗p ≤ 0.01 as determined by two-tailed, unpaired Student’s t test (B–E).
Figure 4
Figure 4
Impaired Astrocyte GLP-1R Signaling Improves Systemic Glucose Homeostasis (A and B) Glucose tolerance test (A) and insulin tolerance test (B) in GLP-1RΔGFAP and control mice (n = 10–12 per genotype). (C and D) Glucose infusion rate (GIR) (C) and organ-specific glucose uptake rates (D) in perigonadal white adipose tissue (WAT), brown adipose tissue (BAT), skeletal muscle (SKM), and brain during hyperinsulinemic-euglycemic clamp studies (n = 9–10 per genotype). (E–H) Representative immunoblots showing phosphorylation of AKT (p-AKT) determined in clamped (E) liver, (F) BAT, (G) WAT, and (H) SKM samples of GLP-1RΔGFAP and control mice (n = 9–10 per genotype). Quantification of p-AKT levels was performed after normalization to total AKT and calnexin as loading control. Data are represented as mean ± SEM. p ≤ 0.05, ∗∗p ≤ 0.01, ∗∗∗p ≤ 0.001 as determined by two-way ANOVA with repeated-measurements (time) followed by Bonferroni post hoc test (A–C) and two-tailed, unpaired Student’s t test (D–H). See also Figure S5.
Figure 5
Figure 5
Neutralization of Central FGF21 or Astrocyte-Specific Ablation of FGF21 Attenuates Improvements in Glucose Metabolism in GLP-1RΔGFAP Mice (A) Representative immunoblot and quantification of FGF21 protein expression in hypothalamic extracts of GLP-1RΔGFAP and control mice. Quantification of FGF21 levels was performed after normalization to calnexin as loading control (n = 3–4 per genotype). (B) Glucose tolerance test (GTT) in GLP-1RΔGFAP and control mice upon intracerebroventricular injection with a neutralizing FGF21 antibody (AB) or vehicle (IgG AB) (n = 14–24 per group). (C) Representative confocal images of in situ hybridization of mRNA of FGF21 (red), immunohistochemistry of GFAP (green), and corresponding nuclear counterstaining (DAPI, blue) in the arcuate nucleus of the hypothalamus (ARH) of GLP-1RΔGFAP, GLP-1R;FGF21ΔGFAP, and control mice . Arrows indicate FGF21-positive, GFAP-double-positive cells. Scale bars, 100 μm. (D) Quantification of the percentage of FGF21-positive GFAP astrocytes per hemi-ARH (n = 8 animals per genotype). (E) GTT in GLP-1RΔGFAP, GLP-1R;FGF21ΔGFAP, and control mice (n = 4–19 per genotype). Data are represented as mean ± SEM. ∗∗p ≤ 0.01 (A); ∗∗p ≤ 0.01, ∗∗∗p ≤ 0.001 (GLP-1R∆GFAP-vehicle versus control-vehicle), ttp ≤ 0.01 (GLP-1R∆GFAP-FGF21 AB versus GLP-1R∆GFAP-vehicle) (B), §p ≤ 0.05 (GLP-1R;FGF21∆GFAP versus control), ###p ≤ 0.001 (GLP-1R∆GFAP versus GLP-1R;FGF21∆GFAP) (D); #p ≤ 0.05 (GLP-1R∆GFAP versus GLP-1R;FGF21∆GFAP), ∗∗p ≤ 0.01 (GLP-1R∆GFAP versus control) (E), as determined by unpaired two-tailed Student’s t test (A) and by two-way ANOVA followed by Bonferroni post hoc test (B, D, and E).
Figure 6
Figure 6
Astrocyte-Specific GLP-1R Ablation Enhances Brain Glucose Availability (A) Images showing differential regional glucose uptake in 16 h-fasted GLP-1RΔGFAP versus control animals as determined by PET-CT. Color code represents the p value for the indicated voxels in an unpaired Student’s t test in 16 h-fasted GLP-1RΔGFAP versus control animals for n = 10–11 animals per genotype. Increases in glucose uptake are shown in red. (B–I) Quantification of brain glucose uptake in 16 h-fasted GLP-1RΔGFAP versus control animals in the (B) olfactory bulb, (C) precommisural nucleus, (D) hippocampus CA1 anterior, (E) hippocampus CA2/CA3, (F) substantia nigra, (G) hypothalamus, (H) reticular formation, and (I) hippocampus CA1 dorsal. Results are presented as boxplots. Upper and lower whiskers indicate the minimum and maximum values of the data, center lines indicate the median, and plus signs indicate the mean values. p ≤ 0.05, ∗∗p ≤ 0.01 as determined by unpaired two-tailed Student’s t test (B–I). See also Figures S6–S8.
Figure 7
Figure 7
Astrocyte-Specific GLP-1R Deficiency Enhances Memory Formation in an FGF21-Dependent Manner (A) Representative swimming task and quantification of escape latency during the indicated training days of a Morris water maze task of random-fed GLP-1RΔGFAP and control mice (n = 17 per genotype). (B) Representative swimming task and quantification of time spent in the target quadrant during retention trial upon 16 h overnight fasting (n = 6–8 per genotype) at day 10 of the Morris water maze task as described in (A). (C) Representative swimming task and quantification of escape latency during the indicated training days of a Morris water maze task of random-fed GLP-1RΔGFAP, GLP-1R;FGF21ΔGFAP, and control mice (n = 4–6 per genotype). (D) Representative swimming task and quantification of time spent in the target quadrant during retention trial upon 16 h overnight fasting at day 10 (n = 4–6 per genotype) of the Morris water maze task as described in (C). Data are represented as mean ± SEM. p ≤ 0.05, ∗∗∗p ≤ 0.001 as determined by two-way ANOVA followed by Tukey’s post hoc test (A, C, and D) and unpaired two-tailed Student’s t test (B). See also Figures S9 and S10.

References

    1. Agnew T., Goldsworthy M., Aguilar C., Morgan A., Simon M., Hilton H., Esapa C., Wu Y., Cater H., Bentley L. A Wars2 mutant mouse model displays OXPHOS deficiencies and activation of tissue-specific stress response pathways. Cell Rep. 2018;25:3315–3328.e6. - PMC - PubMed
    1. Akaike N., Harata N. Nystatin perforated patch recording and its applications to analyses of intracellular mechanisms. Jpn. J. Physiol. 1994;44:433–473. - PubMed
    1. Alvarez E., Roncero I., Chowen J.A., Thorens B., Blázquez E. Expression of the glucagon-like peptide-1 receptor gene in rat brain. J. Neurochem. 1996;66:920–927. - PubMed
    1. Alvarez E., Martínez M.D., Roncero I., Chowen J.A., García-Cuartero B., Gispert J.D., Sanz C., Vázquez P., Maldonado A., de Cáceres J. The expression of GLP-1 receptor mRNA and protein allows the effect of GLP-1 on glucose metabolism in the human hypothalamus and brainstem. J. Neurochem. 2005;92:798–806. - PubMed
    1. Athauda D., Maclagan K., Skene S.S., Bajwa-Joseph M., Letchford D., Chowdhury K., Hibbert S., Budnik N., Zampedri L., Dickson J. Exenatide once weekly versus placebo in Parkinson’s disease: a randomised, double-blind, placebo-controlled trial. Lancet. 2017;390:1664–1675. - PMC - PubMed

Publication types

Substances

LinkOut - more resources