. 2020 May 19;52(5):808-824.e7.
doi: 10.1016/j.immuni.2020.04.007.

Heterogenous Populations of Tissue-Resident CD8+ T Cells Are Generated in Response to Infection and Malignancy

Affiliations

Heterogenous Populations of Tissue-Resident CD8+ T Cells Are Generated in Response to Infection and Malignancy

J Justin Milner et al. Immunity. .

Abstract

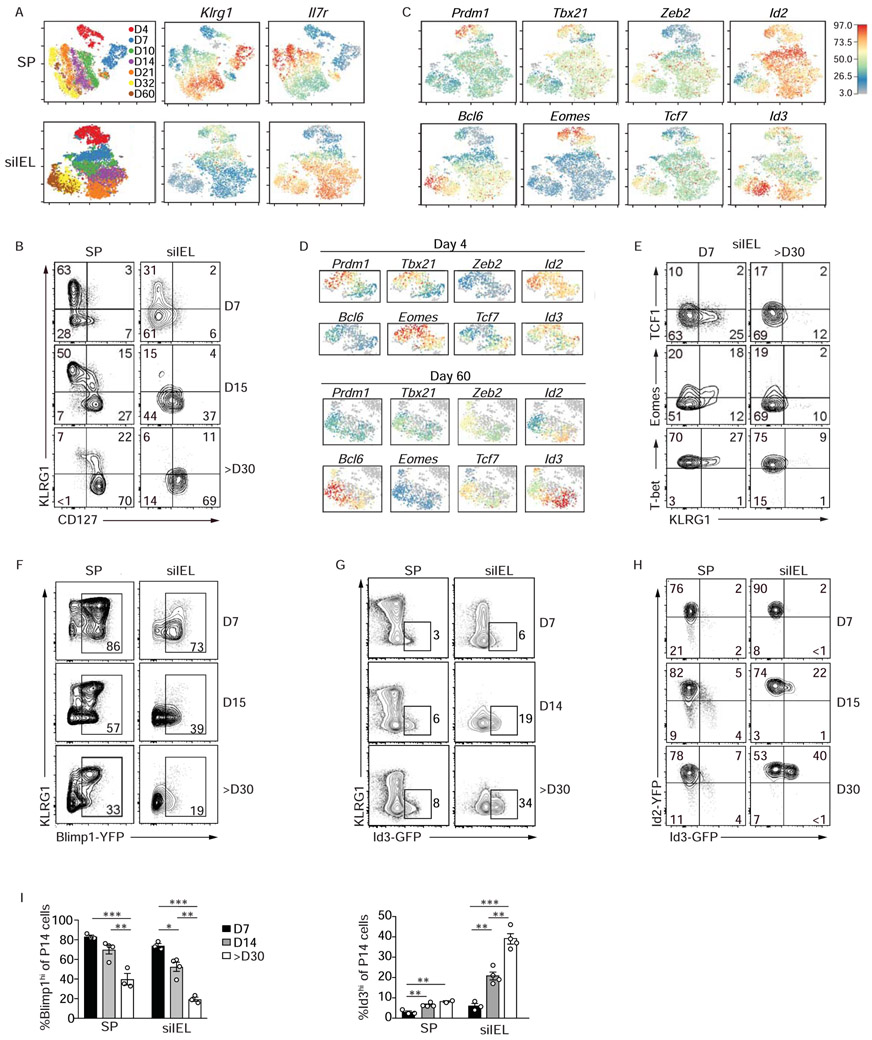
Tissue-resident memory CD8+ T cells (Trm) provide host protection through continuous surveillance of non-lymphoid tissues. Using single-cell RNA-sequencing (scRNA-seq) and genetic reporter mice, we identified discrete lineages of intestinal antigen-specific CD8+ T cells, including a Blimp1hiId3lo tissue-resident effector cell population most prominent in the early phase of acute viral and bacterial infections and a molecularly distinct Blimp1loId3hi tissue-resident memory population that subsequently accumulated at later infection time points. These Trm populations exhibited distinct cytokine production, secondary memory potential, and transcriptional programs including differential roles for transcriptional regulators Blimp1, T-bet, Id2, and Id3 in supporting and maintaining intestinal Trm. Extending our analysis to malignant tissue, we also identified discrete populations of effector-like and memory-like CD8+ T cell populations with tissue-resident gene-expression signatures that shared features of terminally exhausted and progenitor-exhausted T cells, respectively. Our findings provide insight into the development and functional heterogeneity of Trm cells, which has implications for enhancing vaccination and immunotherapy approaches.

Keywords: T cell; memory T cell; single-cell RNA-sequencing; tissue-resident memory T cells; tumor immunity.


Conflict of interest statement

Declaration of Interests A.W.G. is a member of the scientific advisory board for Pandion Therapeutics and Arsenal Biosciences.

Figures

Figure 1.
Figure 1.. The anti-viral tissue-resident siIEL CD8+ T cell population is heterogeneous.
P14 CD8+ T cells were transferred into congenically distinct hosts that were subsequently infected with LCMV i.p. Donor cells from the spleen and siIEL were sorted over the course of infection for bullk RNA-seq or scRNA-seq. (A) Heatmap illustrating the relative expression of genes differentially expressed among Tcm, Tem, and Trm cell populations from bulk RNA-seq analysis; gene clusters are ordered through K-means clustering analysis. Transcriptional regulators reported as important for Tcm (gray) and Tem (teal) cell-fate are highlighted (right). (B) To visualize relative expression levels in a triwise comparison (van de Laar et al., 2016), filtered genes differentially expressed and present within the designated gene list (see Table S1,S2) were plotted in a hexagonal diagram in which distance of an individual data point represents gene expression enrichment or depletion, and the magnitude of upregulation is reflected by the distance from the origin. Rose plots (upper right corner of each hexagonal plot) indicate the percentages of genes in each orientation. Genes of the core residency (green), core circulating (purple), effector (yellow), and memory (blue) signatures are highlighted. (C-F) scRNA-seq analysis across an infection time course. tSNE plots of cells from the siIEL or spleen (SP) over all infection timepoints (C) colored by indicated timepoint or (D) shaded by intensity of effector or memory gene signatures. (E) Principal component analysis of splenic scRNA-seq samples based on expression patterns of signature effector and memory genes. Day 4 (green), day 7 TE (yellow) or MP (purple), and day 60 LLEC (pink) or Tem/Tcm cells (blue) are highlighted while samples from remaining timepoints are shaded grey. (F) The siIEL CD8+ T cell samples (black) are projected onto the 2D space according to the same principal components. See also Tables S1 and S2.
Figure 2.
Figure 2.. Heterogeneous expression of key regulatory factors by siIEL CD8+ T cells.
P14 CD8+ T cells were transferred into congenically distinct hosts that were subsequently infected with LCMV i.p. Donor cells from the spleen and siIEL were sorted over the course of infection for scRNA-seq or were analyzed through flow cytometry. (A) tSNE plots of cells from the spleen (top) or siIEL (bottom) over all infection timepoints colored by sample (left) and intensity of Klrg1 (middle) or Il7r (right) mRNA levels. (B) Expression levels of CD127 and KLRG1 during LCMV infection. (C) Relative gene-expression of highlighted transcriptional regulators in siIEL cells following the map from A and in the spleen (Figure S1A). (D) Expression of indicated transcriptional regulators within siIEL CD8+ T cells at day 4 (top) or 60 (bottom) of infection. (E) Expression levels of indicated transcriptional regulators. (F-H) Blimp1-YFP, Id3-GFP or Id2-YFP/Id3-GFP P14 CD8+ T cells were transferred into congenically distinct hosts that were infected with LCMV i.p. At indicated times of infection, reporter expression was analyzed in the spleen and siIEL by flow cytometry (and in Figure S1B). (I) The percentage of Blimp1-YFPhi and Id3-GFPhi P14 cells in the spleen and siIEL are quantified. Numbers in plots represent the frequency of cells in the indicated gate. All data are from one representative experiment of 2 independent experiments with n=3-5 (B,E,H) or n=2-4 (F,G). Graphs show mean ± SEM; *p<0.05, **p<0.01, ***p<0.001. See also Figure S1.
Figure 3.
Figure 3.. Blimp1 and Id3 expression identifies distinct subsets of siIEL CD8+ T cells.
Congenically distinct Id3-GFP or Blimp1-YFP/Id3-GFP (double reporter) P14 CD8+ T cells were transferred to wild type hosts that were subsequently infected with LCMV or LM-GP33 o.g. (A) Blimp1-YFP and Id3-GFP reporter expression was assessed by flow cytometry in double reporter P14 cells from indicated host tissue over the course of the LCMV i.p. infection. (B) Quantification of the number of cells in the indicated populations from A. (C-D) Blimp1-YFP and Id3-GFP reporter expression in double reporter P14 cells from indicated host tissues on day 90 of LCMV i.p. infection (C) or from lung and draining LN (MedLN) on day 35 of an aspirated LCMV infection (D) is shown. (E) Id3-GFP P14 CD8+ T cells were adoptively transferred into recipient mice that were treated with DNFB on the left flank on day 4 of LCMV i.p. infection. The frequency of transferred P14 CD8+ T cells expressing Id3-GFP expression in the epidermis (top) and spleen (bottom) on day >30 following infection is indicated. (F) Blimp1-YFP and Id3-GFP reporter expression in double reporter P14 CD8+ T cells from host spleen and siIEL on days 7 and 16 following LCMV and LM-GP33 infection is compared. (G-H) On day 7 of infection, Id3hiBlimp1lo, Id3loBlimp1hi, and Id3loBlimp1lo P14 CD8+ T cells from the spleen and siIEL were sorted for RNA-sequencing. Principal component analysis (G) of gene expression from the sorted P14 CD8+ T cell populations is shown, or differentially expressed genes (H) between Id3hiBlimp1lo and Id3loBlimp1hi siIEL P14 CD8+ T cells are highlighted. (I-J) Blimp-YFP or Blimp1-YFP/Id3-GFP P14 CD8+ T cells transferred into congenically distinct hosts that were infected with LCMV i.p. were isolated from spleen and siIEL and analyzed on day 7 of infection for expression of Bcl2 (I) or indicated surface molecules (J) and Figure S1C-E. siIEL = small intestine intraepithelial lymphocytes; LP = small intestine lamina propria; BR= brain; WAT= white adipose tissue; SG = salivary gland; KID = kidney; LN = mesenteric lymph node; SP = spleen, LU =lung, MedLN = mediastinal lymph node. Numbers in plots represent the frequency (A,C,D,E,F) or gMFI (I,J) of cells in the indicated gate. All data are from one representative experiment of 2-3 independent experiments with n=3-5 (A-H,J) or cumulative from 2 independent experiments with a total n=6 (I). See also Figure S1.
Figure 4.
Figure 4.. Id3hi siIEL population shows greater memory potential relative to Blimp1hi siIEL cells.
(A-D) Blimp1-YFP/Id3-GFP P14 CD8+ T cells were transferred into congenically distinct hosts that were subsequently infected with LCMV i.p. On day 35 of infection, Id3hiBlimp1lo, Id3loBlimp1hi, and Id3loBlimp1lo P14 CD8+ T cells from the spleen (SP), mesenteric lymph node (LN), and siIEL were sorted for RNA-sequencing. (A) Principal component analysis of gene expression from the sorted P14 CD8+ T cell populations is shown. (B) Genes differentially expressed by Id3hiBlimp1lo and Id3loBlimp1hi P14 siIEL CD8+ T cells are highlighted. (C) Blimp1-YFP/Id3-GFP P14 CD8+ T cells transferred into congenically distinct hosts subsequently infected with LCMV i.p. were analyzed in spleen and siIEL on day 25-27 of infection. Expression of indicated molecules were compared between Id3hiBlimp1lo (teal) and Id3loBlimp1hi (orange) subsets. Numbers in plots represent gMFI. (D) GSEA for specified gene-expression signatures enriched in Id3hiBlimp1lo and Id3loBlimp1hi siIEL CD8+ T cell subsets. (E) Principal component analysis (from scRNA-seq dataset) of the spleen samples based on expression of genes in effector and memory gene-expression signatures. Day 4 (green), day 7 TE (yellow) or MP (purple), and day 60 LLE (pink) or Tem cells/Tcm cells (blue) are highlighted. The siIEL CD8+ T cells samples are projected to the 2D space according to the same principal components and enrichment for Id3hiBlimp1lo (blue), Id3loBlimp1hi (red), and Id3loBlimp1lo (green) gene signatures is indicated on siIEL populations. (F) After 30 days of LCMV i.p. infection, Blimp1-YFP/Id3-GFP P14 siIEL CD8+ T cells were restimulated in vitro with GP33-41 peptide then the Id3hiBlimp1lo and Id3loBlimp1hi populations were analyzed by flow cytometry for the surface expression of CD107a and the production of cytokine. Representative plots (left) and quantification (right) of indicated populations are shown. Numbers in plots represent the frequency of cells in the indicated gate. (G) Schematic of experimental set-up. Congenically distinct Blimp1-YFP/Id3-GFP P14 CD8+ T cells were transferred to wild-type hosts that were infected with LCMV i.p. More than 30 days after infection, Id3hiBlimp1lo, Id3loBlimp1hi, and Id3loBlimp1lo P14 CD8+ T cells were sorted from the siIEL, and then retransferred intravenously into congenically distinct hosts subsequently infected with LCMV i.p. After 30 days of infection, donor cells in the host spleen (SP) and siIEL were analyzed by flow cytometry. (H) Frequency of transferred cells among CD8+ T cells is shown. Numbers in plots represent the frequency of cells in the indicated gate (left). Quantification of indicated populations (right). All data are from one representative experiment of 2 independent experiments with n=3-4 (C) or 3-4 independent experiments with a total n=3-12 (F,H). Graphs are cumulative of all experimental repeats and show mean ± SEM; *p<0.05, **p<0.01. See also Figure S1.
Figure 5.
Figure 5.. Id2 and Id3 mediate the maintenance of the long-lived siIEL CD8+ T cell population.
(A) Schematic of experimental set-up. A mix of congenically distinct Id2f/f-ERCre+, Id3f/f-ERCre+, or Id2f/fId3f/f-ERCre+ (iKO) and corresponding wild type ER-Cre (WT) P14 CD8+ T cells were transferred to recipients that were subsequently infected with LCMV i.p. More than 30 days after infection, host mice were treated for 5 consecutive days with tamoxifen (Tam) to induce (B) Id3, (C) Id2 or (D) Id2 and Id3 deletion. Transferred P14 CD8+ T cells from host spleen and siIEL were analyzed by flow cytometry >30 days after the last Tam treatment. Frequency of WT and iKO cells among P14 CD8+ T cells (top left) and corresponding KLRG1 and CD127 expression (top right) is represented. The proportion of WT and iKO P14 CD8+ T cells within the CD127hi and CD127lo populations are also shown (bottom). (E) Quantification of indicated populations is displayed. (F) Phenotype of iId2/Id3 WT and DKO siIEL CD8+ T cells . Data are expressed as mean ± SEM. Numbers in plots represent frequency of cells in the indicated gate. All data are from one representative experiment of 2-3 independent experiments with n=3-5. Graphs show mean ± SEM; *p<0.05, **p<0.01. See also Figure S2 and S3.
Figure 6.
Figure 6.. Blimp1 and Id3 expression distinguish distinct CD8+ T cell subsets in tumors.
(A) Congenically distinct P14 CD8+ T cells were transferred into tumor-bearing mice, and seven days post adoptive transfer, P14 CD8+ T cells from spleens and tumors were sorted for scRNA-seq. UMAP plot of P14 CD8+ T cells from tumors and spleens. (B) UMAP plot indicating relative enrichment of a core tissue-residency signature (top) or enrichment of a core circulating signature (bottom). See also Figure S4A. (C) Representative flow cytometry plot demonstrating expression levels of Id3-GFP and Blimp1-YFP in P14 CD8+ T cells isolated from spleen or tumor (top). Expression plot from RNA-seq analysis of Blimp1hiId3lo and Blimp1loId3hi P14 CD8+ T cells from tumors (bottom left) and in Figure S4B,C. Relative expression levels of signature genes from Blimp1hi and Id3hi siIEL CD8+ T cells in Blimp1hiId3lo and Blimp1loId3hi P14 CD8+ T cells sorted from tumors. (D-E) UMAP plots (and in Figure S4A) indicating relative enrichment of the Blimp1hi (D) or Id3hi (E) siIEL CD8+ T cell signature in tumor localized P14 cells (left) as well as relative expression of highlighted genes (right). Red circle indicates distinct cluster of TIL enriched with the Id3hi Trm cell signature that also express elevated levels of genes upregulated in progenitor exhausted cells (Miller et al., 2019). (F) The CXCR5 (Im et al., 2016), B16 terminally/progenitor exhausted (Miller et al., 2019), and B16 TCF1 (Siddiqui et al., 2019) gene lists were used for gene set enrichment analyses in Id3hi cells relative to Blimp1hi cells. (G) Phenotype of Blimp1loId3hi, Blimp1loId3lo and Blimp1hiId3lo TIL. (H) Congenically distinct P14 CD8+ T cells were transduced with a Prdm1 shRNA encoding retrovirus (CD45.1+ P14 cells) or control shRNA (shCd19) encoding retrovirus (CD45.1+CD45.2+ P14 cells), mixed 1:1, and transferred into tumor bearing mice. Representative flow cytometry plots (top) and quantification (bottom) of the frequency of donor cells in the spleen, tumor draining lymph node, and tumor. Phenotype of Prdm1-deficient and control P14 CD8+ T cells from (H). Graphs show mean ± SEM of n=3-5 mice, from one representative experiment of 2 independent experiments. *p<0.05, ***p<0.005. See also Figure S4.

References

    1. Arsenio J, Kakaradov B, Metz PJ, Kim SH, Yeo GW, and Chang JT (2014). Early specification of CD8+ T lymphocyte fates during adaptive immunity revealed by single-cell gene-expression analyses. Nat Immunol 15, 365–372. - PMC - PubMed
    1. Banerjee A, Gordon SM, Intlekofer AM, Paley MA, Mooney EC, Lindsten T, Wherry EJ, and Reiner SL (2010). Cutting edge: The transcription factor eomesodermin enables CD8+ T cells to compete for the memory cell niche. J Immunol 185, 4988–4992. - PMC - PubMed
    1. Bergsbaken T, and Bevan MJ (2015). Proinflammatory microenvironments within the intestine regulate the differentiation of tissue-resident CD8(+) T cells responding to infection. Nat Immunol 16, 406–414. - PMC - PubMed
    1. Bergsbaken T, Bevan MJ, and Fink PJ (2017). Local Inflammatory Cues Regulate Differentiation and Persistence of CD8(+) Tissue-Resident Memory T Cells. Cell Rep 19, 114–124. - PMC - PubMed
    1. Beura LK, Mitchell JS, Thompson EA, Schenkel JM, Mohammed J, Wijeyesinghe S, Fonseca R, Burbach BJ, Hickman HD, Vezys V, et al. (2018a). Intravital mucosal imaging of CD8(+) resident memory T cells shows tissue-autonomous recall responses that amplify secondary memory. Nat Immunol 19, 173–182. - PMC - PubMed

Publication types

MeSH terms

Substances