. 2020 May 19;31(7):107654.
doi: 10.1016/j.celrep.2020.107654.

Zinc Finger RNA-Binding Protein Zn72D Regulates ADAR-Mediated RNA Editing in Neurons

Affiliations

Zinc Finger RNA-Binding Protein Zn72D Regulates ADAR-Mediated RNA Editing in Neurons

Anne L Sapiro et al. Cell Rep. .

Abstract

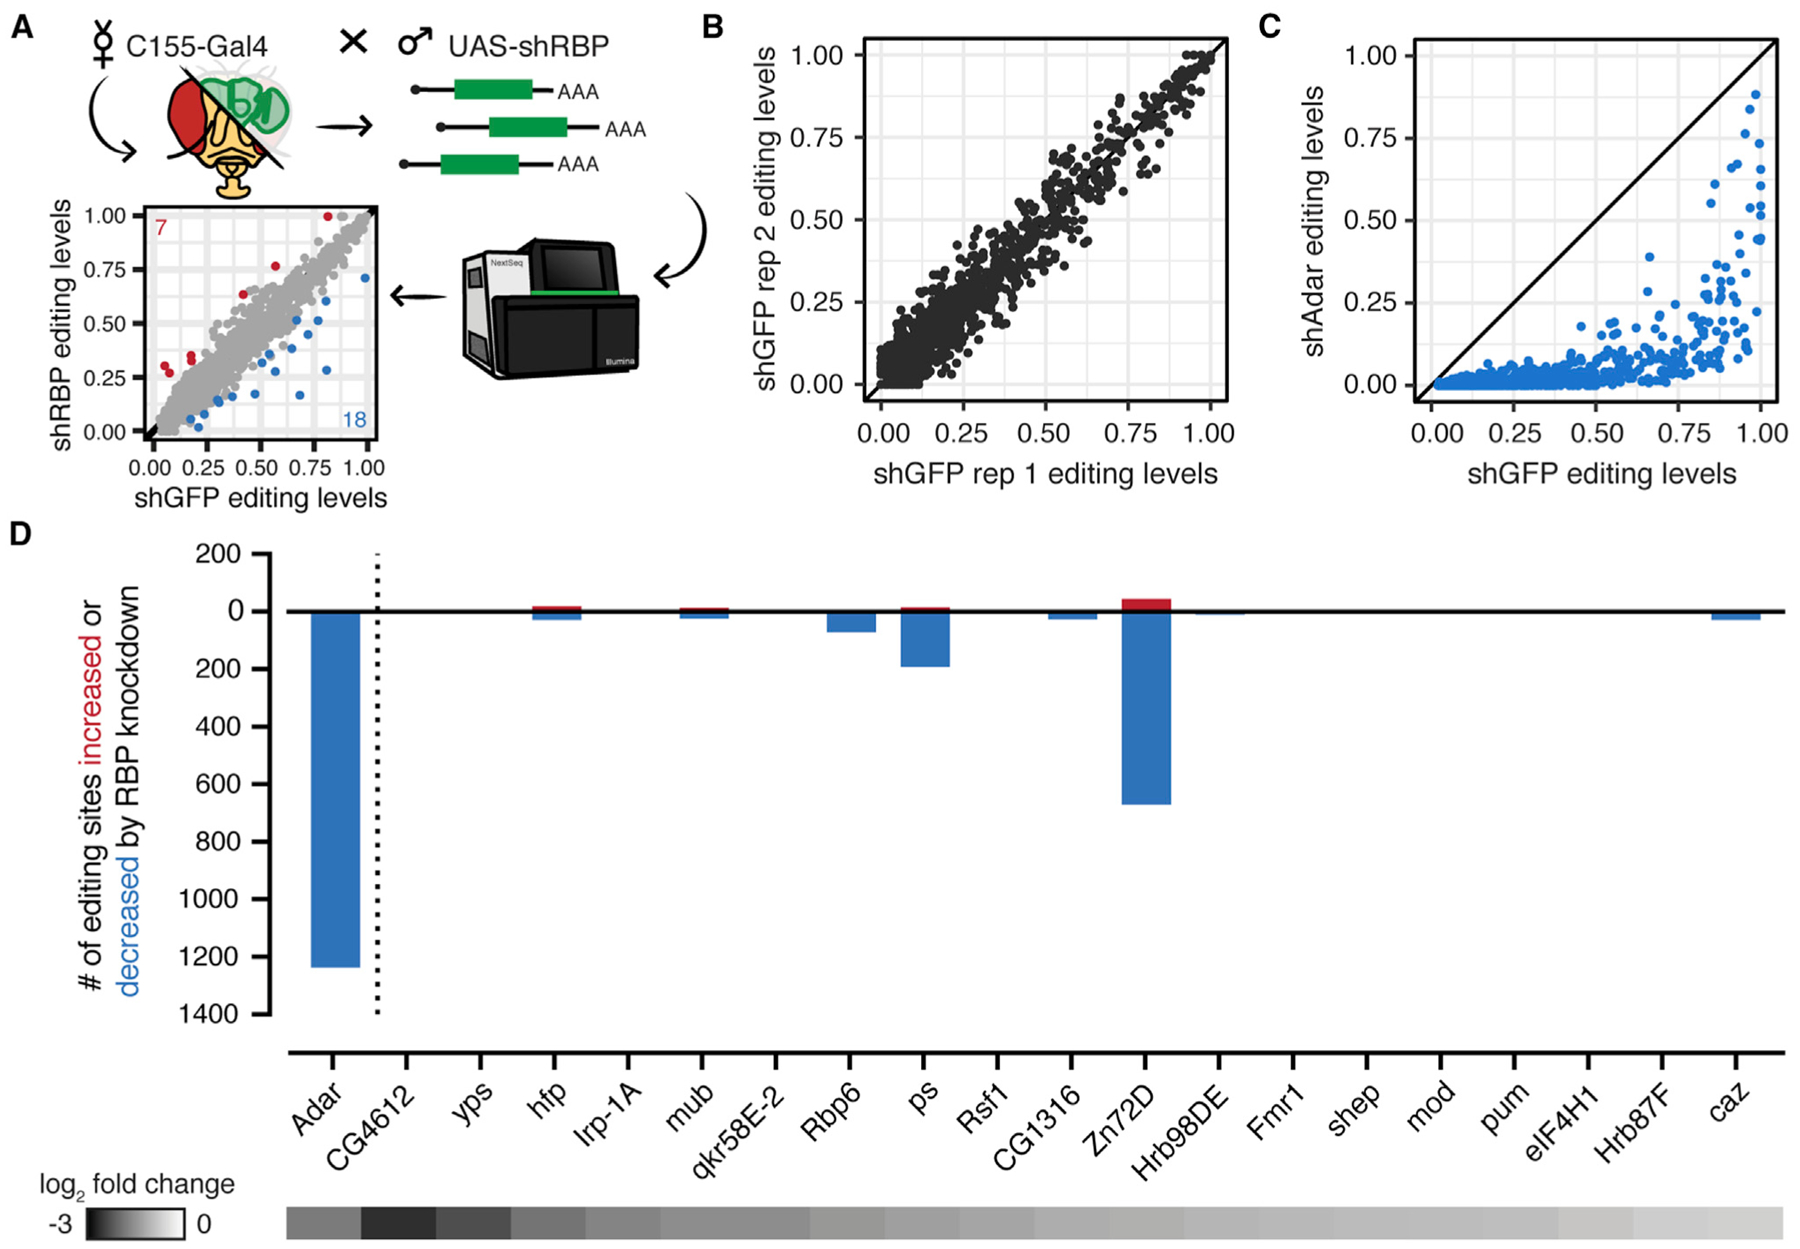
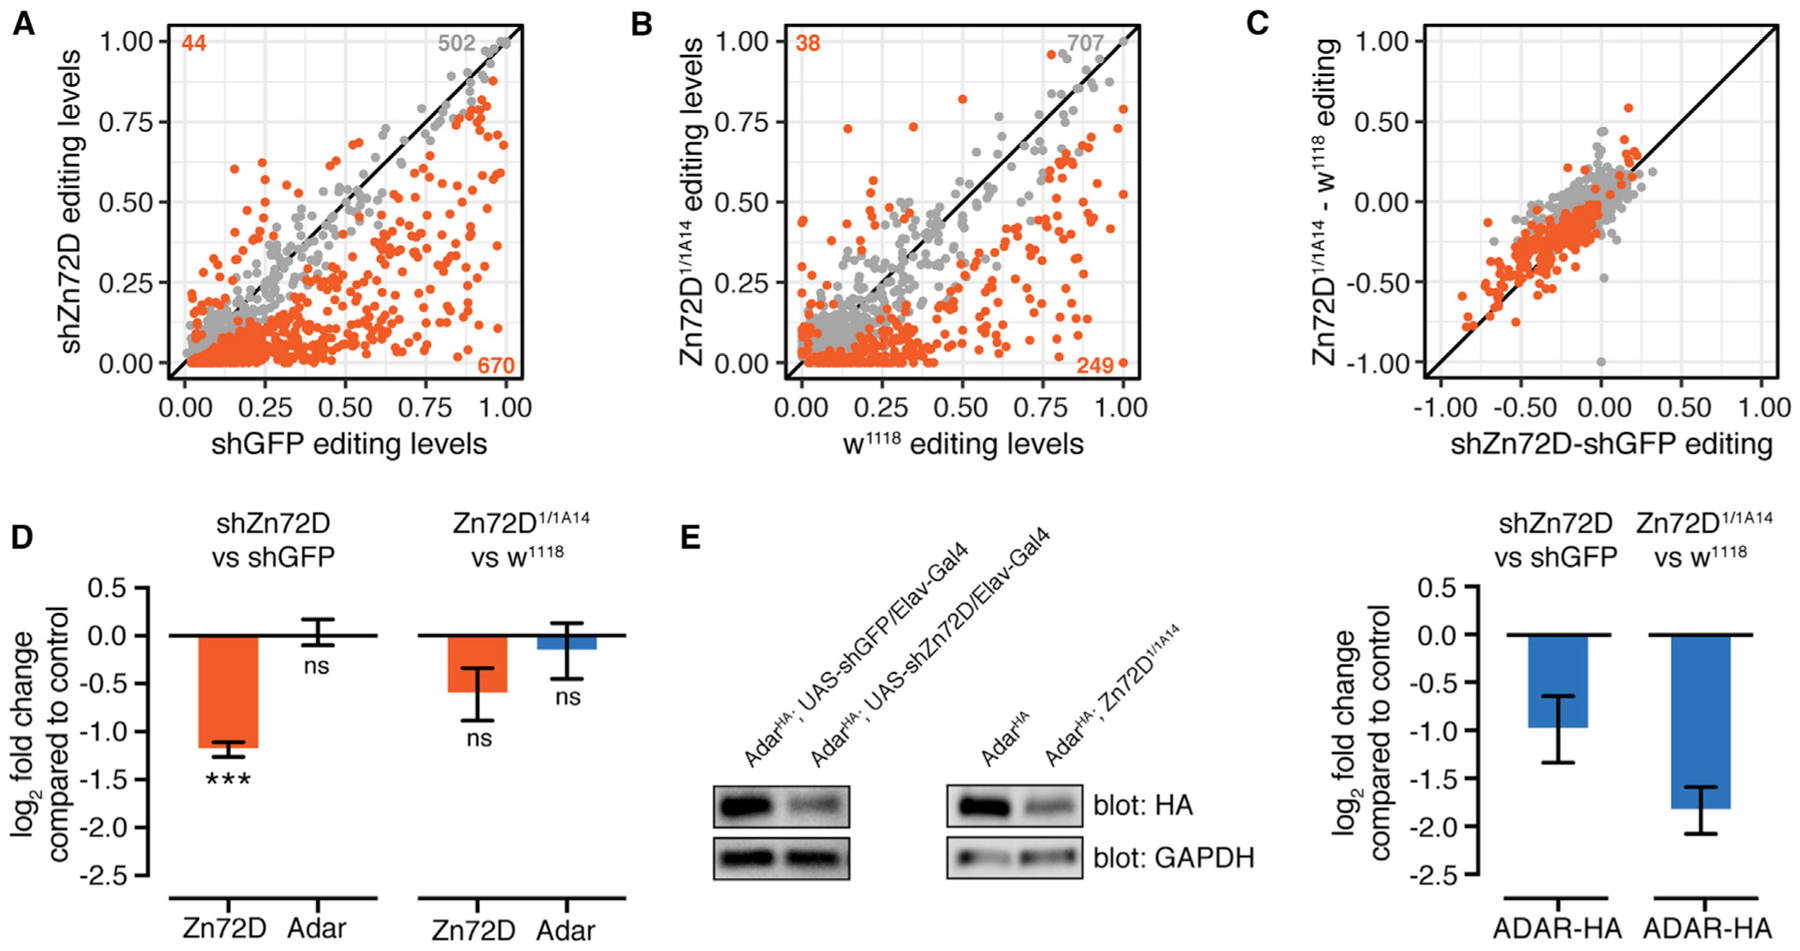
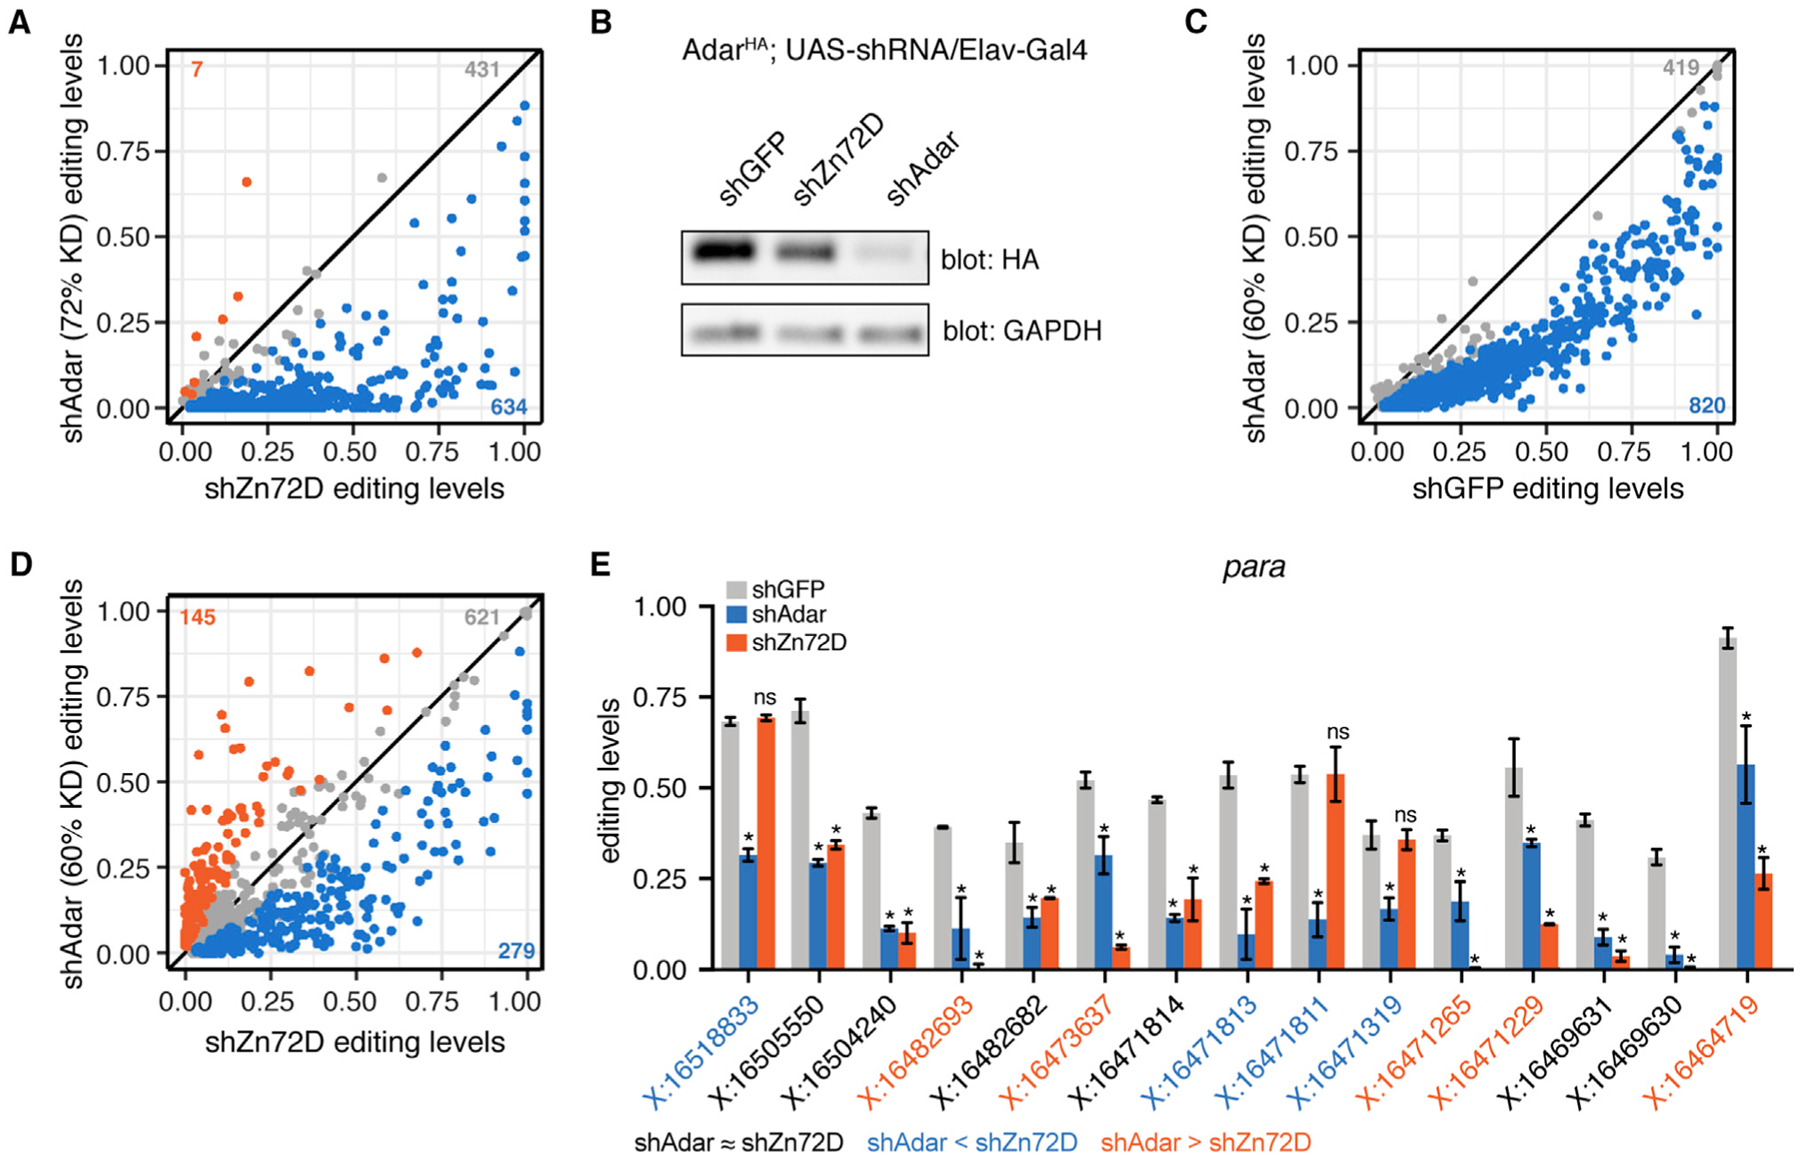
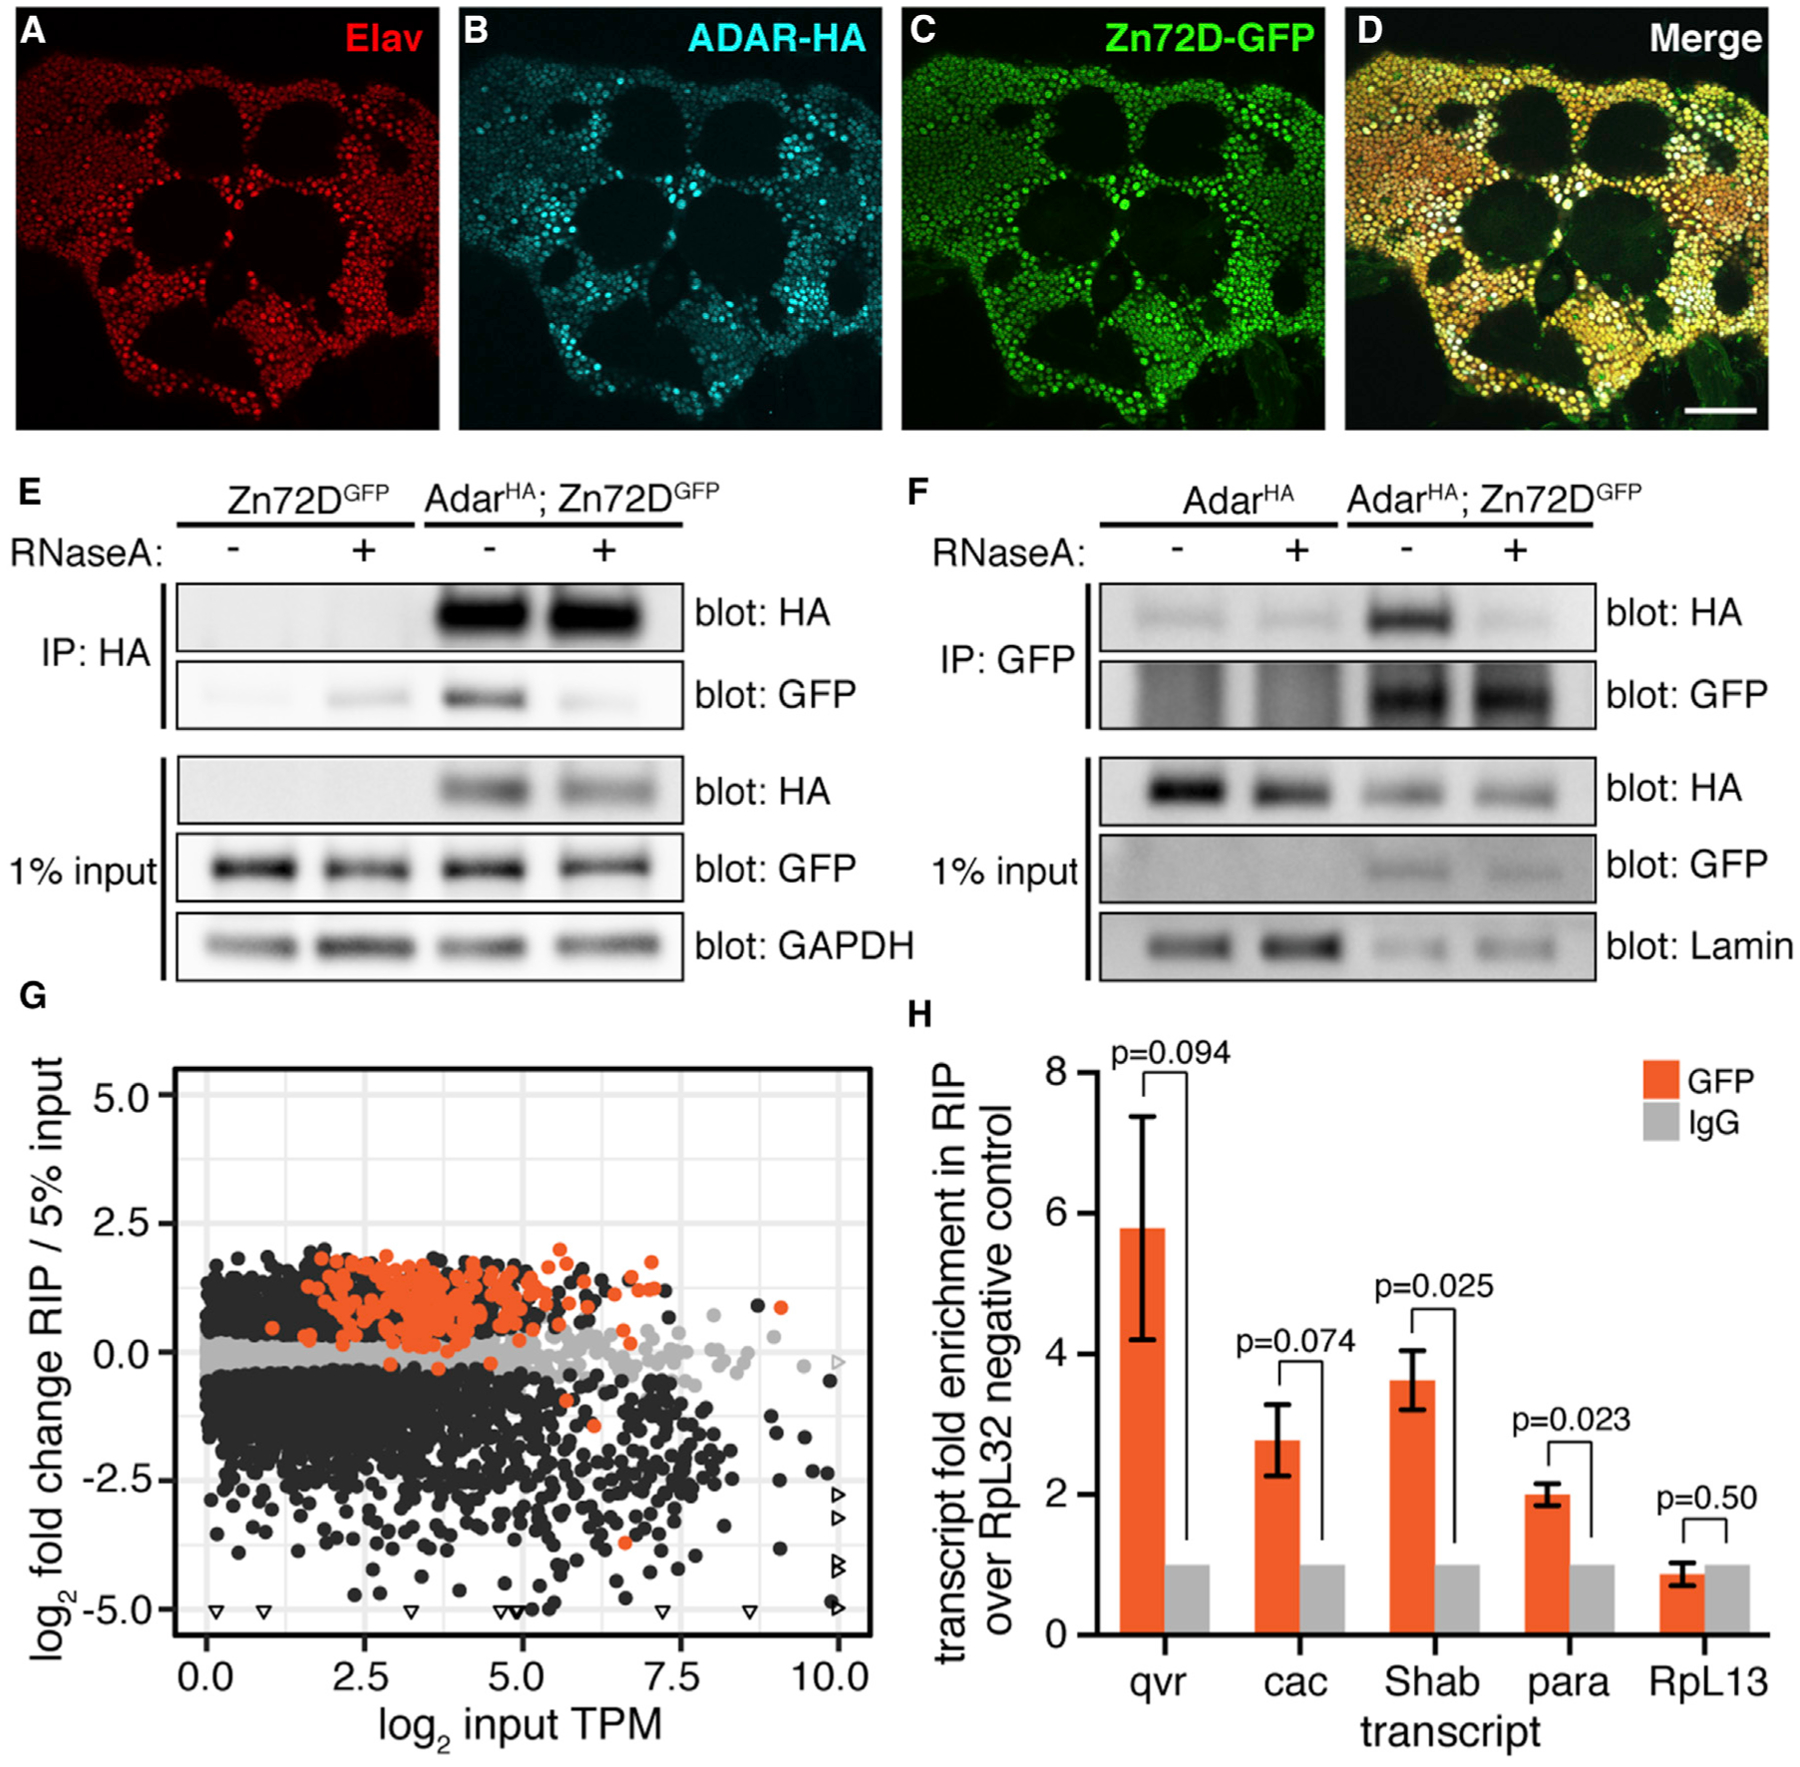
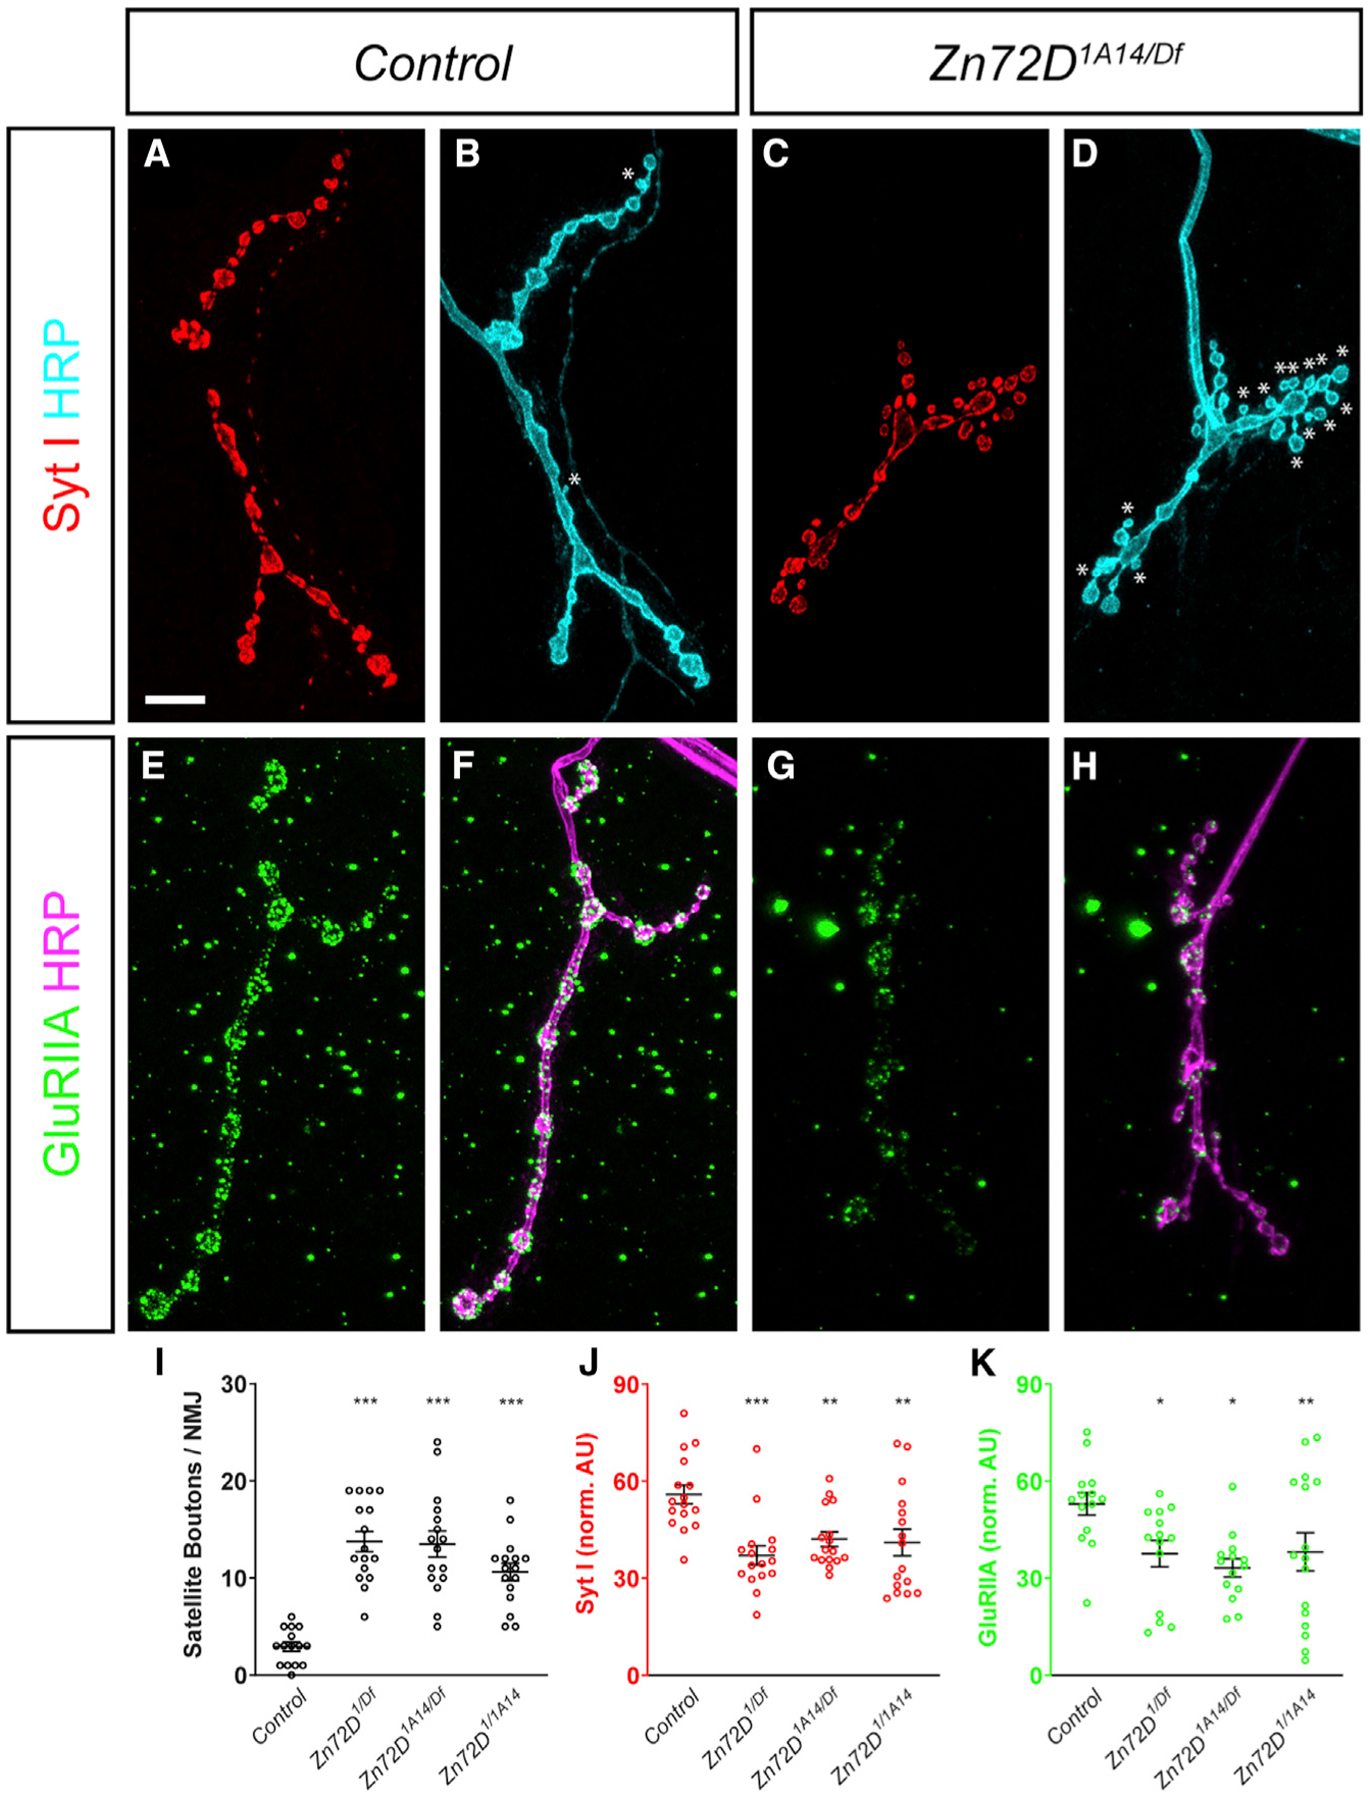
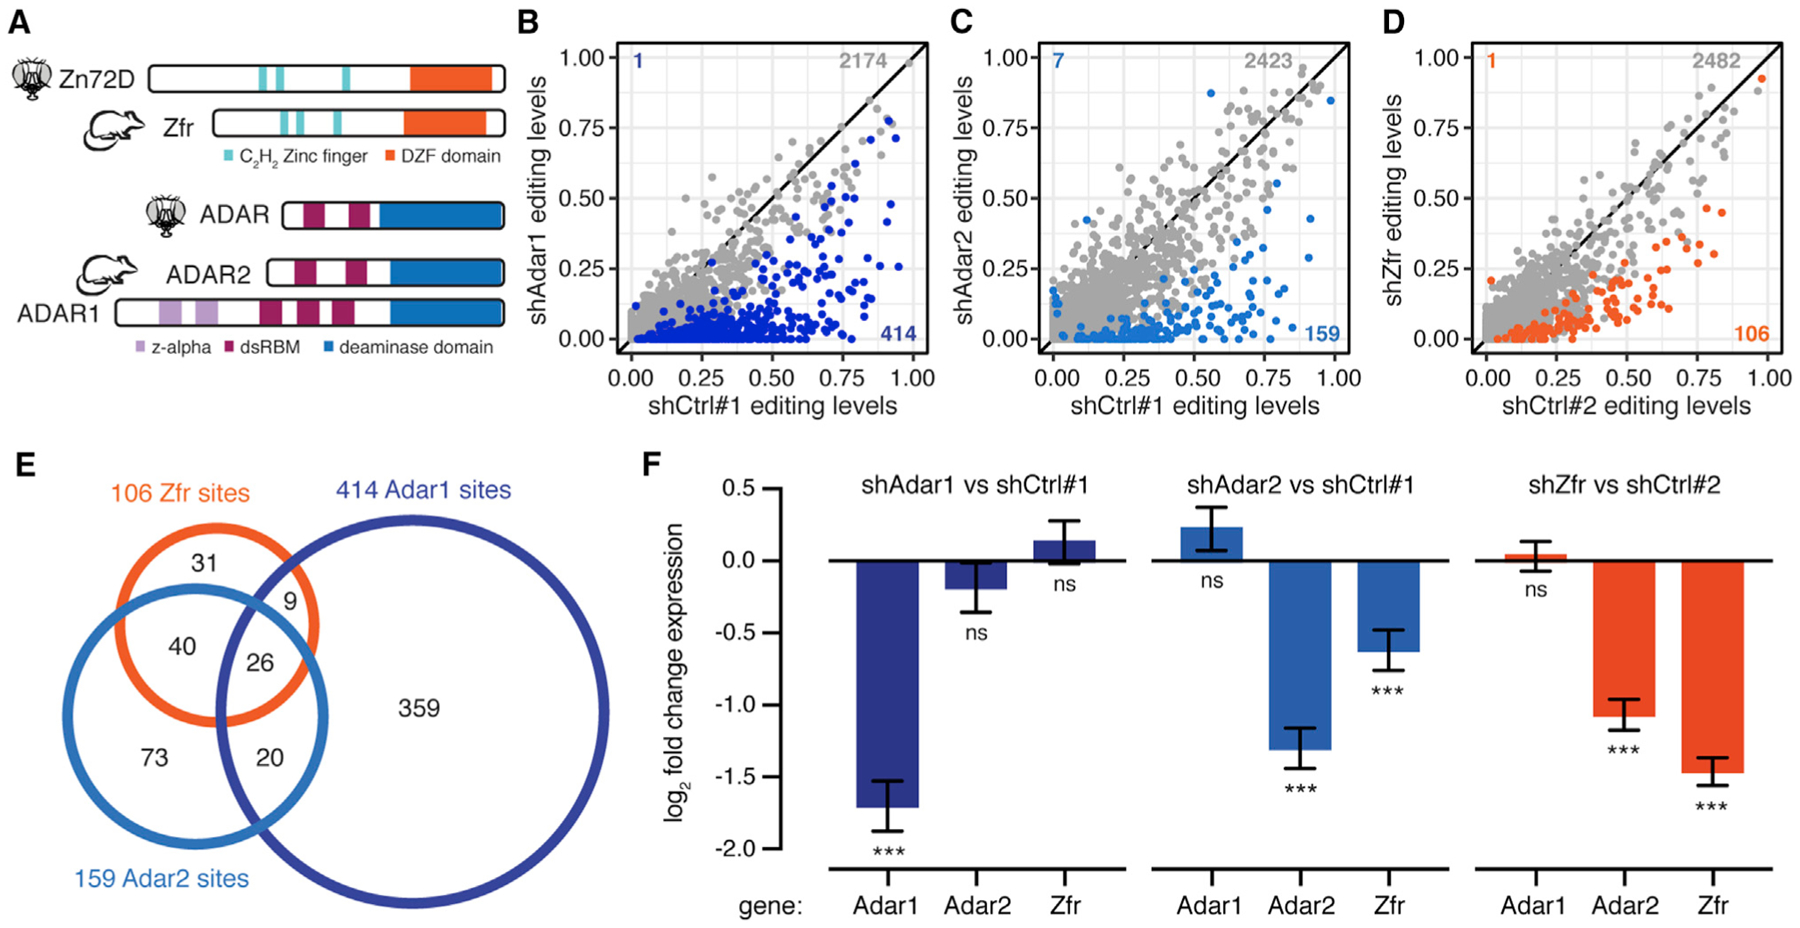
Adenosine-to-inosine RNA editing, catalyzed by adenosine deaminase acting on RNA (ADAR) enzymes, alters RNA sequences from those encoded by DNA. These editing events are dynamically regulated, but few trans regulators of ADARs are known in vivo. Here, we screen RNA-binding proteins for roles in editing regulation with knockdown experiments in the Drosophila brain. We identify zinc-finger protein at 72D (Zn72D) as a regulator of editing levels at a majority of editing sites in the brain. Zn72D both regulates ADAR protein levels and interacts with ADAR in an RNA-dependent fashion, and similar to ADAR, Zn72D is necessary to maintain proper neuromuscular junction architecture and fly mobility. Furthermore, Zn72D's regulatory role in RNA editing is conserved because the mammalian homolog of Zn72D, Zfr, regulates editing in mouse primary neurons. The broad and conserved regulation of ADAR editing by Zn72D in neurons sustains critically important editing events.

Keywords: A-to-I RNA editing; Adar; Zn72D; neuromuscular junction.


Conflict of interest statement

Declaration of Interests The authors declare no competing interests.

Figures

Figure 1.
Figure 1.. An RNAi Screen Identifies Zn72D as a Regulator of RNA Editing
(A) Schematic of RNAi screen. Pan-neuronal driver C155-Gal4 was crossed to UAS-shRNA flies targeting 1 of 20 different RNA-binding proteins. RNA from brains was sequenced to compare editing levels between C155-Gal4; UAS-shGFP controls and C155-Gal4; UAS-shRBP flies. (B) Comparison of editing levels across two biological replicates of shGFP controls. Biological replicates were highly reproducible. (C) Comparison of editing levels between C155-Gal4; UAS-shGFP and C155-Gal4; UAS-shAdar (VDRC7763) at sites used in the screen. All sites are reduced by Adar knockdown. Blue dots, p < 0.05, Fisher’s exact tests. (D) The number of editing sites found to be increased or decreased (p < 0.05, Fisher’s exact tests) upon knockdown of each of 20 RBPs screened. Heatmap shows the log2-fold change of each target RBP between knockdown and control as measured by RNA-seq. shZn72D shows the greatest number of altered editing sites besides shAdar.
Figure 2.
Figure 2.. Zn72D Knockdown Alters RNA Editing and ADAR Protein Levels
(A) Comparison of editing levels at individual editing sites (dots) between C155-Gal4; UAS-shGFP and C155-Gal4; UAS-shZn72D, from the RNAi screen in Figure 1. Orange dots, p < 0.05, Fisher’s exact tests. (B) Comparison of editing levels between two replicates of w1118 and Zn72D1/1A14 pupal heads. Orange dots, p < 0.05, Fisher’s exact tests. Many sites are altered in both Zn72D knockdowns and mutants compared with controls. (C) Comparison of the difference in editing between C155-Gal4; UAS-shZn72D and C155-Gal4; UAS-shGFP and Zn72D1/1A14 and w1118 from (A) and (B). The same sites are significantly altered in both knockdowns and mutants. Orange dots, p < 0.05 in both. (D) Log2-fold change of Zn72D and Adar mRNA levels in C155-Gal4; UAS-shZn72D compared with C155-Gal4; UAS-shGFP adult brains and Zn72D1/1A14 compared with w1118 pupal heads. Adar mRNA levels are not decreased in Zn72D knockdown and mutants. ***p < 0.0001, ns, p > 0.05, Wald tests. n = 2, error bars indicate SE. (E) Western blot of ADAR-HA protein in Elav-Gal4 / shGFP and Elav-Gal4 / shZn72D adult brains and w1118 and Zn72D1/1A14 pupal heads. n = 3, a representative result is shown. At right, quantification of HA loss in Zn72D knockdown and mutant compared with controls, normalized to glyceraldehyde-3-phosphate dehydrogenase (GAPDH). ADAR-HA protein levels are decreased in both Zn72D knockdown and mutants. Data are represented as means ± SE.
Figure 3.
Figure 3.. Zn72D and Adar Knockdowns Have Divergent Editing Phenotypes
(A) Comparison of RNA editing levels between C155-Gal4; UAS-shZn72D (screen) and C155-Gal4; UAS-shAdar (VDRC7763; editing levels compared with shGFP in Figure 1C). Blue sites, p < 0.05, Fisher’s exact tests, Adar knockdown decreases editing more than Zn72D knockdown does. Gray sites, p > 0.05, shAdar equals shZn72D editing. Orange sites, p < 0.05, Fisher’s exact tests, Zn72D knockdown decreases editing more than Adar knockdown does. The number of sites falling into each category is shown. (B) Western blot comparing the level of ADAR-HA protein in AdarHA;UAS-shGFP / Elav-Gal4, AdarHA ; UAS-shZn72D / Elav-Gal4, and AdarHA ; UAS-shAdar (VDRC7763) / Elav-Gal4. n = 3, a representative result is shown. This Adar knockdown leads to a greater reduction in ADAR-HA protein than Zn72D knockdown does, consistent with the editing level comparison in (A). (C) Comparison of RNA editing levels between C155-Gal4; UAS-shGFP and C155-Gal4; UAS-shAdar (BDSC28311). Blue sites, p < 0.05, Fisher’s exact tests. (D) Comparison of RNA editing levels between C155-Gal4; UAS-shZn72D (screen) and C155-Gal4; UAS-shAdar (BDSC28311). Blue sites, p < 0.05, Fisher’s exact tests, Adar knockdown decreases editing more than Zn72D knockdown does. Gray sites, p > 0.05, shAdar equals shZn72D editing. Orange sites, p < 0.05, Fisher’s exact tests, Zn72D knockdown decreases editing more than Adar knockdown does. The number of sites falling into each category is shown. (E) Editing levels in C155-Gal4; UAS-shGFP, C155-Gal4; UAS-shAdar, and C155-Gal4; UAS-shZn72D brains in para. Sites within the transcript are differentially affected by Zn72D loss. n = 2, data are represented as means ± SD. *p < 0.001, ns, p > 0.05, Fisher’s exact tests between shGFP and either shAdar (above blue bar) or shZn72D (above orange bar). Orange coordinates, shZn72D decreases editing more than shAdar does. Black coordinates, no difference between shAdar and shZn72D. Blue coordinates, shAdar decreases editing more than shZn72D does. Blue and orange, p < 0.001, Fisher’s exact tests.
Figure 4.
Figure 4.. Zn72D Interacts with ADAR in an RNA-Dependent Manner
(A–D) Immunofluorescent staining of Elav (A), ADAR-HA (B), Zn72D-GFP (C), and all three merged (D) in the adult fly brain. All proteins are expressed in neuronal nuclei. Images are a single slice, scale bar: 50 μm. (E) Western blots of HA and GFP after immunoprecipitation of ADAR-HA from Zn72DGFP (control) and AdarHA; Zn72DGFP heads. Half of each IP was treated with RNase A. Blots of HA, GFP, and GAPDH from 1% of input material are shown. n = 3, a representative result is shown. (F) Western blots of HA and GFP after immunoprecipitation of Zn72D-GFP from AdarHA; Zn72DGFP head nuclei. Half of each IP was treated with RNase A. Blots of HA, GFP, and Lamin from 1% of input material are shown. n = 3, a representative result is shown. ADAR-HA and Zn72D-GFP interact in the presence of RNA. (G) Scatterplot of transcript enrichment in Zn72D-GFP RIP-seq. Log2-fold change expression in RIP samples compared with 5% input is plotted versus the log2 of the average transcripts per kilobase million (TPM) of each transcript (dot) in the input samples. Orange dots, transcripts have editing sites affected by Zn72D. Black dots, p < 0.05, Wald tests. Triangles represent points falling outside of graph boundaries. n = 3; 185 of 216 transcripts measured with editing sites altered by Zn72D knockdown are enriched in the RIP. (H) Enrichment of qvr, cac, Shab, para, and negative control RpL13 recovered in the Zn72D-GFP RIP, normalized to IgG control RIP and to enrichment of negative control RpL32, as measured by qPCR. n = 3, error bars represent SE; p values, paired two-tailed t tests. Transcripts enriched in the RIP as measured by RNA-seq(G) are also enriched when measured by qPCR.
Figure 5.
Figure 5.. Loss of Zn72D Regulates NMJ Architecture and Protein Levels
(A–D) Third instar larvae stained with antibodies against Syt I (red) and HRP (cyan) in Control (A and B) and Zn72D1A14/Df mutant larvae (C and D). Df is Df(3L)Exel6127, which lacks the Zn72D locus. Asterisks indicate satellite boutons. Loss of Zn72D markedly increases the incidence of satellite boutons and reduces the apparent fluorescent intensity of Syt I staining. (E–H) Third instar larvae stained with antibodies against GluRIIA (green) and HRP (magenta) in Control (E and F) and Zn72D1A14/Df mutant larvae (G and H). Loss of Zn72D reduces synaptic GluRIIA staining. Scale bar, 10 mm. (I–K) Quantification of satellite boutons per NMJ (I), Syt I fluorescence levels (J) and GluRIIA fluorescence levels (K). Multiple allelic combinations of Zn72D mutants show increased satellite bouton numbers and reduced Syt I and GluRIIA staining. Both GluRIIA and Syt I fluorescence levels are normalized to HRP staining at the same NMJs, which is unchanged across all genotypes, suggesting that these deficits are specific. For all graphs, open circles represent each individual value while the mean ± SEM is indicated by the error bars. In all cases, n R 7 animals, 14 NMJs for each genotype. *p < 0.05, **p < 0.01, ***p < 0.001, ANOVA followed by a Dunnett’s multiple comparisons test.
Figure 6.
Figure 6.. Zfr Affects Editing Levels and Adar2 mRNA Levels in Mouse Primary Neurons
(A) Schematic of protein domains of Zn72D and its mouse homolog, Zfr (top). Schematic of protein domains of Drosophila ADAR and its mouse homolog ADAR2 along with the other catalytically active mouse ADAR, ADAR1 (bottom). (B) Comparison of editing levels between mouse primary neurons transfected with a control shRNA versus shAdar1. Blue dots, p < 0.05, Fisher’s exact tests. n = 2. (C) Comparison of editing levels between mouse primary neurons transfected with a control shRNA versus shAdar2. Blue dots, p < 0.05, Fisher’s exact tests. n = 2. (D) Comparison of editing levels between mouse primary neurons transfected with control shRNA versus shZfr. Orange dots, p < 0.05, Fisher’s exact tests. n = 2. The number of changed sites is indicated. Many editing sites show decreased editing upon Adar1, Adar2, and Zfr knockdown. (E) Venn diagram showing the overlap of affected sites between shAdar1, shAdar2, and shZfr. shZfr sites share a larger overlap with ADAR2-affected sites, although the three sets are distinct. (F) Log2-fold changes of mRNA levels of Adar1, Adar2, and Zfr in shAdar1, shAdar2, and shZfr neurons compared with shControl neurons. n = 2, error bars represent SE. ***p < 0.001, ns, p > 0.05, Wald tests. Adar1 knockdown does not affect Adar2 or Zfr levels, whereas Adar2 knockdown decreases Zfr levels, and Zfr knockdown decreases Adar2 levels.

Similar articles

Cited by

References

    1. Adiconis X, Borges-Rivera D, Satija R, DeLuca DS, Busby MA, Berlin AM, Sivachenko A, Thompson DA, Wysoker A, Fennell T, et al. (2013). Comparative analysis of RNA sequencing methods for degraded or low-input samples. Nat. Methods 10, 623–629. - PMC - PubMed
    1. Bass BL (2002). RNA editing by adenosine deaminases that act on RNA. Annu. Rev. Biochem 71, 817–846. - PMC - PubMed
    1. Behm M, Wahlstedt H, Widmark A, Eriksson M, and Öhman M (2017). Accumulation of nuclear ADAR2 regulates adenosine-to-inosine RNA editing during neuronal development. J. Cell Sci 130, 745–753. - PubMed
    1. Benjamini Y, and Hochberg Y (1995). Controlling the False Discovery Rate: A Practical and Powerful Approach to Multiple Testing. J. R. Stat. Soc. B 57, 289–300.
    1. Bhogal B, Jepson JE, Savva YA, Pepper AS-R, Reenan RA, and Jongens TA (2011). Modulation of dADAR-dependent RNA editing by the Drosophila fragile X mental retardation protein. Nat. Neurosci 14, 1517–1524. - PMC - PubMed

Publication types

MeSH terms