. 2020 Jul 7;28(7):830-846.e9.
doi: 10.1016/j.str.2020.04.020. Epub 2020 May 19.

Integrated Structural Modeling of Full-Length LRH-1 Reveals Inter-domain Interactions Contribute to Receptor Structure and Function

Affiliations

Integrated Structural Modeling of Full-Length LRH-1 Reveals Inter-domain Interactions Contribute to Receptor Structure and Function

Corey D Seacrist et al. Structure. .

Abstract

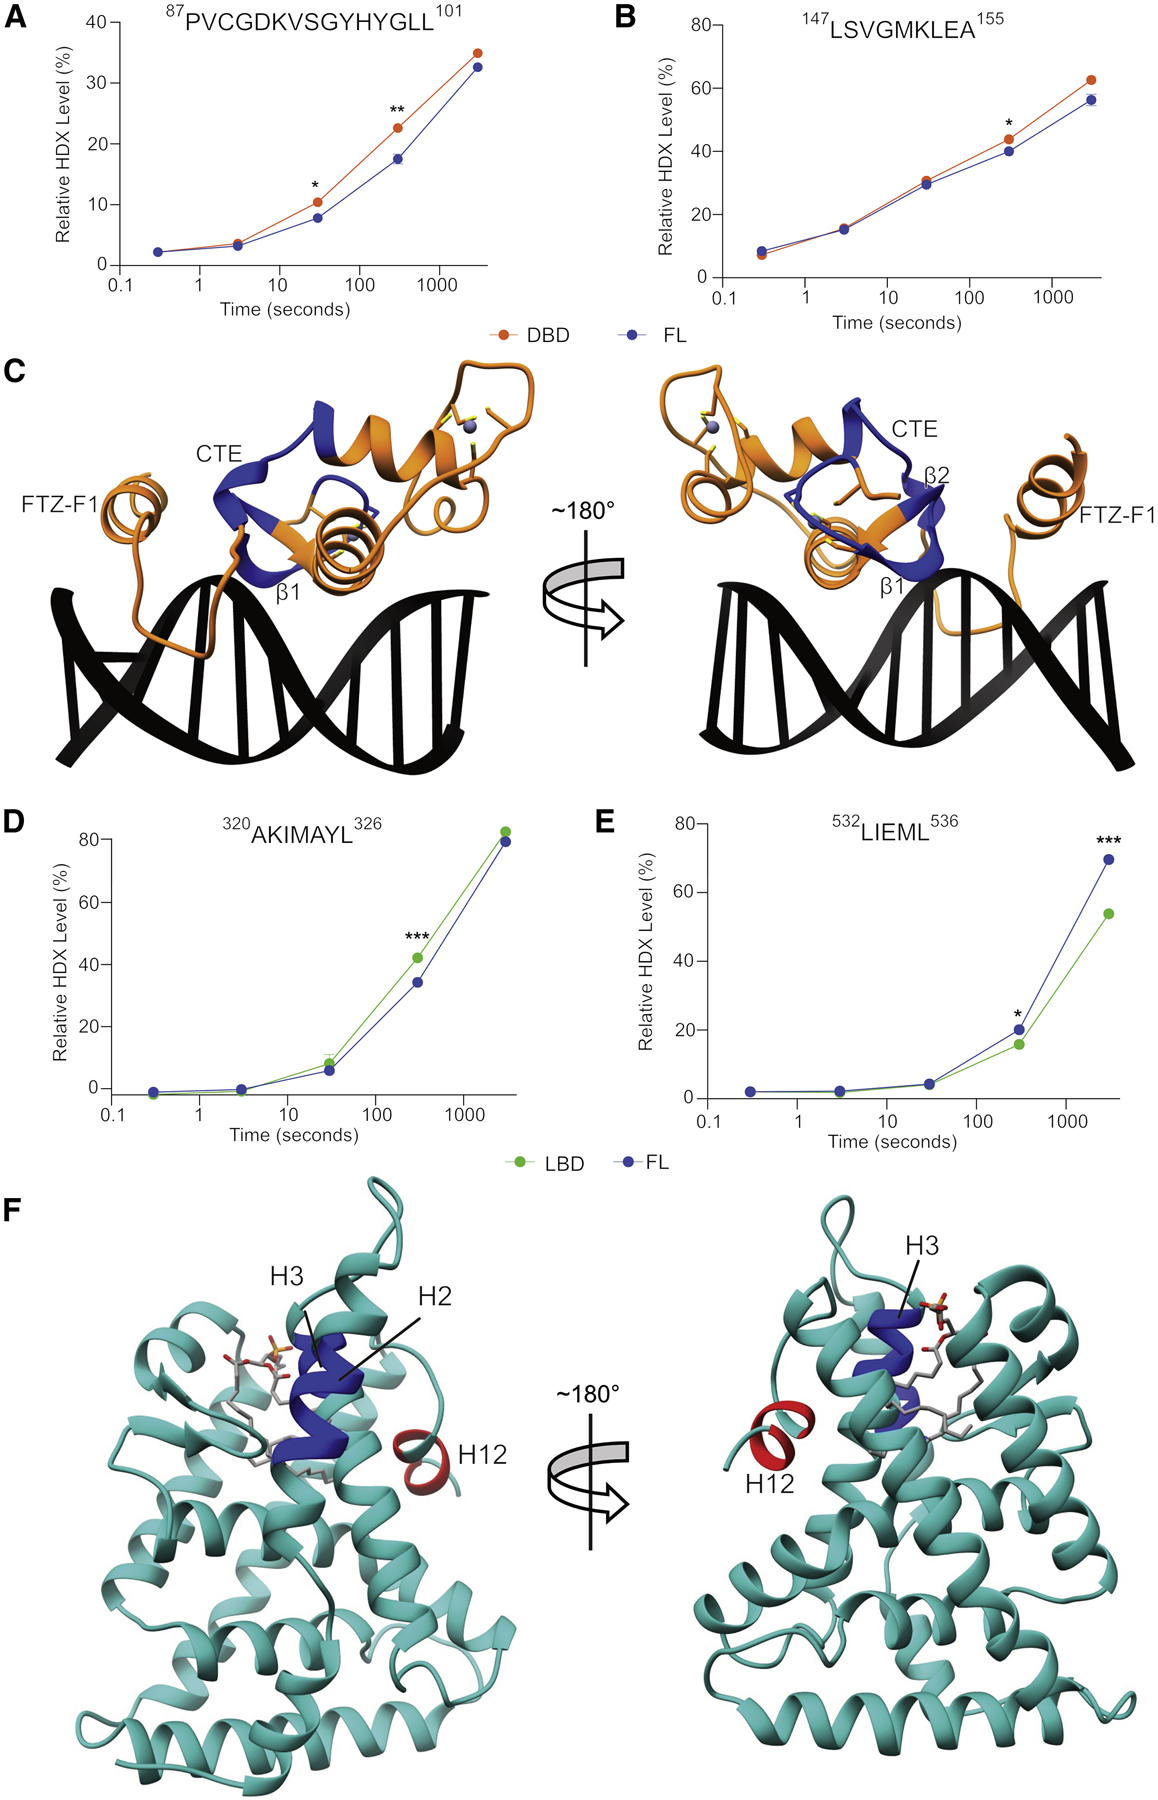
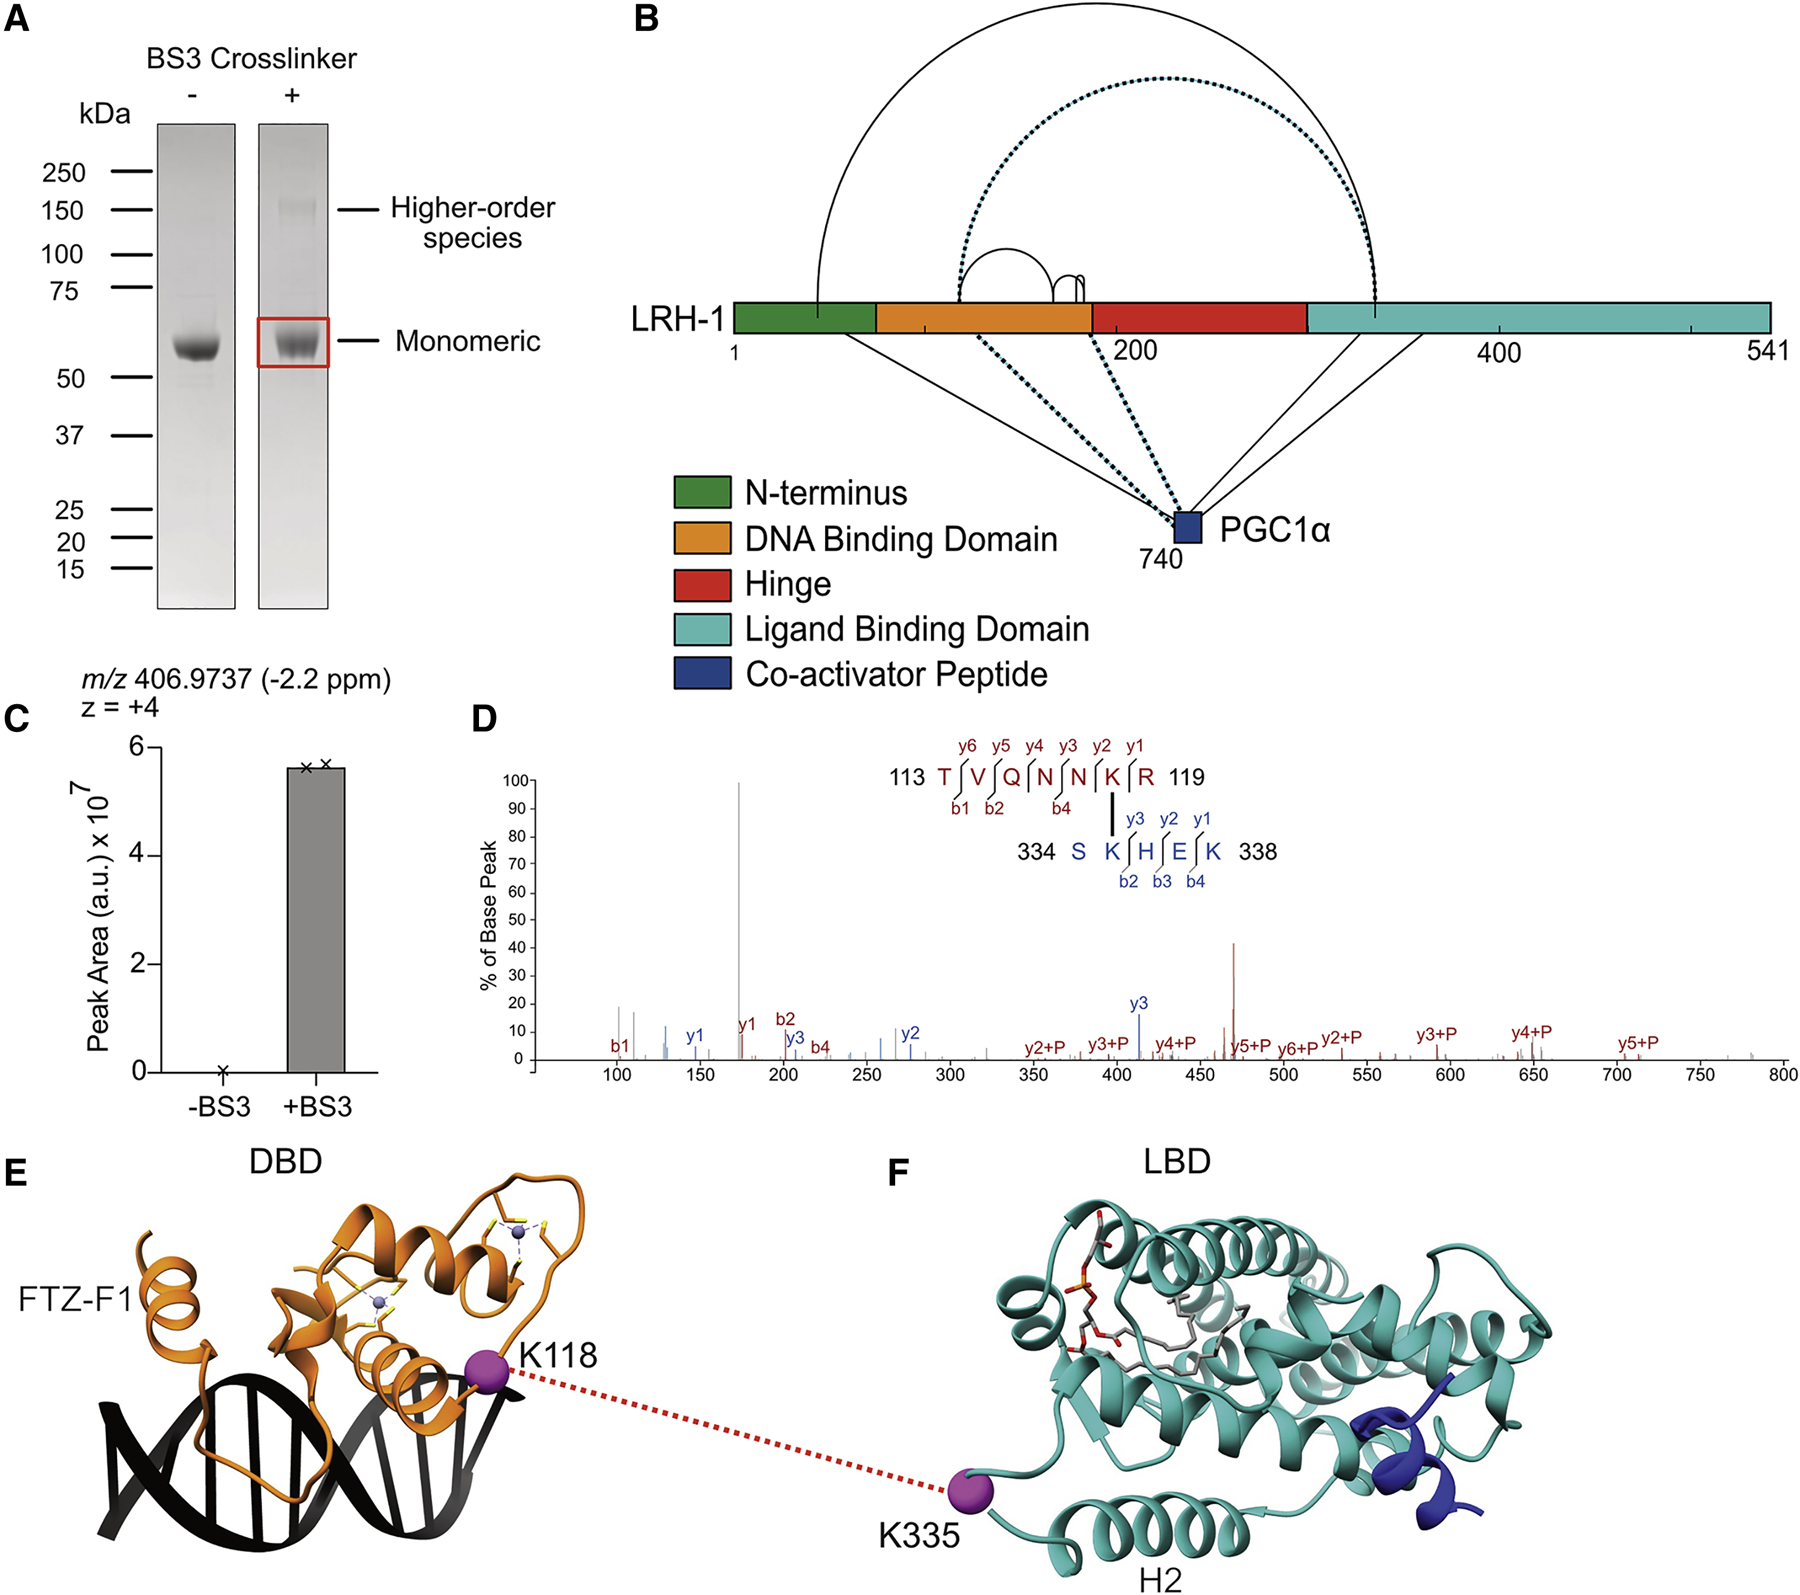
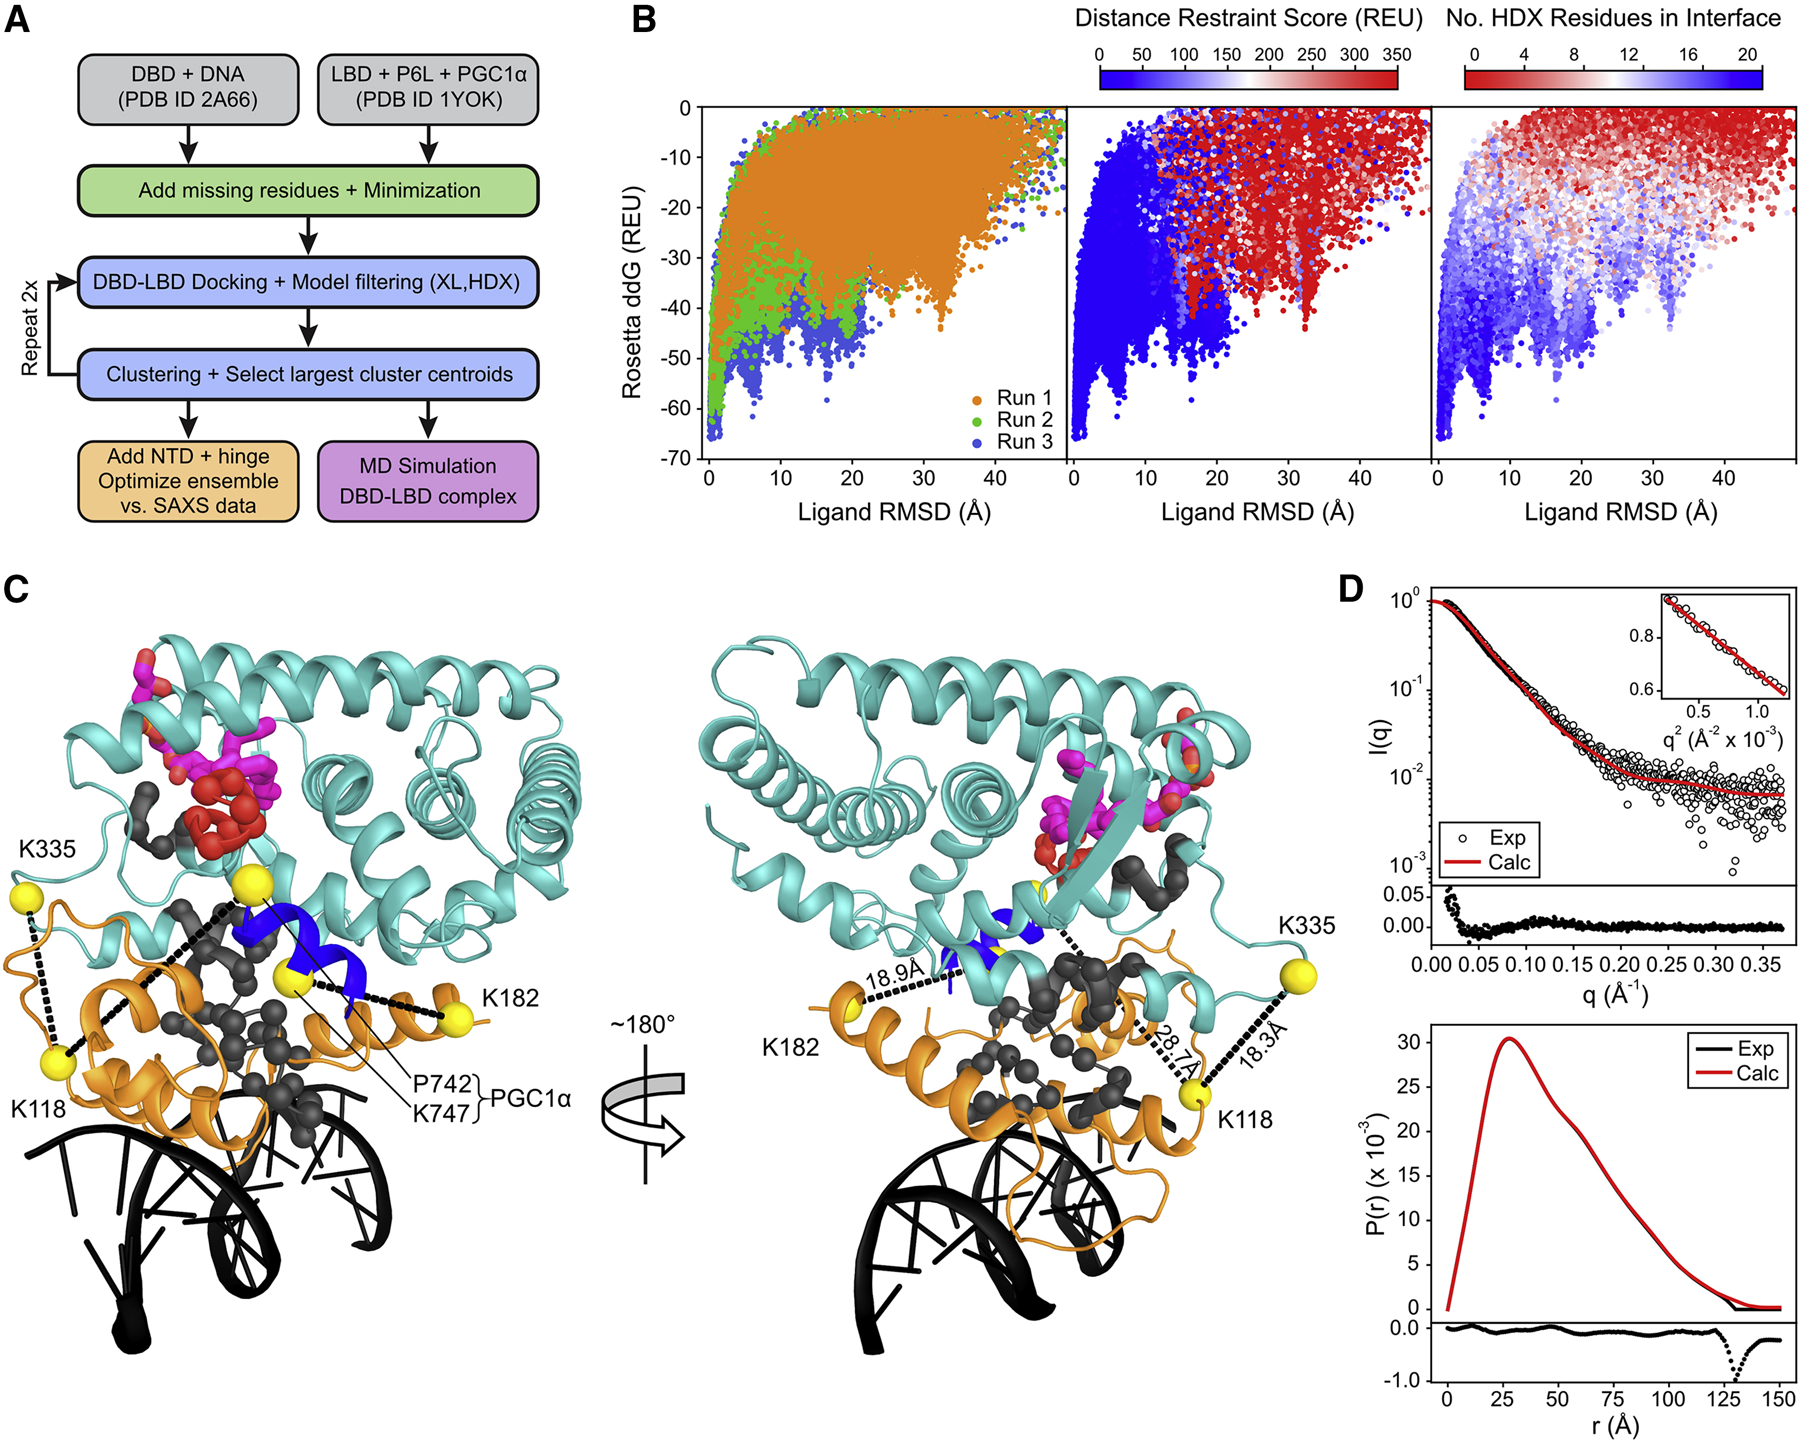
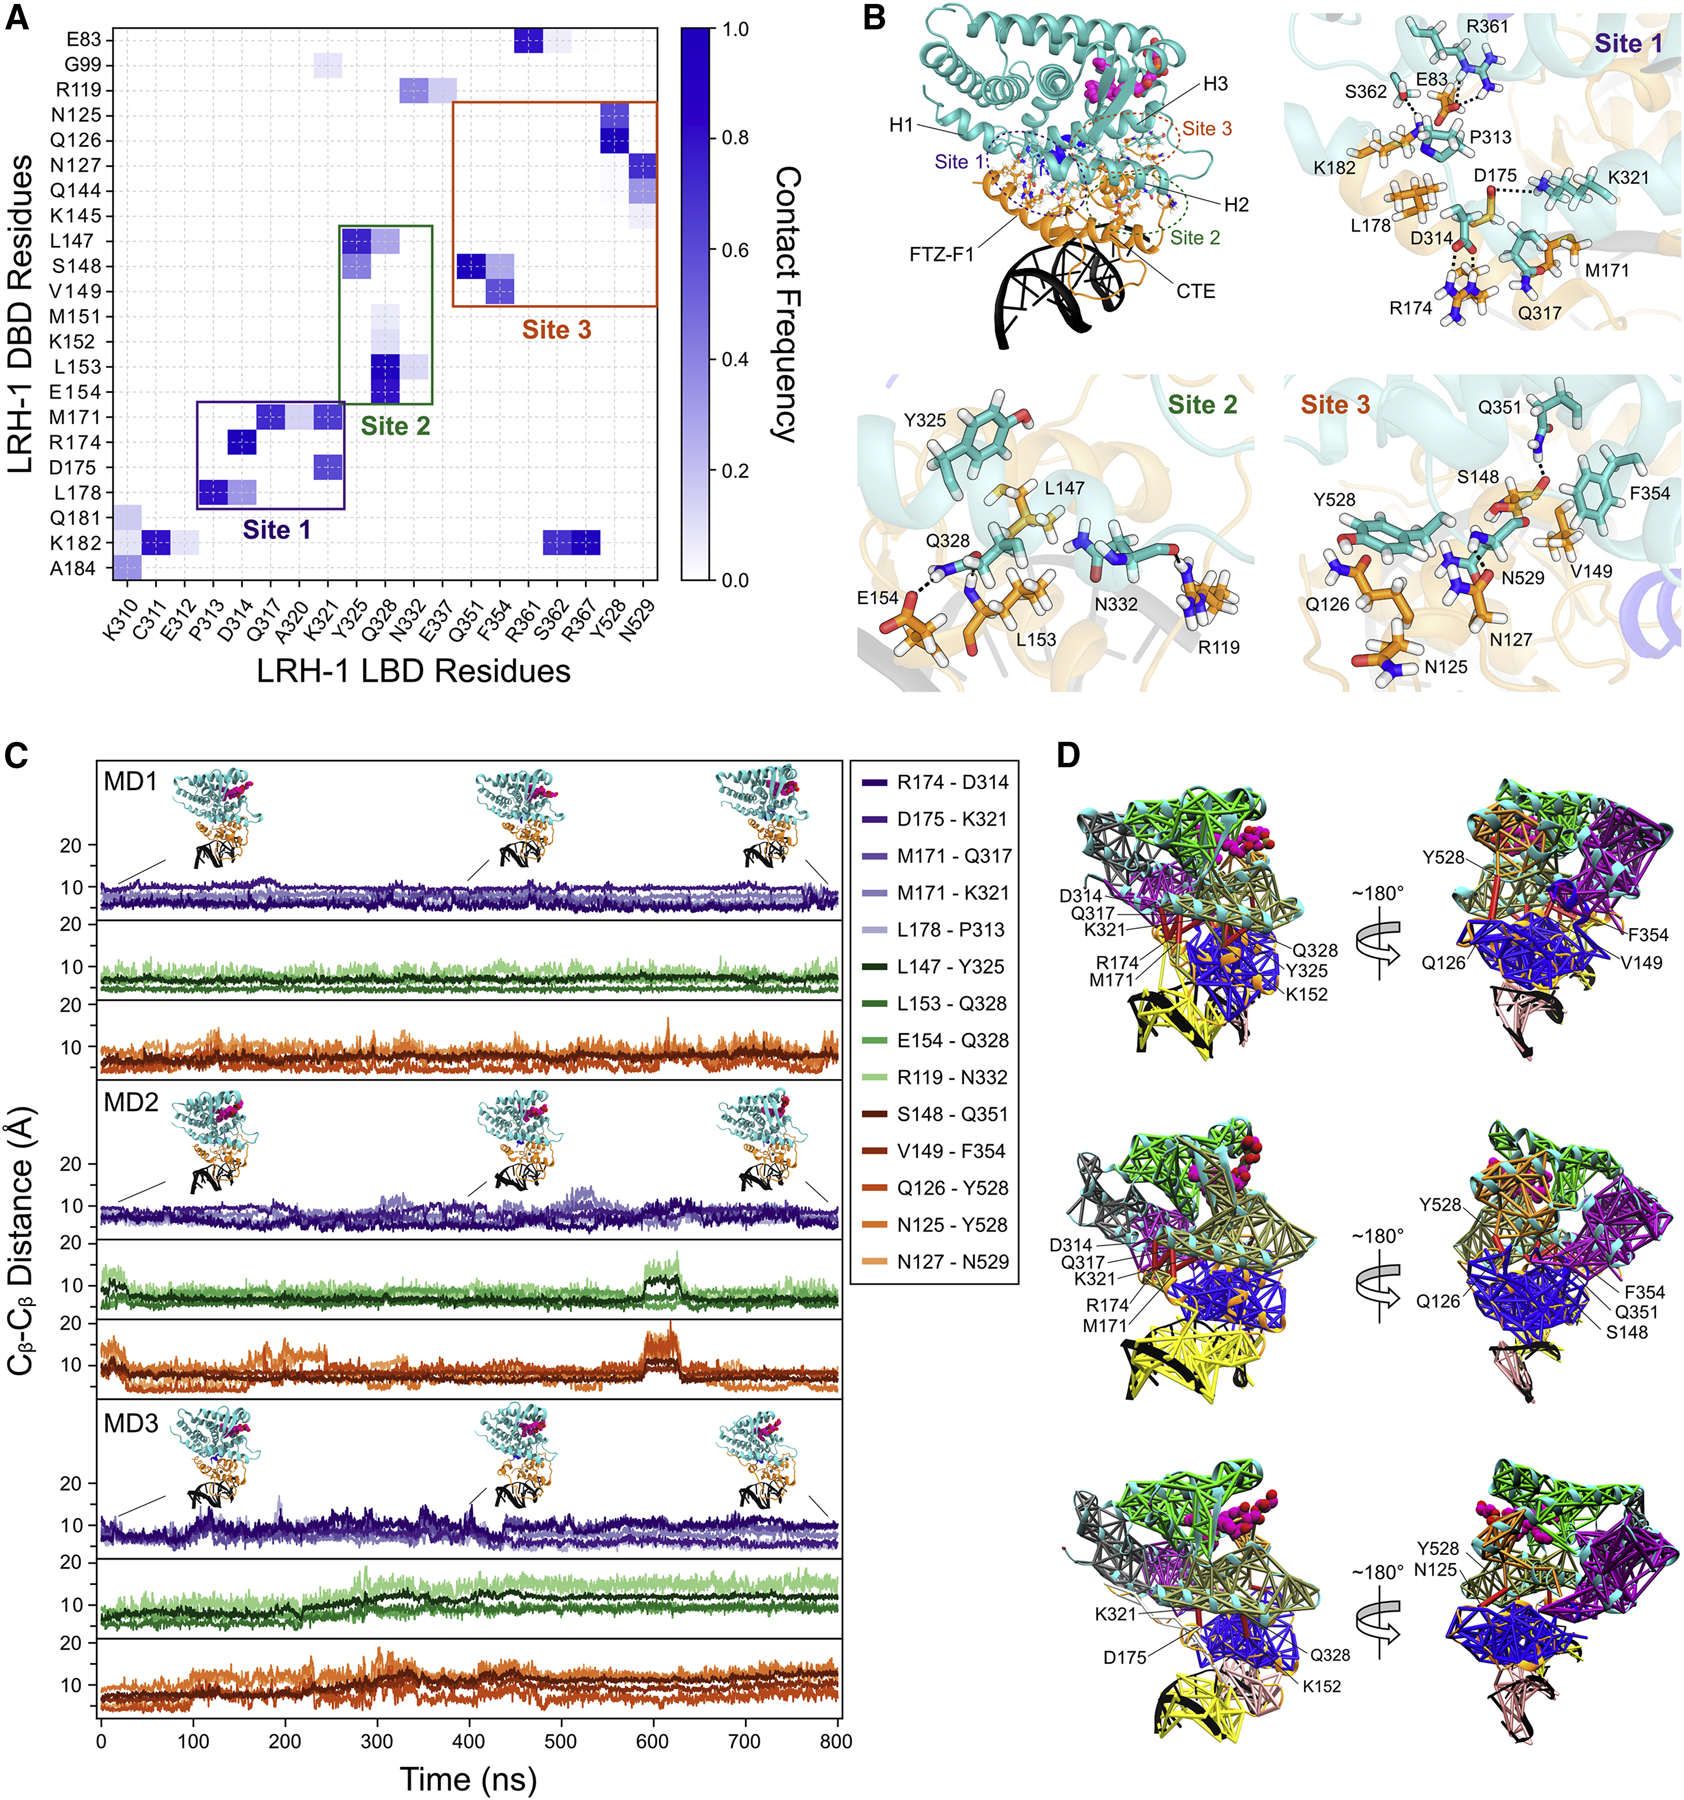
Liver receptor homolog-1 (LRH-1; NR5A2) is a nuclear receptor that regulates a diverse array of biological processes. In contrast to dimeric nuclear receptors, LRH-1 is an obligate monomer and contains a subtype-specific helix at the C terminus of the DNA-binding domain (DBD), termed FTZ-F1. Although detailed structural information is available for individual domains of LRH-1, it is unknown how these domains exist in the intact nuclear receptor. Here, we developed an integrated structural model of human full-length LRH-1 using a combination of HDX-MS, XL-MS, Rosetta computational docking, and SAXS. The model predicts the DBD FTZ-F1 helix directly interacts with ligand binding domain helix 2. We confirmed several other predicted inter-domain interactions via structural and functional analyses. Comparison between the LRH-1/Dax-1 co-crystal structure and the integrated model predicted and confirmed Dax-1 co-repressor to modulate LRH-1 inter-domain dynamics. Together, these data support individual LRH-1 domains interacting to influence receptor structure and function.

Keywords: BS3; Dax1 Dax-1 Nr0b1; benzophenone artificial amino acid; disulfide crosslink mass spectrometry; hydrogen-deuterium exchange mass spectrometry; integrated structural modeling; nuclear lipids; nuclear phospholipid signaling; nuclear receptor lipidomics; small-angle X-ray scattering; β-catenin CTNNB1.


Conflict of interest statement

Declaration of Interests The authors declare no competing interests.

Figures

Figure 1:
Figure 1:. HDX-MS reveals regions with differential solvent accessibility dependent on intact receptor.
HDX profiles for peptides shown to have differential solvent exchange between LRH-1FL and the DBD (A, B) or the LBD (D,E). Regions with altered solvent accessibility mapped onto crystal structures of the DBD (C) (PDB: 2A66) and LBD (F) (PDB: 1YOK with modeled H2/3 linker). Decreases in HDX are depicted as blue and increases are depicted as red. Data represent mean ± SD from three independent experiments. *P<0.01, **P<0.001, ***P<0.0001.
Figure 2:
Figure 2:. XL-MS of LRH-1 reveals inter-domain and inter-protein crosslinks.
(A) SDS-PAGE of LRH-1FL +/− BS3 treatment. (B) Map of validated BS3 crosslinked residues shown schematically on the LRH-1 primary sequence. Dotted lines represent crosslinks used in computational docking of the DBD and LBD. (C) Integrated MS-1 parent ion peaks observed in extracted ion chromatogram. (D) MS-2 fragmentation spectrum with assigned product ions of K118-K335 inter-domain crosslink. LRH-1 DBD (E) (PDB: 2A66) shown adjacent to LRH-1 LBD (F) (PDB: 1YOK with modeled H2/3 linker) with bona fide inter-domain crosslink site shown as purple sphere connected with red dotted line.
Figure 3:
Figure 3:. Integrated structural modeling of the LRH-1 DBD-LBD complex.
(A) Overview of the modeling workflow. (B) Rosetta ddG score-vs.-ligand RMSD plots. The Rosetta energy, crosslink restraint score, and number of HDX residues in DBD-LBD interface regions gradually improved over three rounds of docking. (C) Cartoon representation of the lowest-scoring DBD-LBD docking model. DNA, DBD, LBD, and PGC1α peptide are colored black, orange, cyan, and blue, respectively, and the phospholipid ligand is depicted as magenta sticks. Crosslink sites are shown as yellow spheres and restrained crosslink distances are indicated with dashed lines. HDX peptide regions in the DBD and in helix 2 of the LBD are colored gray, whereas the location of the HDX peptide in LBD helix 12 is colored red. (D) Comparison of experimental and model-predicted SAXS data. Upper graph: Experimental and theoretical scattering intensity, log10I(q), versus scattering vector q (χ2 = 2.6). The residuals of the fit are shown below the scattering curve. The inset shows the Guinier plot with a linear fit, yielding a radius of gyration Rg = 38.19 ± 0.46 Å. Lower graph: Experimental and theoretical pair distribution function with residuals of the fit shown below the graph. Theoretical SAXS data were calculated as average over the selected ensemble often LRH-1FL models.
Figure 4:
Figure 4:. Predicted inter-domain contacts in the LRH-1 models.
(A) DBD-LBD contact map suggests interactions cluster at three sites in LRH-1. An energy cutoff of −1 REU between two residues was used to define a contact. (B) Three-dimensional representation of DBD-LBD interaction sites. Site 1 is formed between the DBD FTZ-F1 helix and the C-terminal end of LBD helix 2 and helix 1–2 loop. Site 2 involves contacts between the DBD CTE loop and the middle region of DBD helix 2. Site 3 includes residues in the DBD core and LBD helix 3 and helix 11–12 loop. The sidechains of residues corresponding to the 20 most frequent contacts identified in the map in (A) are depicted as sticks and labeled. DBD and LBD residues are colored orange and cyan, respectively, and non-carbon atoms are colored according to their chemical identity (O: red, N: blue, H: white). (C) Cβ atom distances of DBD-LBD residue pairs from (B) during three separate MD simulations (MD1–3) of the LRH-1 docking model. Residue distances from sites 1, 2, and 3 are colored with different shades of purple, green, and orange, respectively, and plotted side-by-side for visualization. Representative snapshots of LRH-1 at different time steps during the MD trajectory are shown above the distance plot. (D) Dynamical network analysis of LRH-1 MD simulations. Subnetworks are shown with different colors with corresponding edges plotted onto the last snapshot from the MD simulations in (C). Critical edges connecting networks in the DBD with networks in the LBD as well as edges connecting nodes within the same network across the DBD-LBD interface are colored red and labeled by their corresponding node residues.
Figure 5:
Figure 5:. R174/D314 inter-domain salt bridge influences LRH-1 structure and function.
Sequence logos of DBD FTZ-F1 helix (A) and LBD helix 2 (B) compared between eight selected species of both LRH-1 and SF-1 with residues selected for mutagenesis marked by an asterisk (*). (C) Activity of DBD FTZ-F1 helix and LBD helix 2 mutants in luciferase reporter gene activation assays. Data are the combined results of three independent experiments plotted as the mean ± 95% CI. *P<0.05, ***P<0.001, ****P<0.0001, ns – not significant. The expression levels were similar between WT* and mutants. See Figure S9. (D) Co-activator binding of LRH-1 R174-D314 salt bridge mutants measured by fluorescence polarization. Data points represent the average ± SEM of three independent experiments. The KD and Bmax parameters are plotted in (E) and (F) as mean ± 95% CI. Comparison was made by extra sum-of-squares F-test. **P<0.01. ****P<0.0001. SAXS analysis of WT LRH-1 and mutants. (G) Experimental and calculated SAXS data with inset showing Guinier plots with linear fits yielding Rg values listed in Table 2. (H) Pairwise distance distributions resulting from Fourier transform of the SAXS data with Rg and Dmax parameters listed in Table 2.
Figure 6:
Figure 6:. S148R mutant decreases LRH-1 function and alters global structure.
(A) Sequence logo of DBD helix containing S148, with S148 position marked by an asterisk (*). (B) Map of mutations in LRH-1 identified in greater than three individuals in the gnomAD database. (C) Mutational analysis of S148R in luciferase reporter gene activation assays. Data are the combined results of three independent experiments plotted as the mean ± SD. **P<0.01, ****P<0.0001.The expression levels were similar between WT* and S148R. See Figure S9. S148R in vitro characterization in fluorescence polarization. (D) PGC1α co-activator peptide binding and (E) DNA binding curves with associated parameters plotted as mean ± 95% confidence interval (F). Data represent the mean ± SEM from three independent experiments. SAXS analysis of WT LRH-1 and S148R mutant. (G) Experimental and calculated SAXS data with inset showing Guinier plots with linear fits yielding Rg values listed in Table 2. (H) Pairwise distance distributions resulting from Fourier transform of the SAXS data with Rg and Dmax parameters listed in Table 2.
Figure 7:
Figure 7:. LRH-1 inter-domain loss of function mutants exhibit increased flexibility and altered dynamics.
Normalized Kratky plots derived from SEC-SAXS of mutants S148R (A) and D314R (C) compared to WT. Quantitative XL-MS analysis of K118-K335 interdomain BS3 crosslink comparing S148R (B) or D314R (D) to WT LRH-1 peptide abundance. *P<0.05. HDX profiles for peptides shown to have differential solvent exchange between WT and the D314R (E-G). ***P<0.0001.
Figure 8:
Figure 8:. LRH-1 inter-domain interactions are altered by DAX-1 and influence DAX-1 regulation of LRH-1 activity.
Side view of (A) the LRH-1FL integrated model, and (C) the LRH-1 LBD:DAX-1 (PDB: 3F5C) co-crystal structure. Schematic cartoon depictions are shown in (B) and (D). (E) Quantitative XL-MS analysis of LRH-1 K118-K335 interdomain BS3 crosslink abundance compared between complexes containing WT LRH-1FL and WT or mutant DAX-1. *P<0.05. (F) LRH-1 mutational analysis with DAX-1 co-transfection in luciferase reporter gene activation assays. Data are the combined results of three independent experiments plotted as the mean ± SD. *P<0.05.

Similar articles

Cited by

References

    1. Abio Madeira F ´ et al. (2019) ‘The EMBL-EBI search and sequence analysis tools APIs in 2019’, Web Server issue Published online, 47. doi: 10.1093/nar/gkz268. - DOI - PMC - PubMed
    1. Alford RF et al. (2017) ‘The Rosetta All-Atom Energy Function for Macromolecular Modeling and Design.’, Journal of chemical theory and computation, 13(6), pp. 3031–3048. doi: 10.1021/acs.jctc.7b00125. - DOI - PMC - PubMed
    1. Bayrer JR et al. (2018) ‘LRH-1 mitigates intestinal inflammatory disease by maintaining epithelial homeostasis and cell survival’, Nature Communications, 9(1), p. 4055. doi: 10.1038/s41467-018-06137-w. - DOI - PMC - PubMed
    1. Bianco S et al. (2019) ‘The Ovulatory Signal Precipitates LRH-1 Transcriptional Switching Mediated by Differential Chromatin Accessibility’, Cell Reports, 28(9), pp. 2443–2454.e4. doi: 10.1016/j.celrep.2019.07.088. - DOI - PubMed
    1. Brendel C, Gelman L and Auwerx J (2002) ‘Multiprotein bridging factor-1 (MBF-1) is a cofactor for nuclear receptors that regulate lipid metabolism.’, Molecular endocrinology (Baltimore, Md.), 16(6), pp. 1367–77. doi: 10.1210/mend.16.6.0843. - DOI - PubMed

Publication types

LinkOut - more resources