. 2020 Jun 9;117(23):12969-12979.
doi: 10.1073/pnas.1917182117. Epub 2020 May 20.

CD5 signalosome coordinates antagonist TCR signals to control the generation of Treg cells induced by foreign antigens

Affiliations

CD5 signalosome coordinates antagonist TCR signals to control the generation of Treg cells induced by foreign antigens

Gaëtan Blaize et al. Proc Natl Acad Sci U S A. .

Abstract

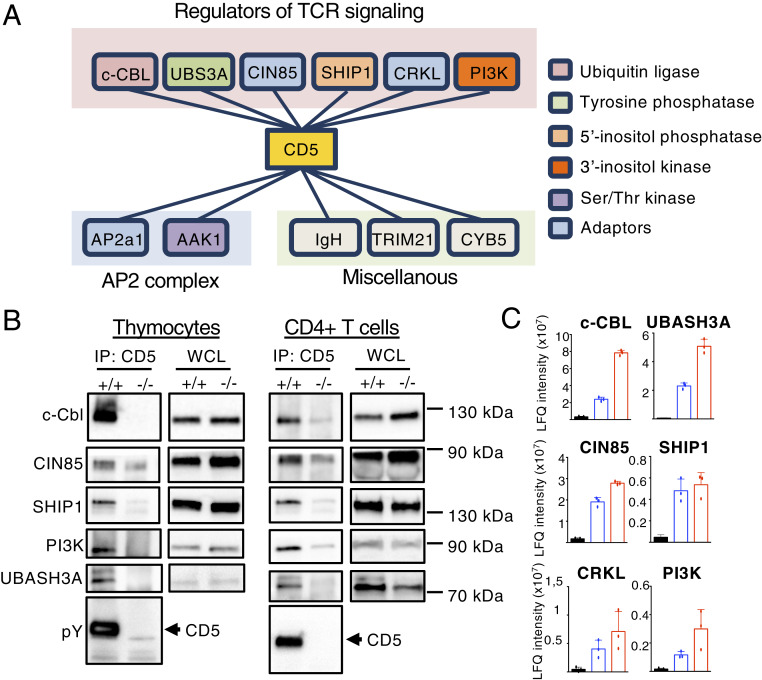
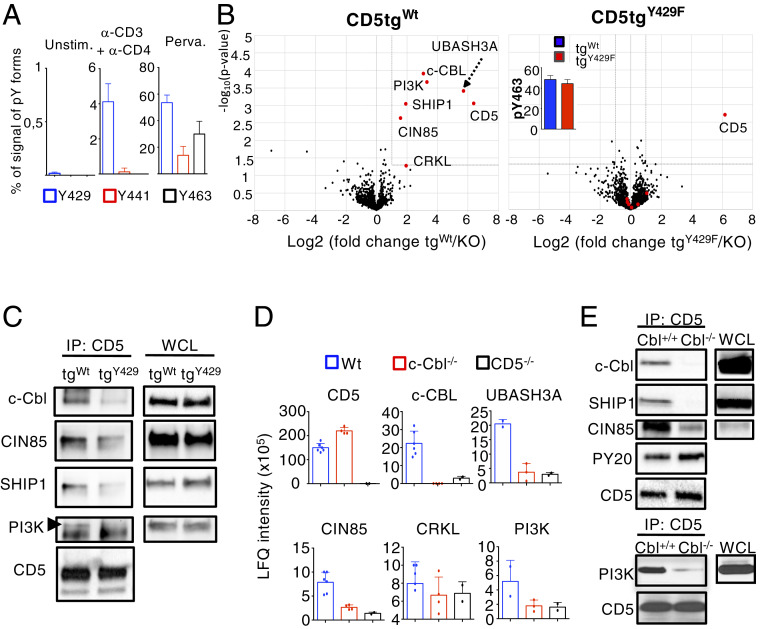
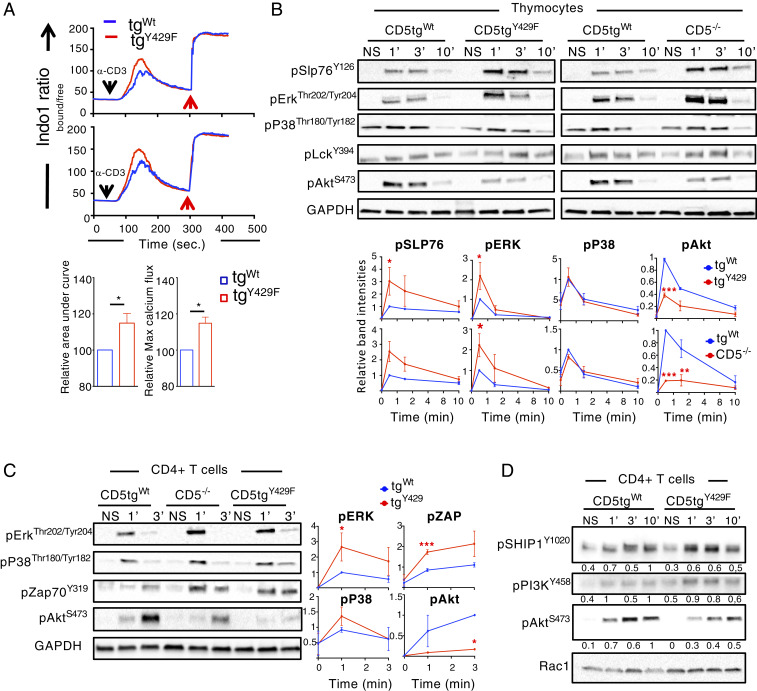
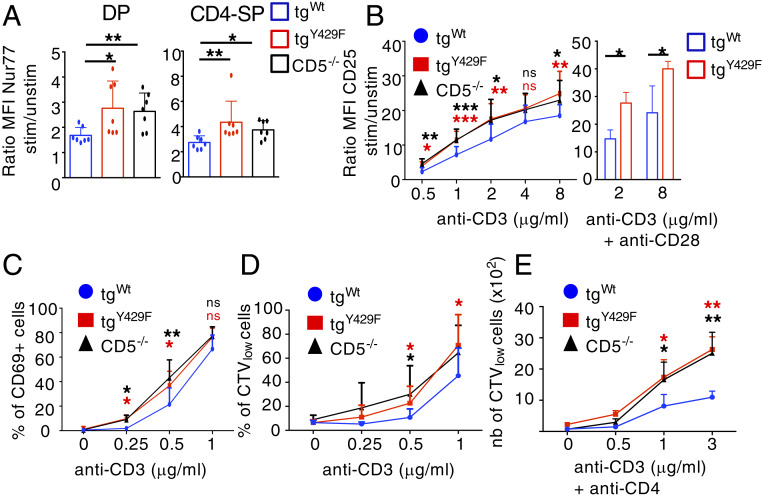
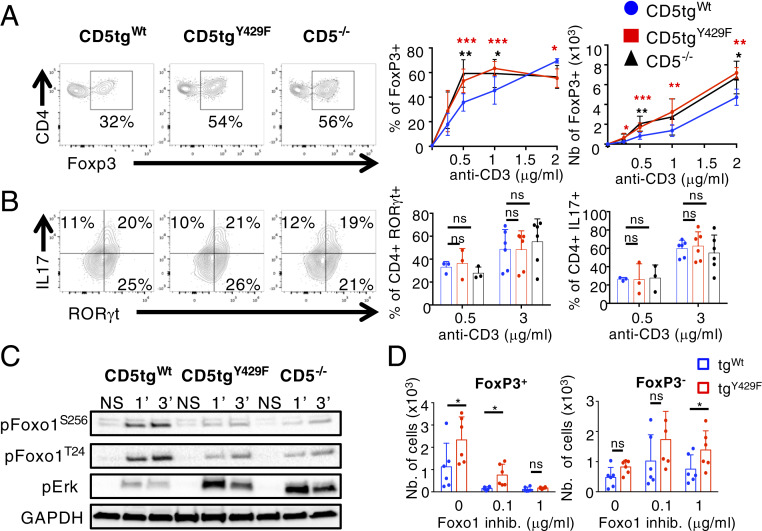
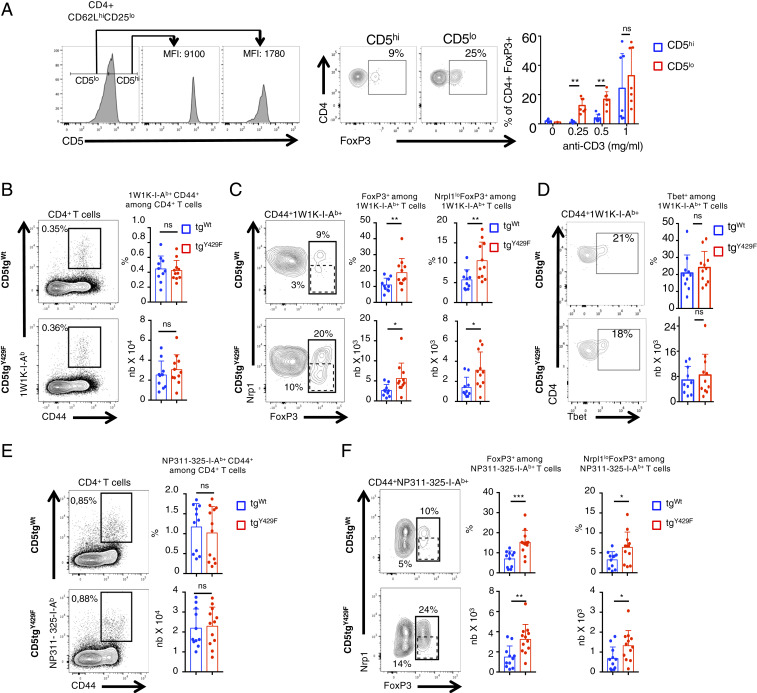
CD5 is characterized as an inhibitory coreceptor with an important regulatory role during T cell development. The molecular mechanism by which CD5 operates has been puzzling and its function in mature T cells suggests promoting rather than repressing effects on immune responses. Here, we combined quantitative mass spectrometry and genetic studies to analyze the components and the activity of the CD5 signaling machinery in primary T cells. We found that T cell receptor (TCR) engagement induces the selective phosphorylation of CD5 tyrosine 429, which serves as a docking site for proteins with adaptor functions (c-Cbl, CIN85, CRKL), connecting CD5 to positive (PI3K) and negative (UBASH3A, SHIP1) regulators of TCR signaling. c-CBL acts as a coordinator in this complex enabling CD5 to synchronize positive and negative feedbacks on TCR signaling through the other components. Disruption of CD5 signalosome in mutant mice reveals that it modulates TCR signal outputs to selectively repress the transactivation of Foxp3 and limit the inopportune induction of peripherally induced regulatory T cells during immune responses against foreign antigen. Our findings bring insights into the paradigm of coreceptor signaling, suggesting that, in addition to providing dualistic enhancing or dampening inputs, coreceptors can engage concomitant stimulatory and inhibitory signaling events, which act together to promote specific functional outcomes.

Keywords: T cells; coreceptors; signaling.


Conflict of interest statement

The authors declare no competing interest.

Figures

Fig. 1.
Fig. 1.
MS analysis of CD5 interactome. (A) Schematic of those proteins that preferentially interact with CD5 in thymocytes stimulated with pervanadate for 1 min. Layouts indicate the classification of these proteins according to their function (pink layout: TCR signaling; blue layout: AP2 complex; green layout: unknown function in T cell signaling). Data represent eight independent experiments with n = 8 mice per group. (B) Thymocytes and peripheral CD4+ T cells from Cd5+/+ (+/+) or Cd5−/− (−/−) mice were stimulated with pervanadate for 5 min. Samples were then subjected to immunoprecipitation (IP) with antibodies specific for CD5 and then analyzed by Western blotting with antibodies specific for the indicated proteins. WCL, whole cell lysate. (C) Relative abundance of principal CD5 interacting partners after co-IP in thymocytes either nonstimulated (black bars) or stimulated with anti-CD3 and anti-CD4 antibodies (blue bars) or pervanadate (red bars). Protein abundances were estimated using the LFQ metric calculated by MaxQuant based on MS peptide signals intensities. Data are means ± SD of three MS measurement and are representative of three independent experiments containing n = 1 mouse per group.
Fig. 2.
Fig. 2.
c-CBL is recruited to CD5 Y429 and is connecting CD5 with its signaling partners. (A) MS analysis of CD5 phosphorylation sites. Thymocytes from WT mice were left unstimulated (Unstim.) or were stimulated with anti-CD3 + anti-CD4 antibodies or pervanadate (Perva.) for 1 min. Samples were then subjected to IP with antibodies specific for CD5. MS intensity of peptide ions containing the three main phosphotyrosine residues of the protein were used to calculate for each site the percentage of MS signal deriving from modified phosphotyrosine forms. MS intensity values of phosphorylated ions were averaged for MS replicate measurements of each sample. Data are the means ± SD and represent three independent experiments containing n = 1 mouse per group. (B) Volcano plots [−log10(Student t test P value) versus log2(fold-change)] showing abundances difference of proteins identified by MS analysis of samples obtained by IP of CD5 from cellular extracts of thymocytes stimulated with pervanadate. (Left) Comparison CD5tgWt vs. Cd5−/− thymocytes (n = 6 independent samples); (Right) comparison CD5tgWt versus Cd5−/− thymocytes (n = 5 independent samples). Protein labeled in red show significant enrichment in CD5tgWt samples compared to control Cd5−/− samples (fold-change > 2 and P < 0.05). The same proteins plotted in red show no significant enrichment in CD5tgY429F samples versus controls. Bar graph (Inset ) in the CD5tgY429F volcano plot represent the MS intensity (log10) of CD5 phosphorylated peptides containing the Y463 of CD5. (C) Thymocytes from CD5tgWt or CD5tgWt mice were stimulated with anti-CD3 + anti-CD4 for 1 min. Samples were then subjected to IP with antibodies specific for CD5 and then analyzed by Western blotting with antibodies specific for the indicated proteins. (D and E) CD5 was immunoprecipitated from cellular extracts of total thymocytes from the indicated genotypes stimulated with pervanadate. Samples were analyzed by MS (D) or Western blot (E). Abundance of specific interacting partners was estimated based on MS signal intensity. Data are means ± SD from at least two MS measurements and are representative of two experiments containing n = 1 mouse per group. Western blots are representative of two independent experiments. WCL, whole cell lysate.
Fig. 3.
Fig. 3.
CD5 coordinates TCR signals in thymocytes and peripheral T cells. (A) Analysis of calcium flux in DP thymocytes from CD5tgWt and CD5tgY429F mice stimulated with anti-CD3 antibodies at 5 or 10 µg/mL (Upper and Lower graph, respectively) in the presence of anti-CD4 antibodies. Red arrows indicate maximum responses following stimulation with ionomycine. Bar graphs represents the area under the curve and the maximum peak intensity of calcium flux normalized to the values obtain in DP thymocytes from CD5tgWt mice. Data are means ± SD and are representative of two independent experiments with n = 1 to 2 mice per group. (B) Thymocytes from CD5tgWt, CD5tgY429F, and Cd5−/− mice were stimulated with anti-CD3 + anti-CD4 antibodies for the indicated times. Total cytoplasmic extracts of the cells were then analyzed by Western blotting with antibodies against phosphorylated forms of SLP76, ERK, P38, LCK, and AKT. Curves show the relative abundances of the indicated phosphorylated proteins as determined by calculating the ratios of the intensities of the bands corresponding to the phosphorylated proteins to those corresponding to GAPDH, the loading control. The y axes represent means ± SD of the relative values calculated after normalization to the highest value in the CD5tgWt cells. Data are representative of three to five independent experiments, each including one mouse of the indicated genotype. (C and D) Peripheral CD4+ T cells from CD5tgWt, CD5tgY429F and Cd5−/− mice were stimulated with anti-CD3 antibodies for the indicated times. Total cytoplasmic extracts of the cells were then analyzed by Western blotting with antibodies against phosphorylated forms of SLP76, ERK, P38, ZAP-70, PI3K, SHIP1, and AKT. Curves or values next to the blots show the relative abundances of the indicated phosphorylated proteins calculated as in B. Data are representative of two to four independent experiments each including one mouse of the indicated genotype. Unpaired two-tailed t test. *P < 0.05; **P < 0.01; ***P < 0.001.
Fig. 4.
Fig. 4.
The CD5 signalosome negatively regulates the activation and the proliferation of CD4+ T cells. (A) Thymocytes from CD5tgWt, CD5tgY429F, and Cd5−/− mice were stimulated or not with anti-CD3 and anti-CD28 antibodies for 4 h. Nur77 protein abundance was then analyzed by flow cytometry in DP and CD4-SP cells after intracytoplasmic staining with anti-Nur77 antibodies. Bar graphs represents the ratio of mean fluorescent intensities (MFI) of Nur77 in stimulated cells to unstimulated cells. Data are means ± SD and are representative of two independent experiments, with n = 3 mice per group. (B) Peripheral CD4+ T cells from CD5tgWt, CD5tgY429F, and Cd5−/− mice were stimulated with the indicated doses of anti-CD3 antibodies alone (curves) or with anti-CD28 antibodies (bar graphs) for 24 h. Curves and bar graphs represents the ratio of MFI of CD25 in stimulated cells to unstimulated cells. Data are mean ± SD and represent, for anti-CD3 alone, four independent experiments with n = 12 mice per group or, for anti-CD3 + anti-CD28, two experiments with n = 4 mice per group. (C) Peripheral CD4+ T cells from CD5tgWt, CD5tgY429F, and Cd5−/− mice were stimulated with the indicated doses of anti-CD3 antibodies for 24 h. Curve graph represents the percentages of CD69+ cells. Data are mean ± SD and represent three independent experiments with n = 4 to 8 mice per group. (D and E) Peripheral CD4+ T cells from CD5tgWt, CD5tgY429F, and Cd5−/− mice previously stained with cell trace violet (CTV) were stimulated with anti-CD3 antibodies alone (D) or with anti-CD4 antibodies (E) for 72 h. Curve graphs represent the percentages (D) or the numbers (E) of CTVlow CD4+ T cells following stimulation with variable doses of anti-CD3 antibodies for 72 h. Data are mean ± SD and represent three independent experiments with n = 7 to 11 mice per group. Unpaired two-tailed Mann–Whitney t test. *P < 0.05; **P < 0.01; ***P < 0.001.
Fig. 5.
Fig. 5.
CD5 signaling restrains the generation of induced Treg cells by promoting AKT-mediated inhibition of FOXO1 and repressing ERK activity. (A) Naïve CD62LhiCD25lo CD4+ T cells from CD5tgWt, CD5tgY429F, and Cd5−/− mice were stimulated with anti-CD3 antibodies in presence of TFG-β for 3 d. Contour plots represent CD4 vs. FOXP3 staining profiles of CD4+ T cells from the indicated genotypes. Curve graphs represent the percentages and numbers of FOXP3+ CD4+ T cells from mice of the indicated genotypes stimulated with the indicated doses of anti-CD3 antibodies in presence of TGF-β. Data are means ± SD and represent two independent experiments with n = 6 to 9 mice per group. (B) Naïve CD62LhiCD25lo CD4+ T cells from CD5tgWt, CD5tgY429F, and Cd5−/− mice were stimulated with anti-CD3 antibodies in presence of TFG-β and IL-6 for 5 d. Contour plots represent CD4 versus RORγt staining profiles of CD4+ T cells from the indicated genotypes. Bar graphs represent the percentages of RORγt+ and IL-17+ CD4+ T cells from mice of the indicated genotypes stimulated with the indicated doses of anti-CD3 antibodies in presence of TGF-β and IL-6. Data are means ± SD and represent two independent experiments, with n = 3 (0.5 μg/mL anti-CD3) and n = 6 (3 μg/mL anti-CD3) mice per group. (C) Peripheral CD4+ T cells from CD5tgWt, CD5tgY429F, and Cd5−/− mice were stimulated or not (NS) with anti-CD3 antibodies for the indicated times. Total cytoplasmic extracts of the cells were then analyzed by Western blotting with antibodies against phosphorylated forms of FOXO1 and ERK. Western blots are representative of two independent experiments. (D) Naïve CD62LhiCD25lo CD4+ T cells from CD5tgWt and CD5tgY429F mice were stimulated with anti-CD3 antibodies in presence of TFG-β with or without variable doses of FOXO1 inhibitors for 3 d. The expression FOXP3 was then analyzed by flow cytometry after intracytoplasmic staining of the cells with anti-FOXP3 antibodies. Bar graphs represent the numbers of FOXP3+ (Left) and FOXP3 CD4+ T cells from mice of the indicated genotypes stimulated with anti-CD3 antibodies in presence of TGF-β with or without the indicated doses of FOXO1 inhibitors. Data are means ± SD and represent two experiments with n = 6 mice per group. Unpaired two-tailed Mann–Whitney t test, except for D, where paired t test with Welch’s correction was performed. *P < 0.05; **P < 0.01; ***P < 0.001.
Fig. 6.
Fig. 6.
CD5-mediated signaling restrain the generation of peripherally induced Treg cells following immunization with foreign antigens and viral infection. (A) CD5lo and CD5hi naïve CD62LhiCD25lo CD4+ T cells from C57BL/6 mice were sorted prior to stimulation with anti-CD3 antibodies in presence of TFG-β for 3 d. Histograms show the sorting strategy. Contour plots represent CD4 versus FOXP3 staining profiles of CD5lo and CD5hi CD4+ T cells. Bar graphs represent the percentages of FOXP3+ CD4+ T cells following stimulation with the indicated doses of anti-CD3 antibodies in presence of TGF-β. Data are means ± SD and represent two independent experiments with n = 7 mice per group. (BD) CD5tgWt and CD5tgY429F mice were immunized with 1W1K peptide in presence of IFA. Draining lymph nodes were collected after 7 d and analyzed by flow cytometry after staining of the cells with 1W1K-conjugated MHC tetramers. (E and F) CD5tgWt and CD5tgY429F mice were intranasally infected with PR8 virus. Draining lymph nodes were collected after 5 d and analyzed by flow cytometry after staining of the cells with NP311-325-conjugated MHC tetramers. (B and E) Contour plots represents CD44 versus tetramer staining profile on gated CD4+ T cells. Bar graphs represent the percentages and absolute numbers of tetramer+CD44+ T cells among CD4+ T cells. (C and F) Contour plots represents FoxP3 vs. Neuropilin1 (Nrp1) staining profile on gated tetramer+CD44+ CD4+ T cells. Bar graphs represent the percentages and absolute numbers of either FoxP3+ (solid gate) or FoxP3+ neuropilinlow (dashed gate) among tetramer+CD44+ CD4+ T cells. Data are representative of two independent experiments and are means ± SD of at least 10 mice for each genotype. Nonparametric t test *P < 0.05; **P < 0.01; ***P < 0.001.

Similar articles

Cited by

References

    1. Chen L., Flies D. B., Molecular mechanisms of T cell co-stimulation and co-inhibition. Nat. Rev. Immunol. 13, 227–242 (2013). - PMC - PubMed
    1. Coquet J. M., Rausch L., Borst J., The importance of co-stimulation in the orchestration of T helper cell differentiation. Immunol. Cell Biol. 93, 780–788 (2015). - PubMed
    1. Anderson A. C., Joller N., Kuchroo V. K., Lag-3, Tim-3, and TIGIT: Co-inhibitory receptors with specialized functions in immune regulation. Immunity 44, 989–1004 (2016). - PMC - PubMed
    1. Acuto O., Michel F., CD28-mediated co-stimulation: A quantitative support for TCR signalling. Nat. Rev. Immunol. 3, 939–951 (2003). - PubMed
    1. Parry R. V., Riley J. L., Ward S. G., Signalling to suit function: Tailoring phosphoinositide 3-kinase during T-cell activation. Trends Immunol. 28, 161–168 (2007). - PubMed

Publication types

MeSH terms