Review
. 2020 May 6:14:396.
doi: 10.3389/fnins.2020.00396. eCollection 2020.

Harmonization of Brain Diffusion MRI: Concepts and Methods

Affiliations
Review

Harmonization of Brain Diffusion MRI: Concepts and Methods

Maíra Siqueira Pinto et al. Front Neurosci. .

Abstract

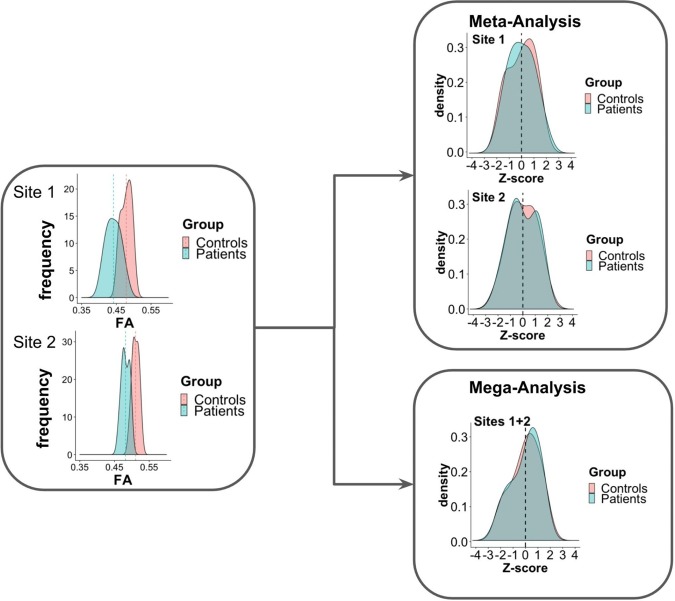
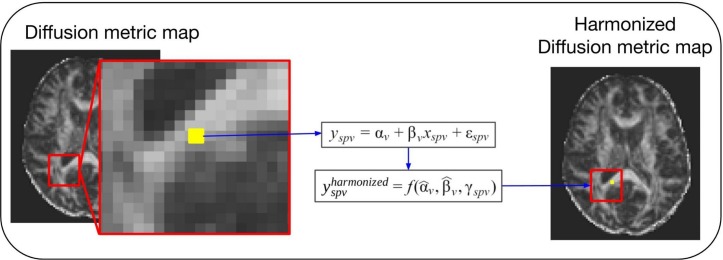
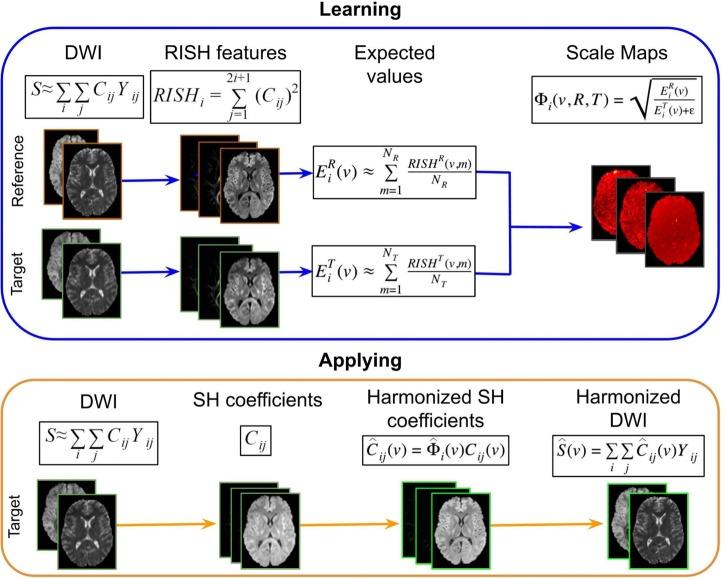
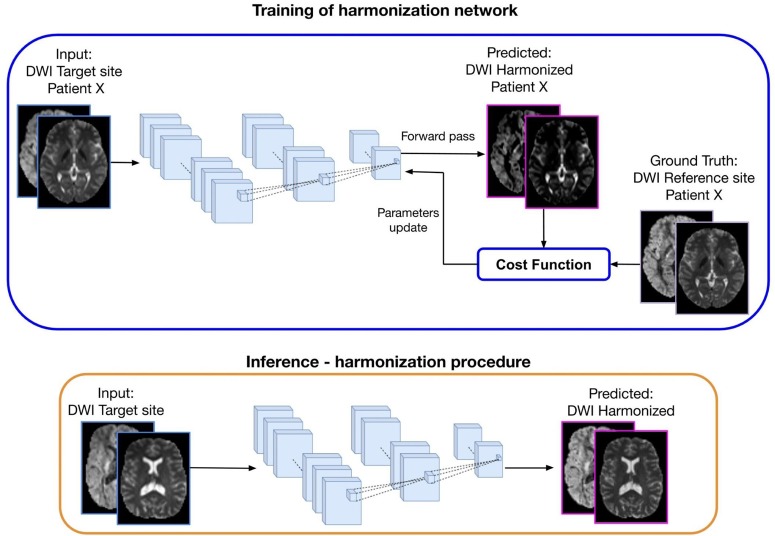
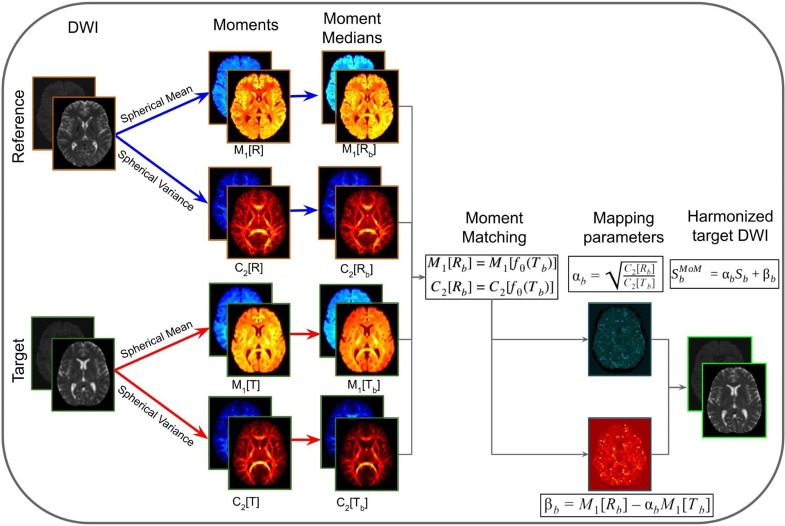
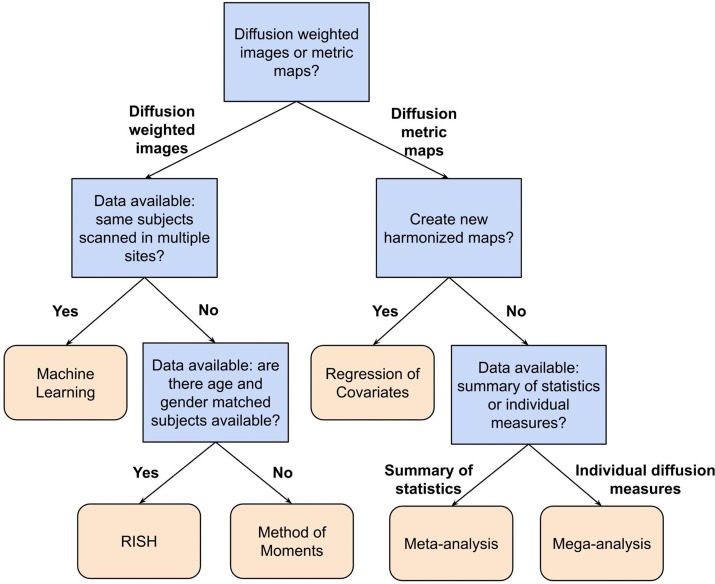
MRI diffusion data suffers from significant inter- and intra-site variability, which hinders multi-site and/or longitudinal diffusion studies. This variability may arise from a range of factors, such as hardware, reconstruction algorithms and acquisition settings. To allow a reliable comparison and joint analysis of diffusion data across sites and over time, there is a clear need for robust data harmonization methods. This review article provides a comprehensive overview of diffusion data harmonization concepts and methods, and their limitations. Overall, the methods for the harmonization of multi-site diffusion images can be categorized in two main groups: diffusion parametric map harmonization (DPMH) and diffusion weighted image harmonization (DWIH). Whereas DPMH harmonizes the diffusion parametric maps (e.g., FA, MD, and MK), DWIH harmonizes the diffusion-weighted images. Defining a gold standard harmonization technique for dMRI data is still an ongoing challenge. Nevertheless, in this paper we provide two classification tools, namely a feature table and a flowchart, which aim to guide the readers in selecting an appropriate harmonization method for their study.

Keywords: diffusion MRI; harmonization; inter-scanner; multi-site; normalization; review.


Figures

FIGURE 1
FIGURE 1
Scheme of meta- and mega-analysis. FA measures from sites 1 and 2, for two groups of subjects: controls and patients. The FA frequency for each group is estimated for each of the sites. Meta-analysis performs the statistical evaluation between groups for each site separately, followed by a weighted combination of its statistical results, while in mega-analysis a weighted statistical evaluation is performed for all sites jointly.
FIGURE 2
FIGURE 2
General scheme of a voxel-wise regression of covariates harmonization approach. For these methods the voxel intensity of the diffusion metric maps (yspv, the intensity for a specific site s, subject p and voxel v) is modeled as a combination of a voxel-wise intercept (αv), a voxel-wise slope (βv) multiplied by a model-specific dependent variable (xspv), and an error component (εspv). Each of the regression of covariates approaches will have a different model and dependent variable to describe the biological and site-related effects on the diffusion metric intensities. Next, the estimated coefficients are used to compute the new harmonized diffusion intensity values (yspvharmonized).
FIGURE 3
FIGURE 3
Representation of the RISH harmonization approach. Consider the purpose of modifying the DWI acquired in a target site, to correspond to the DWI acquired in the reference site. In the learning part using matched subjects, the RISH features are computed in native space from the DWI for the two data sets separately: reference (R) and target (T) sites. Then RISH features are transformed to a common space, the expected values are calculated per site s and per harmonic order i (Eis), after which the scale maps are calculated (Φi). The scale maps, which are computed for each harmonic order i, represent the transformation of the RISH features from target to reference site. Next, in the application step, the SH coefficients from the target site are calculated, the scale maps are warped into native space and applied to the SH coefficients, creating harmonized SH coefficients in native space. Those are transformed back to the signal intensity domain, obtaining the harmonized DWI. Thus, harmonized DWI from the target site can be jointly analyzed with the ones from the reference site.
FIGURE 4
FIGURE 4
Representation of a deep learning approach for diffusion data harmonization. The purpose of the method is to modify the DWI acquired at the target site, to correspond to the DWI of the same subject acquired at the reference site. In the training part, DWI from the target site is used as input and DWI from the reference site as ground truth, for patient X. Matched subjects are used to tune the weights of the harmonization network. During the forward phase, the network produces the predicted harmonized DWI that is compared with the corresponding expected DWI from the reference site. The difference between the predicted and the ground-truth (cost function) is back propagated into the network to update the weights in such a way that the loss decreases and the predicted harmonized DWI is closer to the ground truth. In the inference step, the trained network is used to generate the predicted harmonized DWI from unseen DWI data of the target site, which then become comparable to the DWI from the reference site.
FIGURE 5
FIGURE 5
Representation of the method of moments harmonization pipeline. The purpose of the method is to modify the DWI of the target site, to correspond to the DWI acquired in the reference site. Initially, the diffusion signal in the reference (R) and target (T) are used to compute spherical means (M1[R] and M1[T]) and spherical variances (C2[R] and C2[T]) in native space for each b-shells (b). The spherical moments are warped to a common space, based on the target population. Then the moment medians are calculated across subjects (M1[Rb], C2[Rb], M1[Tb], and C2[Tb]). Afterward, the mapping parameters (αb and βb) are calculated per b-shell, by matching the population moments. The mapping parameters are warped to native space and applied voxel-wise to the DWI images of target site subjects, obtaining the harmonized DWI.
FIGURE 6
FIGURE 6
Flowchart describing a possible way to select a suitable harmonization method depending on the available data and research question at hand. In this flowchart, the first question to be answered is: Do you want to harmonize the DWI or the diffusion metric maps? For harmonization of the diffusion metric maps (right segment of the flowchart), the following question is: Do you want to create new harmonized metric maps? If so, the suggested harmonization approach would be one of the regression of covariates methods. In case of a negative answer, the next question is: Do you have individual measures available or a summary of statistics? If the user has a summary of statistics, the suggestion is to use a meta-analysis approach, otherwise, if one has individual diffusion measures, the suggestion is to harmonize the data using a mega-analysis approach. On the other hand, for harmonization of DWIs (left segment of the flowchart), the next question is: Do you have DWIs of the same subjects acquired in multiple sites? In case of an affirmative answer, the suggested approach is machine learning, which comprehends deep learning and sparse dictionary learning methods. In case of a negative answer, the following question is: Do you have DWIs of a cohort of subjects that is age- and gender-matched between the sites? If the user has matched data, the RISH method is suggested. Otherwise, the method of moments is the suggested approach.

Similar articles

  • Inter-site and inter-scanner diffusion MRI data harmonization.
    Mirzaalian H, Ning L, Savadjiev P, Pasternak O, Bouix S, Michailovich O, Grant G, Marx CE, Morey RA, Flashman LA, George MS, McAllister TW, Andaluz N, Shutter L, Coimbra R, Zafonte RD, Coleman MJ, Kubicki M, Westin CF, Stein MB, Shenton ME, Rathi Y. Mirzaalian H, et al. Neuroimage. 2016 Jul 15;135:311-23. doi: 10.1016/j.neuroimage.2016.04.041. Epub 2016 Apr 30. Neuroimage. 2016. PMID: 27138209 Free PMC article.
  • Cross-scanner and cross-protocol multi-shell diffusion MRI data harmonization: Algorithms and results.
    Ning L, Bonet-Carne E, Grussu F, Sepehrband F, Kaden E, Veraart J, Blumberg SB, Khoo CS, Palombo M, Kokkinos I, Alexander DC, Coll-Font J, Scherrer B, Warfield SK, Karayumak SC, Rathi Y, Koppers S, Weninger L, Ebert J, Merhof D, Moyer D, Pietsch M, Christiaens D, Gomes Teixeira RA, Tournier JD, Schilling KG, Huo Y, Nath V, Hansen C, Blaber J, Landman BA, Zhylka A, Pluim JPW, Parker G, Rudrapatna U, Evans J, Charron C, Jones DK, Tax CMW. Ning L, et al. Neuroimage. 2020 Nov 1;221:117128. doi: 10.1016/j.neuroimage.2020.117128. Epub 2020 Jul 13. Neuroimage. 2020. PMID: 32673745 Free PMC article.
  • Retrospective harmonization of multi-site diffusion MRI data acquired with different acquisition parameters.
    Cetin Karayumak S, Bouix S, Ning L, James A, Crow T, Shenton M, Kubicki M, Rathi Y. Cetin Karayumak S, et al. Neuroimage. 2019 Jan 1;184:180-200. doi: 10.1016/j.neuroimage.2018.08.073. Epub 2018 Sep 8. Neuroimage. 2019. PMID: 30205206 Free PMC article.
  • Harmonization Strategies in Multicenter MRI-Based Radiomics.
    Stamoulou E, Spanakis C, Manikis GC, Karanasiou G, Grigoriadis G, Foukakis T, Tsiknakis M, Fotiadis DI, Marias K. Stamoulou E, et al. J Imaging. 2022 Nov 7;8(11):303. doi: 10.3390/jimaging8110303. J Imaging. 2022. PMID: 36354876 Free PMC article. Review.
  • Harmonization of multi-scanner in vivo magnetic resonance spectroscopy: ENIGMA consortium task group considerations.
    Harris AD, Amiri H, Bento M, Cohen R, Ching CRK, Cudalbu C, Dennis EL, Doose A, Ehrlich S, Kirov II, Mekle R, Oeltzschner G, Porges E, Souza R, Tam FI, Taylor B, Thompson PM, Quidé Y, Wilde EA, Williamson J, Lin AP, Bartnik-Olson B. Harris AD, et al. Front Neurol. 2023 Jan 4;13:1045678. doi: 10.3389/fneur.2022.1045678. eCollection 2022. Front Neurol. 2023. PMID: 36686533 Free PMC article. Review.

Cited by

References

    1. Alexander A. L., Lee J. E., Wu Y. C., Field A. S. (2006). Comparison of diffusion tensor imaging measurements at 3.0 T versus 1.5 T with and without parallel imaging. Neuroimag. Clin. N. Am. 16 299–309. 10.1016/j.nic.2006.02.006 - DOI - PubMed
    1. Avants B. B., Tustison N. J., Song G., Cook P. A., Klein A., Gee J. C. (2011). A reproducible evaluation of ants similarity metric performance in brain image registration. Neuroimage 54 2033–2044. - PMC - PubMed
    1. Beckmann C. F., Jenkinson M., Smith S. M. (2003). General multilevel linear modeling for group analysis in FMRI. Neuroimage 20 1052–1063. 10.1016/S1053-8119(03)00435-X - DOI - PubMed
    1. Button K. S., Ioannidis J. P. A., Mokrysz C., Nosek B. A., Flint J., Robinson E. S. J., et al. (2013). “Power failure: why small sample size undermines the reliability of neuroscience”: Erratum. Nat. Rev. Neurosci. 14:442. - PubMed
    1. Cannon T. D., Sun F., McEwen S. J., Papademetris X., He G., van Erp T. G. M., et al. (2014). Reliability of neuroanatomical measurements in a multisite longitudinal study of youth at risk for psychosis. Hum. Brain Mapp. 35 2424–2434. 10.1002/hbm.22338 - DOI - PMC - PubMed

LinkOut - more resources