. 2020 May 6:11:736.
doi: 10.3389/fimmu.2020.00736. eCollection 2020.

Differential Expression of IgM and IgD Discriminates Two Subpopulations of Human Circulating IgM+IgD+CD27+ B Cells That Differ Phenotypically, Functionally, and Genetically

Affiliations

Differential Expression of IgM and IgD Discriminates Two Subpopulations of Human Circulating IgM+IgD+CD27+ B Cells That Differ Phenotypically, Functionally, and Genetically

Diana Bautista et al. Front Immunol. .

Abstract

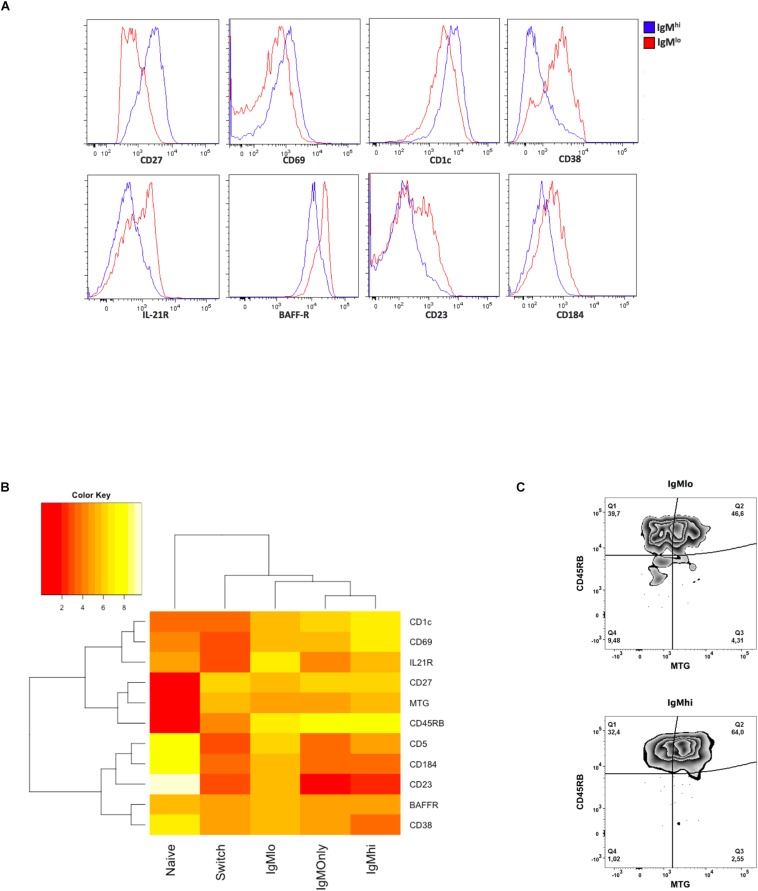
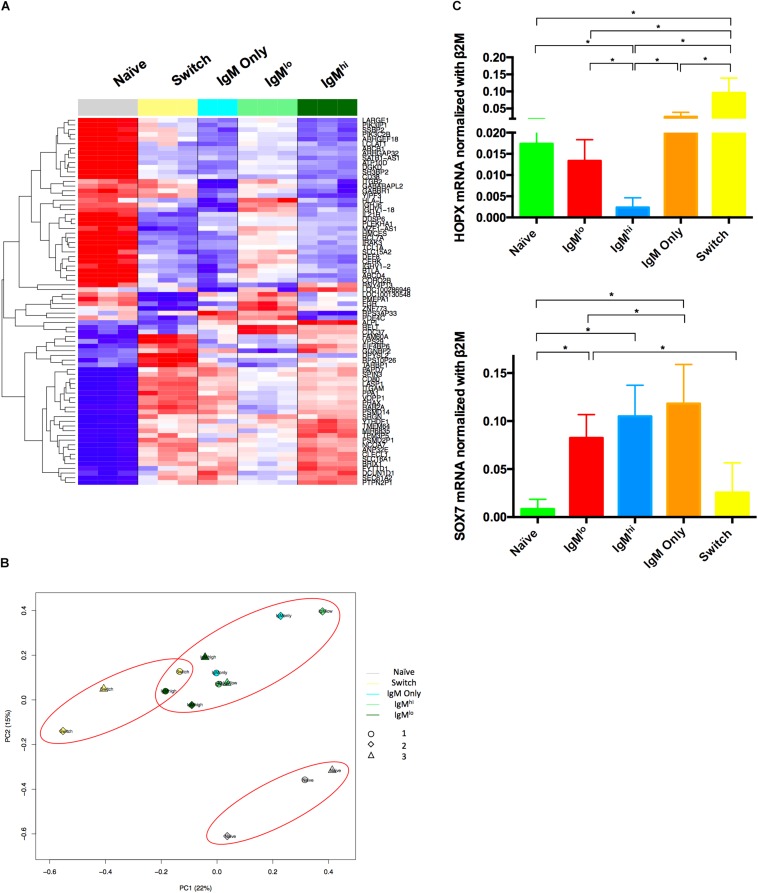
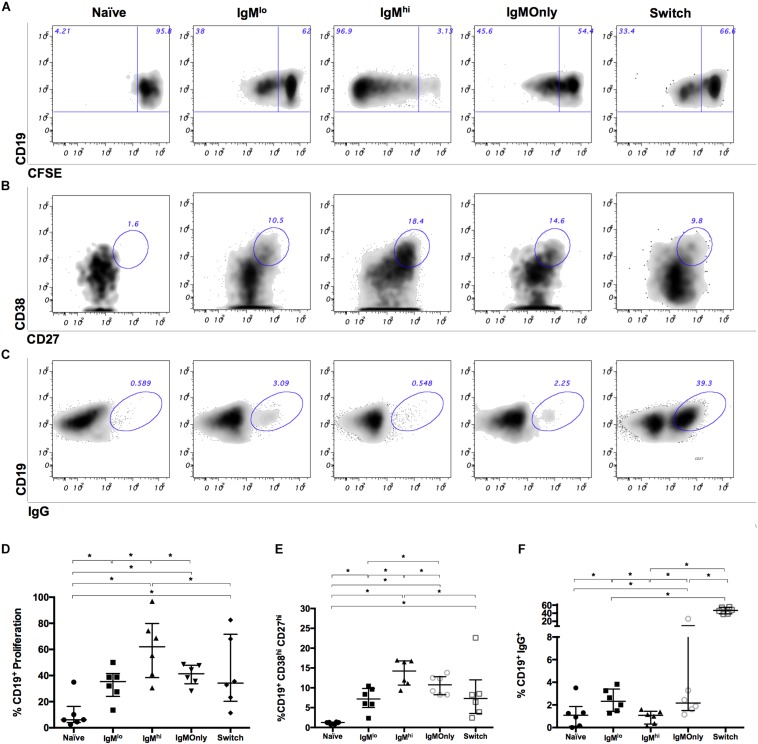
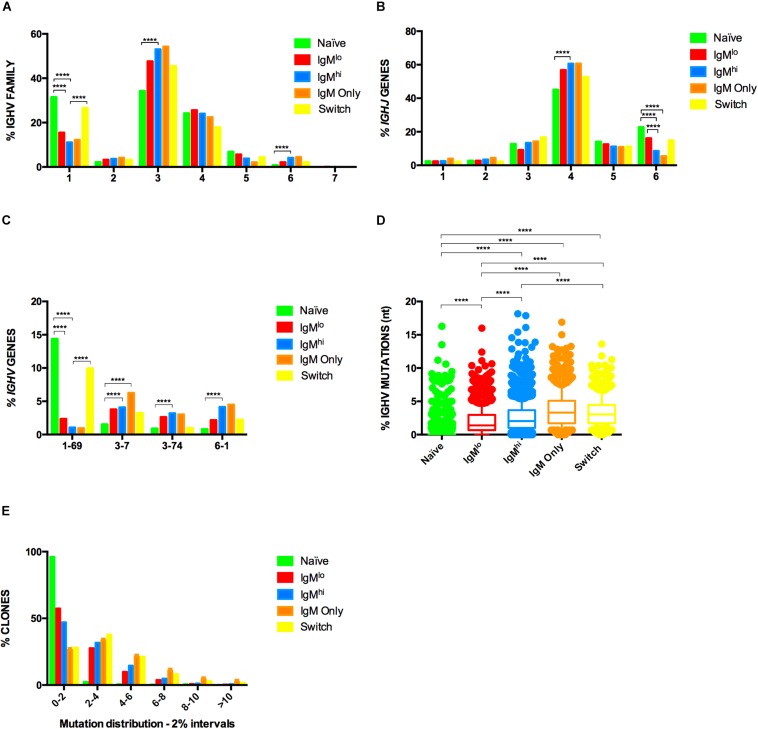
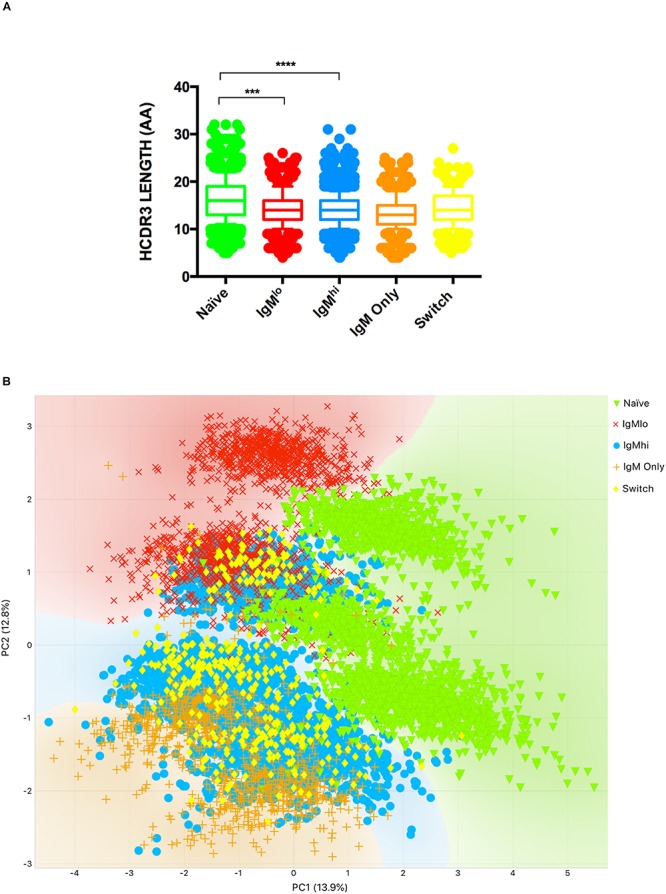
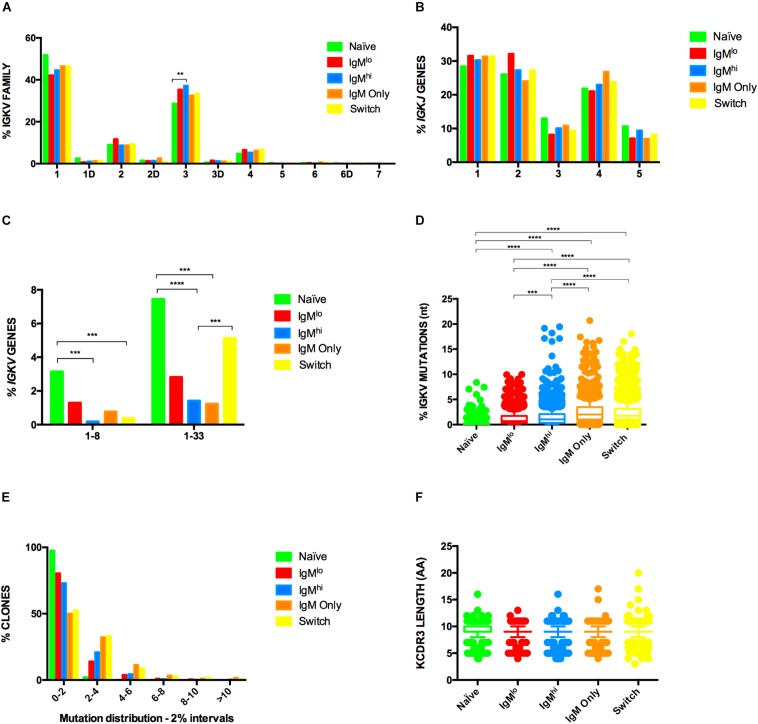
The origin and function of blood IgM+IgD+CD27+ B cells is controversial, and they are considered a heterogeneous population. Previous staining of circulating B cells of healthy donors with rotavirus fluorescent virus-like particles allowed us to differentiate two subsets of IgM+IgD+CD27+: IgMhi and IgMlo B cells. Here, we confirmed this finding and compared the phenotype, transcriptome, in vitro function, and Ig gene repertoire of these two subsets. Eleven markers phenotypically discriminated both subsets (CD1c, CD69, IL21R, CD27, MTG, CD45RB, CD5, CD184, CD23, BAFFR, and CD38) with the IgMhi phenotypically resembling previously reported marginal zone B cells and the IgMlo resembling both naïve and memory B cells. Transcriptomic analysis showed that both subpopulations clustered close to germinal center-experienced IgM only B cells with a Principal Component Analysis, but differed in expression of 78 genes. Moreover, IgMhi B cells expressed genes characteristic of previously reported marginal zone B cells. After stimulation with CpG and cytokines, significantly (p < 0.05) higher frequencies (62.5%) of IgMhi B cells proliferated, compared with IgMlo B cells (35.37%), and differentiated to antibody secreting cells (14.22% for IgMhi and 7.19% for IgMlo). IgMhi B cells had significantly (p < 0.0007) higher frequencies of mutations in IGHV and IGKV regions, IgMlo B cells had higher usage of IGHJ6 genes (p < 0.0001), and both subsets differed in their HCDR3 properties. IgMhi B cells shared most of their shared IGH clonotypes with IgM only memory B cells, and IgMlo B cells with IgMhi B cells. These results support the notion that differential expression of IgM and IgD discriminates two subpopulations of human circulating IgM+IgD+CD27+ B cells, with the IgMhi B cells having similarities with previously described marginal zone B cells that passed through germinal centers, and the IgMlo B cells being the least differentiated amongst the IgM+CD27+ subsets.

Keywords: Ig gene repertoire; blood; cell proliferation; cell surface molecules; gene expression; human; marginal zone B cells; memory B cells.


Figures

FIGURE 1
FIGURE 1
Phenotypic profile of B cells subsets. Twenty-six markers were evaluated by flow cytometry on the different B cells subsets (complete results are presented in Supplementary Table 1). (A) Representative histograms of selected markers for which a statistically significant difference was observed with the Kruskal-Wallis and Wilcoxon signed-rank test, p < 0.05, between IgMhi (blue) and IgMlo (red) B cells. (B) Unsupervised clustering analysis of the median normalized iMFI from markers that were statistically different between IgMhi and IgMlo B cells. n = 5–18. To normalize the iMFI, raw values were square root transformed. Each transformed value was then multiplied by five and divided by the average of the transformed values in all five B cells subsets for each marker. (C) Representative plot of the joint expression of CD45RB (MEM55) vs. MTG in one volunteer, n = 7.
FIGURE 2
FIGURE 2
Transcriptomic profile of B cells subsets. (A) Clustering analysis of the 78 genes that differed in expression between IgMhi and IgMlo B cells subsets with an FDRq LME-ANOVA < 0.001 and a p < 0.01. (B) PCA of Brainarray renormalized transcriptomic data adjusted by donor of the five B cells subsets performed as described in materials and methods. n = 3 for all subpopulations except for n = 2 for IgM only. Gene expression values are color coded, ranging from blue (low expression) to red (high expression), scaled by row, (C) RNA purified from sorted B cells were analyzed for the relative expression of HOPX and SOX7. n = 6. The relative expression of these genes normalized with the B2M gene is shown. Kruskal-Wallis and Wilcoxon test were used for evaluating differences among groups *p ≤ 0.05.
FIGURE 3
FIGURE 3
Proliferation, differentiation to ASC, and IgG expression of B cells subsets after ex vivo stimulation. 0.4 – 1.0 × 10⁶ sorted B cells from healthy donors were stimulated with CpG and a cocktail of cytokines (IL-2, IL-6, and IL-10) together with irradiated fibroblasts for 3 days and evaluated by flow cytometry. Representative dot plots of (A) CFSE- proliferating B cells, (B) differentiation to ASC (CD38hi CD27hi), and (C) intracellular IgG expression. (D–F) summary of experiments presented in (A–C), respectively. Wilcoxon tests were used for evaluating differences among groups. Lines and error bars denote the median and interquartile range * denotes p < 0.05. n = 6.
FIGURE 4
FIGURE 4
Heavy chain repertoire of B cells subsets. Frequencies of IGHV family (A), IGHJ genes (B) and IGHV genes (C) used by different B cells subsets are shown. Samples from three donors were pooled and analyzed with Fisher’s test with p-value correction using FDR. In (C) shown are only the IGHV genes for which statistical differences were observed in all three donors studied. IGHV region mutations frequencies (D) were analyzed by Kruskal-Wallis test using Dunn’s multiple comparison test correction. The median and interquartile range of the three donors is shown. Only statistically significant differences observed in all three donors are shown ****p ≤ 0.00005, n = 3. (E) IGHV region mutations frequencies depicted as fraction of clones within six different 2% mutation intervals, from 0 to 2% (left) to >10% mutation frequency (far right).
FIGURE 5
FIGURE 5
Analysis of HCDR3. The length of HCDR3 aa (A) and bi-plot of PCA of HCDR3 properties (performed as described in Materials and methods) (B) of the different B cell subsets from 3 volunteers are shown. The median and interquartile range of the three donors is shown (A). Only statistically significant differences observed in all three donors are shown ***p ≤ 0.0005 and ****p ≤ 0.00005 (A), n = 3.
FIGURE 6
FIGURE 6
Light chain repertoire profile of B cells subsets. Frequencies of IGKV family (A), IGKJ genes (B) and IGKV genes (C) used by different B cells subsets are shown. Samples from three donors were pooled and analyzed with Fisher’s test with p-value correction using FDR. and IGKV region mutations frequencies (D) were analyzed by Kruskal-Wallis test using Dunn’s multiple comparison test correction. The median and interquartile range of the three donors is shown. Only statistically significant differences observed in all three donors are shown. **p < 0.005, ***p < 0.0005, ****p < 0.00005, n = 3 IGKV region mutations frequencies depicted as fraction of clones within six different 2% mutation intervals, from 0 to 2% (left) to >10% mutation frequency (far right) (E). meadian of KCDR3 length is shown (F).

References

    1. Cyster JG, Allen CDC. B cell responses: cell interaction dynamics and decisions. Cell. (2019) 177:524–40. 10.1016/j.cell.2019.03.016 - DOI - PMC - PubMed
    1. Weisel F, Shlomchik M. Memory B cells of mice and humans. Annu Rev Immunol. (2017) 35:255–84. 10.1146/annurev-immunol - DOI - PubMed
    1. Kruetzmann S, Rosado MM, Weber H, Germing U, Tournilhac O, Peter H-H, et al. Human immunoglobulin M memory B cells controlling streptococcus pneumoniae Infections are generated in the spleen. J Exp Med. (2003) 197:939–45. 10.1084/jem.20022020 - DOI - PMC - PubMed
    1. Rojas OL, Narváez CF, Greenberg HB, Angel J, Franco MA. Characterization of rotavirus specific B cells and their relation with serological memory. Virology. (2008) 380:234–42. 10.1016/j.virol.2008.08.004 - DOI - PMC - PubMed
    1. Tian C, Luskin GK, Dischert KM, Higginbotham JN, Shepherd BE, Crowe JE. Immunodominance of the VH1-46 antibody gene segment in the primary repertoire of human rotavirus-specific B cells is reduced in the memory compartment through somatic mutation of nondominant clones. J Immunol. (2008) 180:3279–88. 10.4049/jimmunol.180.5.3279 - DOI - PubMed

Publication types

MeSH terms

Substances