. 2020 May 6:11:740.
doi: 10.3389/fimmu.2020.00740. eCollection 2020.

FcγR Binding and ADCC Activity of Human IgG Allotypes

Affiliations

FcγR Binding and ADCC Activity of Human IgG Allotypes

Steven W de Taeye et al. Front Immunol. .

Abstract

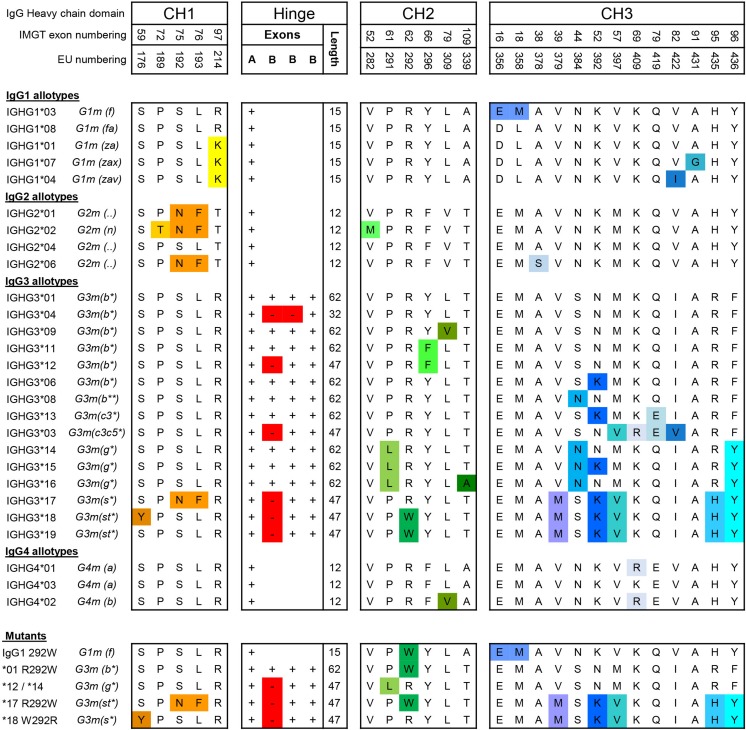
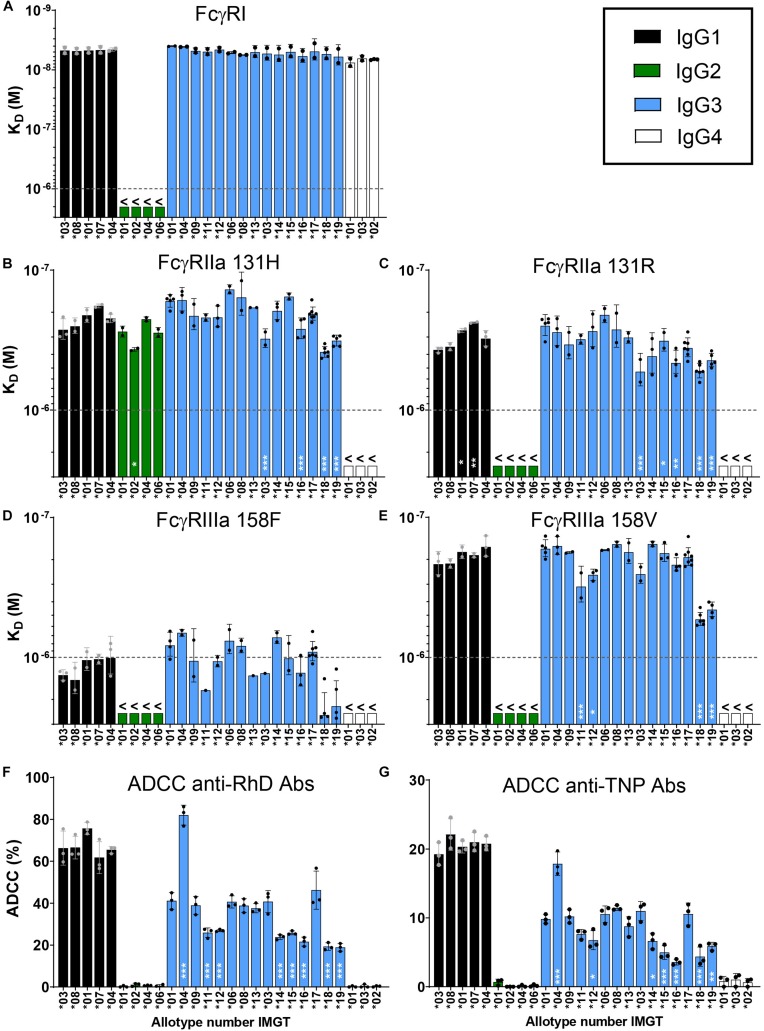
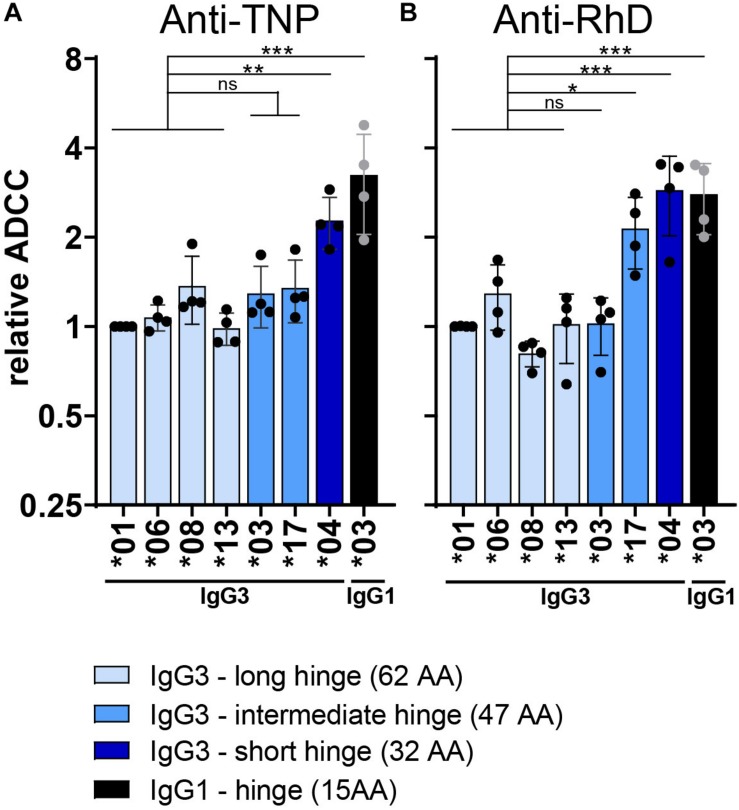
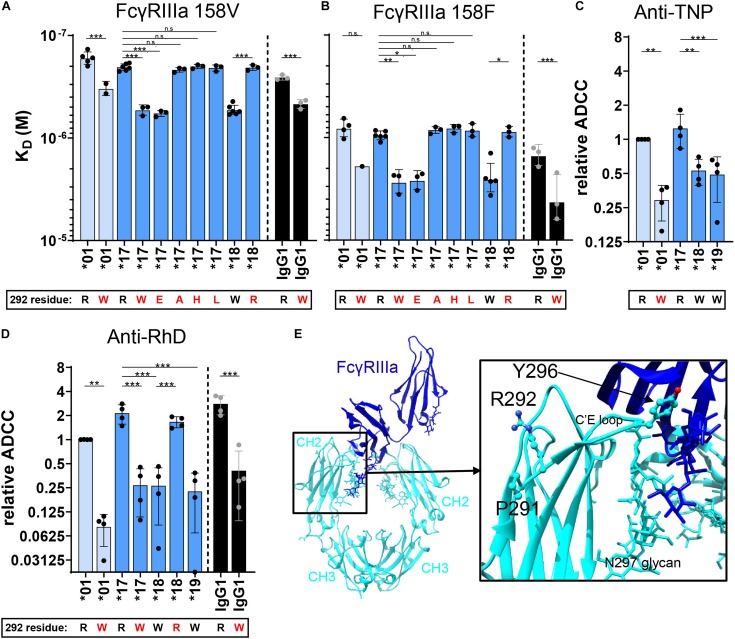
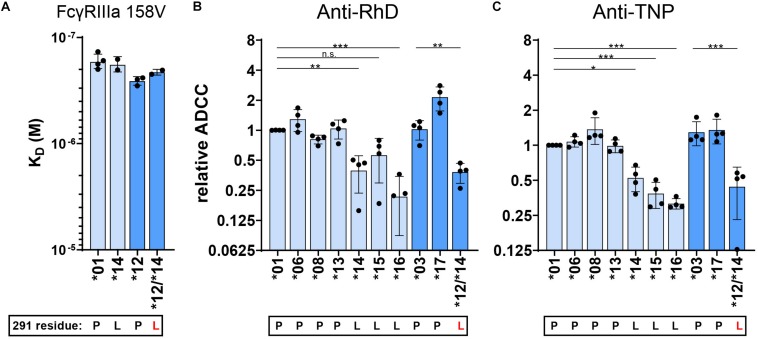
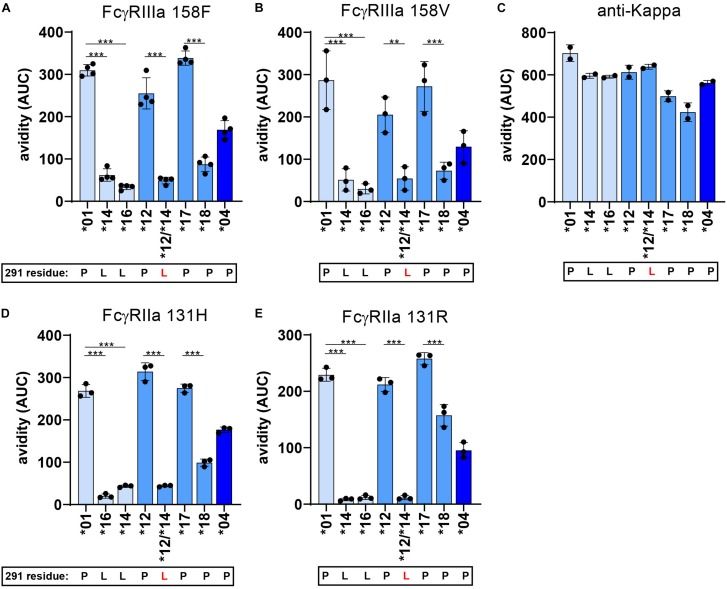
Antibody dependent cellular cytotoxicity (ADCC) is an Fc-dependent effector function of IgG important for anti-viral immunity and anti-tumor therapies. NK-cell mediated ADCC is mainly triggered by IgG-subclasses IgG1 and IgG3 through the IgG-Fc-receptor (FcγR) IIIa. Polymorphisms in the immunoglobulin gamma heavy chain gene likely form a layer of variation in the strength of the ADCC-response, but this has never been studied in detail. We produced all 27 known IgG allotypes and assessed FcγRIIIa binding and ADCC activity. While all IgG1, IgG2, and IgG4 allotypes behaved similarly within subclass, large allotype-specific variation was found for IgG3. ADCC capacity was affected by residues 291, 292, and 296 in the CH2 domain through altered affinity or avidity for FcγRIIIa. Furthermore, allotypic variation in hinge length affected ADCC, likely through altered proximity at the immunological synapse. Thus, these functional differences between IgG allotypes have important implications for therapeutic applications and susceptibility to infectious-, allo- or auto-immune diseases.

Keywords: Fc gamma receptor; IgG polymorphism; antibodies; antibody dependent cellular cytotoxicity; glycosylation.


Figures

FIGURE 1
FIGURE 1
Amino acid variation between IgG allotypes. Variation at the amino acid level between IgG allotypes within the IgG1, IgG2, IgG3, and IgG4 subclasses and mutants [Adapted from Vidarsson et al. 2014 (2)]. For each domain, CH1, hinge, CH2 and CH3, amino acid differences between polymorphic variants are indicated with specific colors. Polymorphisms in the hinge region are identified by the presence or absence of hinge exons (A and B).
FIGURE 2
FIGURE 2
Characterization of binding strength of IgG allotypes to FcγR. Binding of immunoglobulin G allotypes to (A) FcγRI, (B) FcγRIIa 131H, (C) FcγRIIa 131R, (D) FcγRIIIa 158F and (E) FcγRIIIa 158V as determined by SPR. KD values for each IgG allotype are plotted as bar graphs, in which black bars represent IgG1 allotypes, green bars IgG2 allotypes, blue bars IgG3 allotypes and white bars IgG4 allotypes. The highest antibody concentration (1000 nM/1 × 10– 6 M) that was used in the SPR measurement is depicted as a dotted line. KD values below this line are unreliable and are represented as >1000 nM. Error bars indicate SEM of ≥2 independent measurements. Individual sensorgrams from which KD values were quantified are displayed in Supplementary Figure S1B. NK cell mediated killing of (F) bromelain treated RhD+ red blood cells by all anti-RhD allotypes and (G) TNPlated red blood cells by all anti-TNP allotypes at a concentration of 1.25 μg/ml. Percentage ADCC specific killing of red blood cells was measured in triplo and the mean is plotted in a bar graph. NK-cell mediated ADCC by anti-RhD allotypes was measured with NK cells from four individual donors, as shown in Supplementary Figure S2A. One representative result of four individual experiments is depicted here. To determine significant differences between allotypes within each subclass we used a one-way ANOVA with Sidak’s multiple comparison test, and significant differences are indicated with white asterisks: *p < 0.05, **p < 0.01, ***p < 0.001. This statistical analysis was performed separately for all allotypes within a subclass and compared to one reference antibody (IgG1*03, IgG2*01, IgG3*01, and IgG4*01).
FIGURE 3
FIGURE 3
Influence of the hinge on ADCC capacity of IgG3 allotypes. Relative ADCC activity of both (A) anti-TNP and (B) anti-RhD antibodies with varying hinge length. ADCC activity of all IgG allotypes was performed with NK-cells isolated from four different donors and is shown in Supplementary Figures S2, S4. Depicted here is the relative ADCC compared to IgG3*01 (set to 1) derived from the raw ADCC data. Only IgG3 allotypes with a PRYLT CH2 domain (Figure 1) are plotted to exclusively monitor the effect of the hinge length. IgG3 allotypes are colored according to their hinge length, with long hinge allotypes in light blue, intermediate hinge in blue and short hinge allotypes in dark blue. Black bars depict the relative ADCC capacity of IgG1 allotype *03 as a comparison. Statistical comparison between groups was performed using a one-way ANOVA with Sidak’s multiple comparison test, and significant differences are indicated with asterisks: *p < 0.05, **p < 0.01, ***p < 0.001. The broad line above the long hinge variants indicates that the statistical comparison between for example allotype *04 and the four long hinge variants (all tested individually) had the same outcome.
FIGURE 4
FIGURE 4
FcγRIIIa binding and ADCC capacity of 292-mutated IgG allotypes. The affinity (KD) of 292–mutant anti-RhD IgG allotypes for (A) FcγRIIIa 158V and (B) FcγRIIIa 158F was determined by SPR. Error bars indicate SEM of ≥2 independent measurements. ADCC activity was assessed for 292-mutant (C) anti-TNP allotypes and (D) anti-RhD antibodies using NK cells from four different donors. The relative ADCC capacity compared to IgG3 allotype *01 is plotted (original ADCC data in Supplementary Figure S4). IgG3 allotypes and 292-mutants with a long hinge are displayed in light blue, an intermediate hinge in blue, a short hinge in dark blue and IgG1 in black. In all graphs the amino acid at residue 292 (single-letter code) for each antibody is indicated at the x-axis below the IgG3 allotype number, where 292-mutated antibodies are displayed with a red letter. Statistical comparison between groups was performed using a One-way ANOVA with Sidak’s multiple comparisons test, and significant differences are indicated with asterisks: *p < 0.05, **p < 0.01, ***p < 0.001. (E) Crystal structure of fucosylated IgG1 Fc (cyan) in complex with FcγRIIIa (blue) (PDB; 3SGJ) (53). Residues Pro-291, Arg-292 and Tyr-296 are displayed in a ball-and-stick model.
FIGURE 5
FIGURE 5
FcγRIIIa binding and ADCC capacity of 291-mutated IgG3 allotypes. (A) The affinity of 291–mutant and natural anti-RhD IgG allotypes for FcγRIIIa 158V was determined by SPR. KD values of at least two individual measurements are plotted. ADCC activity was determined for 291-mutant (B) anti-RhD and (C) anti-TNP allotypes using NK cells from four different donors. The relative ADCC capacity compared to IgG3 allotype *01 is plotted (original ADCC data in Supplementary Figure S4). IgG3 allotypes and 291-mutants with a long hinge are displayed in light blue and with an intermediate hinge in blue. In all graphs the amino acid at residue 291 (single-letter code) for each antibody is indicated at the x-axis below the IgG3 allotype number, where 291-mutated antibodies are displayed with a red letter. Mutant *12/*14 contains two mutations in the CH2 domain (F296Y and P291L) compared to IgG3 allotype *12. Statistical comparison between antibodies were performed using a one way ANOVA analysis with Sidak’s multiple comparisons test (*p < 0.05, **p < 0.01, ***p < 0.001).
FIGURE 6
FIGURE 6
FcγR avidity measurements using cellular SPR. (A) Schematic figure of cellular surface plamon resonance (cSPR) avidity measurements showing FcγR spotted on the sensor at different densities and subsequently flow of opsonized red blood cells over the sensor (B) Raw sensorgram of cSPR avidity measurement in which the sedimentation phase (S) and increasing flow speeds are indicated. Each color represents a particular level of antibody opsonization, ranging from 2.5 μg/ml to 0.039 μg/ml. (C) Total/sedimentation (T/S) response units (RU) ratios are plotted to illustrate binding strength of RBCs opsonized with IgG3 allotype IGHG3*01 to FcγRIIIa 158F at each flow speed.
FIGURE 7
FIGURE 7
FcγR avidity measurements of IgG3 allotypes. The avidity of RBCs opsonized with various IgG3 allotypes to FcγR as determined by cSPR. Avidity measurements to FcγRIIa 131R, FcγRIIa 131H, FcγRIIIa 158F, FcγRIIIa 158V were determined for seven IgG3 allotypes (*01, *04, *12, *14, *16, *17, *18) and one IgG3 mutant expressing a L291 (*12/*14). To compare between allotypes we calculated area under the curve (AUC) values from the Total/Sedimentation (T/S) ratios that are plotted in Supplementary Figure S6 at a specific receptor density and RBC opsonization concentration. Thus, avidity measurements to (A) FcγRIIa 131R at a receptor density of 30 nM and opsonization concentration of 0.625 μg/ml, (B) FcγRIIa 131H at a receptor density of 30 nM and opsonization concentration of 2.5 μg/ml, (C) FcγRIIIa 158F at a receptor density of 30 nM and opsonization concentration of 0.625 μg/ml and (D) FcγRIIIa 158V at a receptor density of 10 nM and opsonization concentration of 1.25 μg/ml. (E) Binding strength to an anti-kappa nanobody (density of 1 nM and opsonization concentration of 0.625 μg/ml) was determined simultaneously to confirm equal RBC opsonization levels with each allotype. Error bars indicate SD of ≥2 independent measurements. In all graphs the amino acid at residue 291 (single-letter code) for each antibody is indicated at the x-axis below the IgG3 allotype number, where 291-mutated antibodies are displayed with a red letter. Statistical comparison between antibodies were performed using a one way ANOVA analysis with Sidak’s multiple comparisons test (*p < 0.05, **p < 0.01, ***p < 0.001).

References

    1. Nimmerjahn F, Ravetch JV. Fcγ receptors as regulators of immune responses. Nat Rev Immunol. (2008) 8:34–47. 10.1038/nri2206 - DOI - PubMed
    1. Vidarsson G, Dekkers G, Rispens T. IgG subclasses and allotypes: from structure to effector functions. Front Immunol. (2014) 5:520. 10.3389/fimmu.2014.00520 - DOI - PMC - PubMed
    1. de Taeye SW, Rispens T, Vidarsson G. The ligands for human IgG and their effector functions. Antibodies. (2019) 8:30. 10.3390/antib8020030 - DOI - PMC - PubMed
    1. Lu LL, Suscovich TJ, Fortune SM, Alter G. Beyond binding: antibody effector functions in infectious diseases. Nat Rev Immunol. (2018) 18:46–61. 10.1038/nri.2017.106 - DOI - PMC - PubMed
    1. van Erp EA, Luytjes W, Ferwerda G, van Kasteren PB. Fc-mediated antibody effector functions during respiratory syncytial virus infection and disease. Front Immunol. (2019) 10:548. 10.3389/fimmu.2019.00548 - DOI - PMC - PubMed

Publication types

MeSH terms

LinkOut - more resources