Comparative Study
. 2020 May 6:11:782.
doi: 10.3389/fimmu.2020.00782. eCollection 2020.

Comparative Analysis of Thymic and Blood Treg in Myasthenia Gravis: Thymic Epithelial Cells Contribute to Thymic Immunoregulatory Defects

Affiliations
Comparative Study

Comparative Analysis of Thymic and Blood Treg in Myasthenia Gravis: Thymic Epithelial Cells Contribute to Thymic Immunoregulatory Defects

Frédérique Truffault et al. Front Immunol. .

Abstract

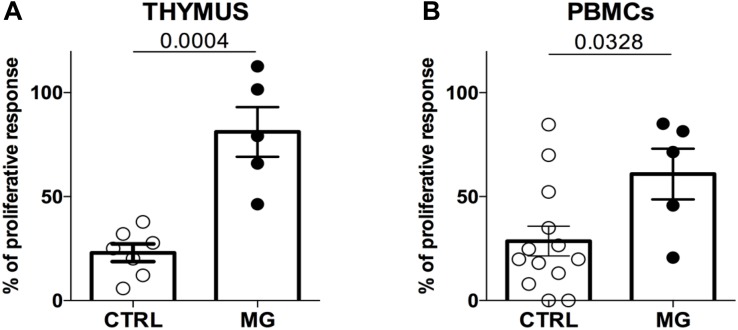
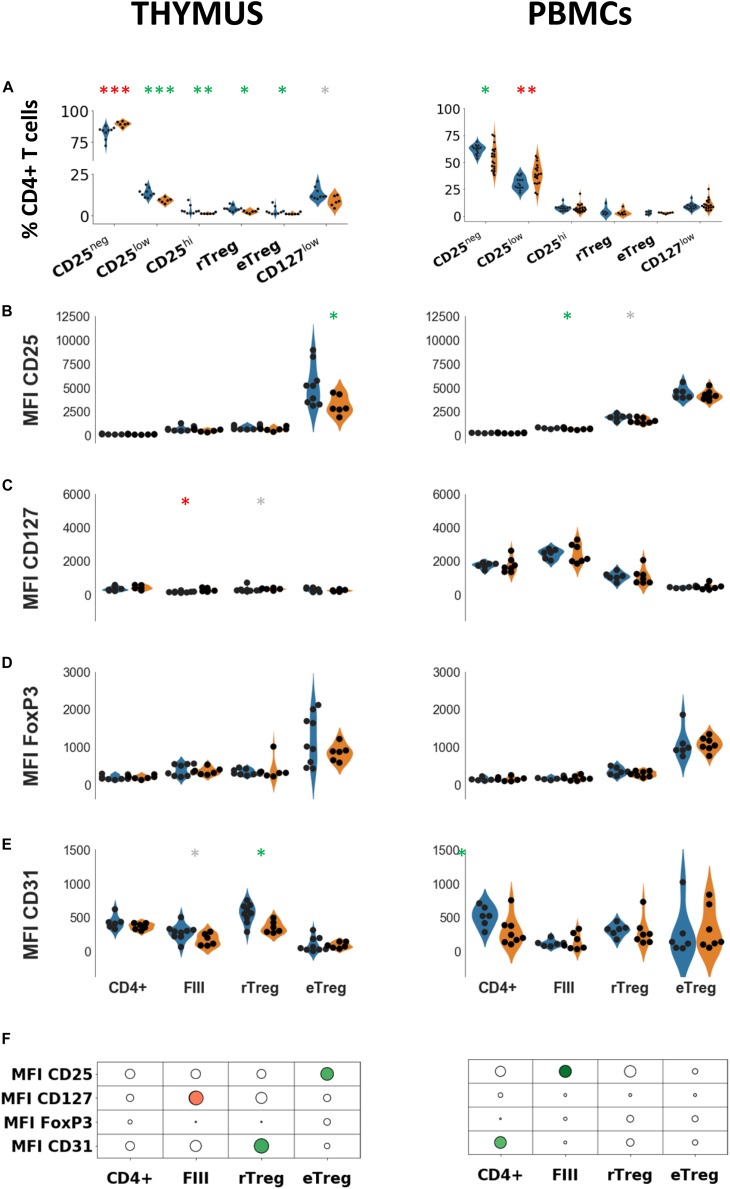
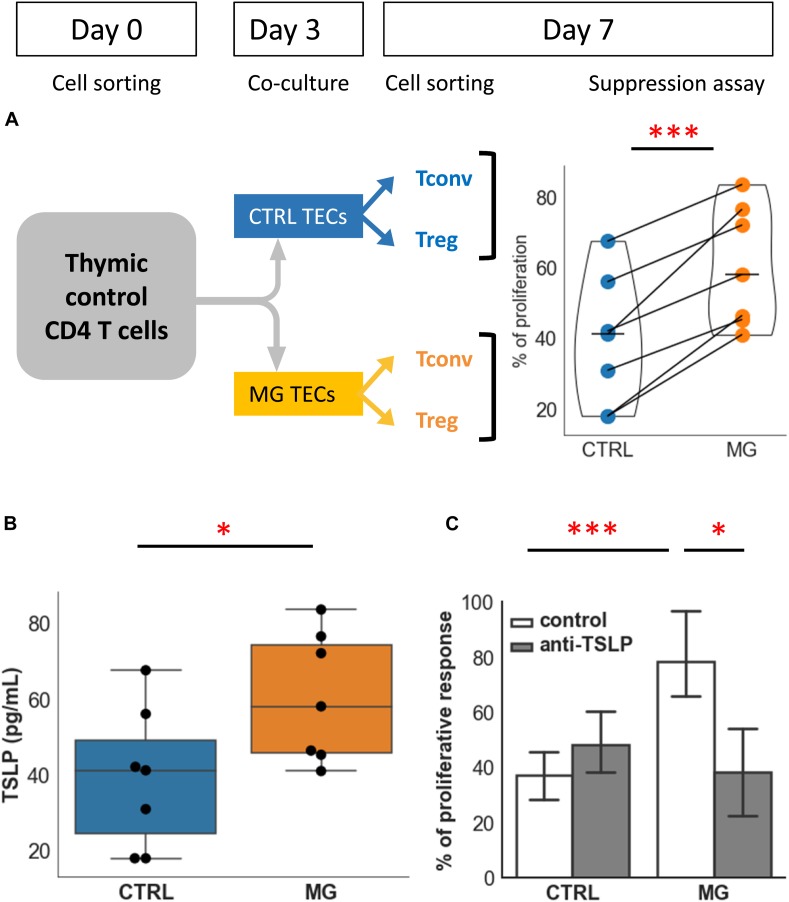
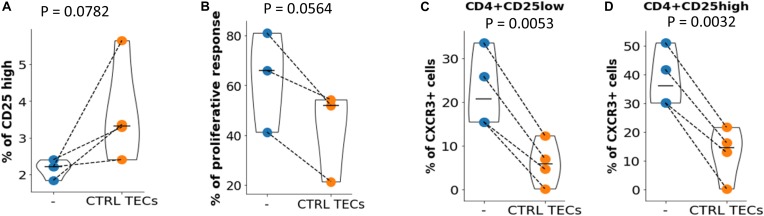
The thymus is involved in autoimmune Myasthenia gravis (MG) associated with anti-acetylcholine (AChR) antibodies. In MG, thymic regulatory T cells (Treg) are not efficiently suppressive, and conventional T cells (Tconv) are resistant to suppression. To better understand the specific role of the thymus in MG, we compared the phenotype and function of peripheral and thymic Treg and Tconv from controls and MG patients. Suppression assays with thymic or peripheral CD4 + T cells showed that the functional impairment in MG was more pronounced in the thymus than in the periphery. Phenotypic analysis of Treg showed a significant reduction of resting and effector Treg in the thymus but not in the periphery of MG patients. CD31, a marker lost with excessive immunoreactivity, was significantly reduced in thymic but not blood resting Treg. These results suggest that an altered thymic environment may explain Treg differences between MG patients and controls. Since thymic epithelial cells (TECs) play a major role in the generation of Treg, we co-cultured healthy thymic CD4 + T cells with control or MG TECs and tested their suppressive function. Co-culture with MG TECs consistently hampers regulatory activity, as compared with control TECs, suggesting that MG TECs contribute to the immune regulation defects of MG CD4 + T cells. MG TECs produced significantly higher thymic stromal lymphopoietin (TSLP) than control TECs, and a neutralizing anti-TSLP antibody partially restored the suppressive capacity of Treg derived from co-cultures with MG TECs, suggesting that TSLP contributed to the defect of thymic Treg in MG patients. Finally, a co-culture of MG CD4 + T cells with control TECs restored numbers and function of MG Treg, demonstrating that a favorable environment could correct the immune regulation defects of T cells in MG. Altogether, our data suggest that the severe defect of thymic Treg is at least partially due to MG TECs that overproduce TSLP. The Treg defects could be corrected by replacing dysfunctional TECs by healthy TECs. These findings highlight the role of the tissue environment on the immune regulation.

Keywords: CD31; PBMC; TSLP; Treg; immune regulation; myasthenia gravis; thymic epithelial cells; thymus.


Figures

FIGURE 1
FIGURE 1
The suppression function is more impaired in the thymus than in the periphery in MG patients. Percentages of proliferation of Tconv in co-culture with Treg (ratio 1:1) from control individuals (CTRL) or patients with myasthenia gravis (MG) using cells derived from the thymus (A) or from PBMCs (B). Data represent the mean ± standard error of the mean. Statistical test: Two-tailed t-test.
FIGURE 2
FIGURE 2
Phenotypic characterization of thymic and peripheral regulatory cells. (A) Percentages of indicated cell populations among total CD4 + T cells in healthy individuals (blue) or in myasthenic patients (orange) in the thymus (left panel) or in PBMCs (right panel). Mean fluorescent intensities of CD25 (B), FoxP3 (C), CD127 (D), CD31 (E) in healthy individuals (blue) or in myasthenic patients (orange) in the 3 subsets defined by the combination of CD45RA and CD25 in thymus (left panel) or in PBMCs (right panel). Statistical test: two-tailed Mann-Whitney (p ≤ 0.05; ∗∗p ≤ 0.01; and ∗∗∗p ≤ 0.005, gray star corresponds to p < 0.1). (F) Statistical summary of the data shown in (B–E). Colorized bubbles correspond to significant differences. Size is proportional to the statistical significance and color represents fold change between mean values of control individuals and MG patients (green, lower value in MG; red, higher value in MG).
FIGURE 3
FIGURE 3
Expression of CD95 and chemokine receptors in Treg subsets. Percentages of CD95hi (A) CXCR3 (B), CCR4 (C), CXCR5 (D), and CCR7 (E) according to CD25 expression, in healthy individuals (blue) or in myasthenic patients (orange) in the thymus (left panel) or in PBMCs (right panel). Statistical test: two-tailed Mann-Whitney (p ≤ 0.05; ∗∗p ≤ 0.01; and ∗∗∗p ≤ 0.005, gray star corresponds to p < 0.1). (F) Statistical summary of the data shown in this figure. Colorized bubbles correspond to significant differences. Size is proportional to the statistical significance and color represents fold change between mean values of control individuals and MG patients (green, lower value in MG; red, higher value in MG).
FIGURE 4
FIGURE 4
TECs contribute to the functional defect of Treg: role of TSLP. (A) Percentages of proliferation of T conv in co-culture with Treg following co-culture of CD4 + cells from control individuals with TECs either from control individuals (CTRL, blue) or from MG patients (MG, orange). The experimental protocol is explained in the top left panel. (B) Production of TSLP measured in supernatants of cultured TEC from control individuals (CTRL, blue) or MG patients (MG, orange). (C) Percentage of proliferation of Tconv in co-culture with Treg following co-culture with TEC from control individuals (CTRL) or MG patients as described in (A), in the absence or presence of a TSLP neutralizing antibody. Statistical tests: two tailed paired t-test in (A,C), two-tailed Mann-Whitney in (B) (p ≤ 0.05; ∗∗∗p ≤ 0.005).
FIGURE 5
FIGURE 5
Immune regulation in MG CD4 + cells could be restored. (A) Percentages of CD25 high cells in CD4 + T cells from MG patients before (–) or after (CTRL TECs) co-culture with TEC from control individuals. (B) Proliferation of Tconv in co-culture with Treg before (–) or after (CTRL TECs) co-culture of thymic CD4 + cells from MG patients with TEC from control individuals (CTRL, blue). Percentage of CXCR3 + cells among CD4 + CD25low (C) or CD4 + CD25high (D) thymic CD4 + cells from MG patients before (–) or after (CTRL TECs) co-culture with TECs from control individuals. Statistical tests: two-tailed paired t-test.

Similar articles

Cited by

References

    1. Gilhus NE, Tzartos S, Evoli A, Palace J, Burns TM, Verschuuren JJGM. Myasthenia gravis. Nat Rev Dis Prim. (2019) 5:30. 10.1038/s41572-019-0079-y - DOI - PubMed
    1. Berrih-Aknin S. Myasthenia gravis: paradox versus paradigm in autoimmunity. J Autoimmun. (2014) 52:1–28. 10.1016/j.jaut.2014.05.001 - DOI - PubMed
    1. Wolfe GI, Kaminski HJ, Aban IB, Minisman G, Kuo H-C, Marx A, et al. Randomized trial of thymectomy in Myasthenia gravis. N Engl J Med. (2016) 375:511–22. 10.1056/NEJMoa1602489 - DOI - PMC - PubMed
    1. Berrih-Aknin S, Le Panse R. Myasthenia gravis: a comprehensive review of immune dysregulation and etiological mechanisms. J Autoimmun. (2014) 52:90–100. 10.1016/j.jaut.2013.12.011 - DOI - PubMed
    1. Truffault F, de Montpreville V, Eymard B, Sharshar T, Le Panse R, Berrih-Aknin S. Thymic germinal centers and corticosteroids in Myasthenia gravis: an immunopathological study in 1035 cases and a critical review. Clin Rev Allergy Immunol. (2017) 52:108–24. 10.1007/s12016-016-8558-3 - DOI - PubMed

Publication types

MeSH terms