Clinical Trial
. 2020 May 6:11:823.
doi: 10.3389/fimmu.2020.00823. eCollection 2020.

HIVconsv Vaccines and Romidepsin in Early-Treated HIV-1-Infected Individuals: Safety, Immunogenicity and Effect on the Viral Reservoir (Study BCN02)

Affiliations
Clinical Trial

HIVconsv Vaccines and Romidepsin in Early-Treated HIV-1-Infected Individuals: Safety, Immunogenicity and Effect on the Viral Reservoir (Study BCN02)

Beatriz Mothe et al. Front Immunol. .

Abstract

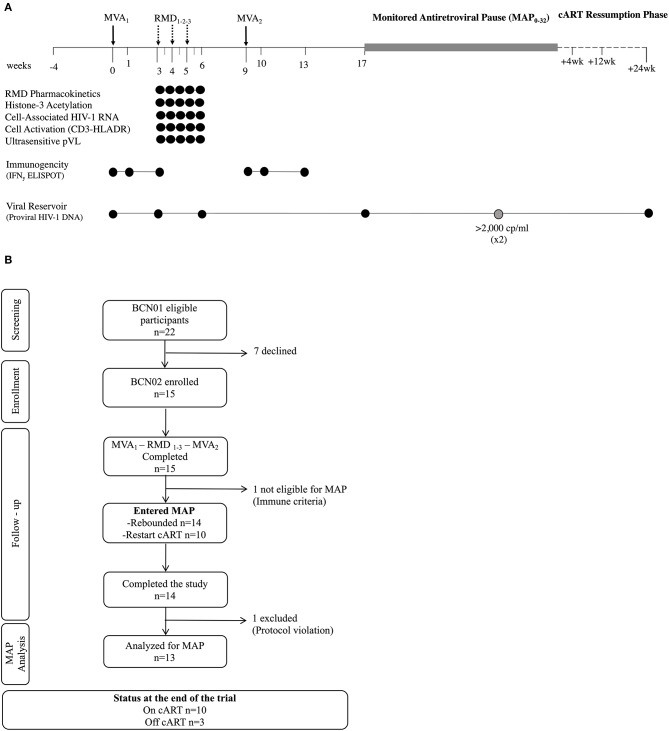
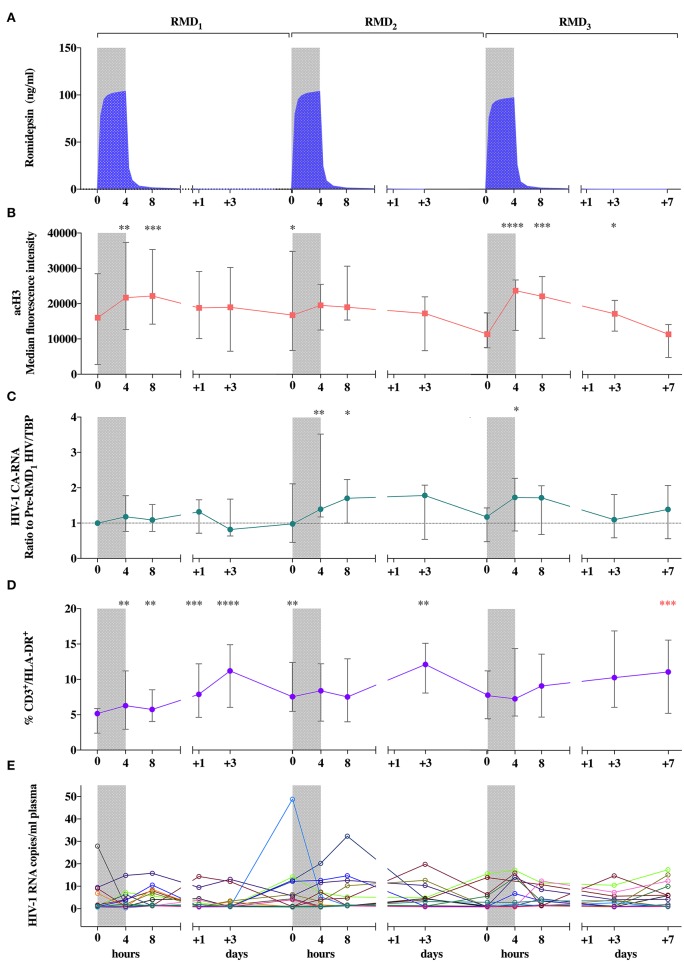
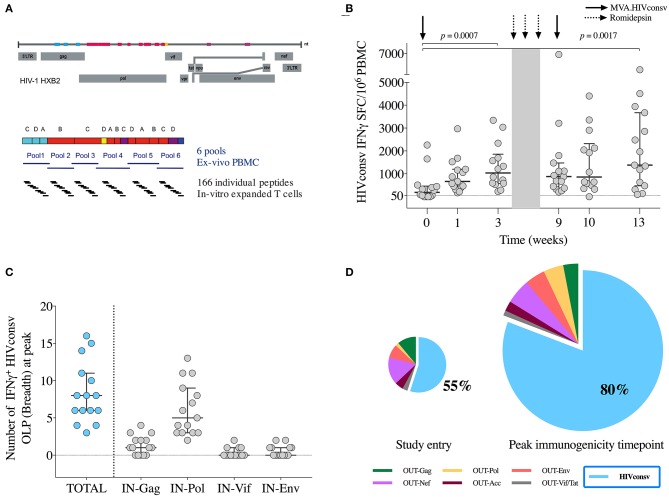
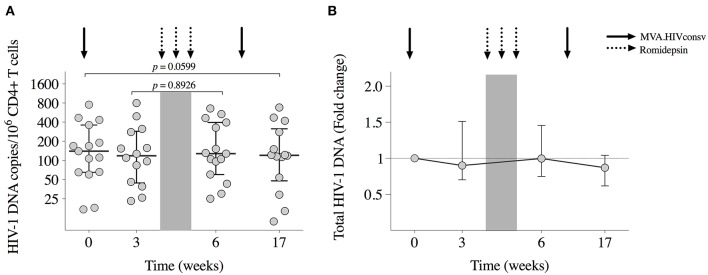
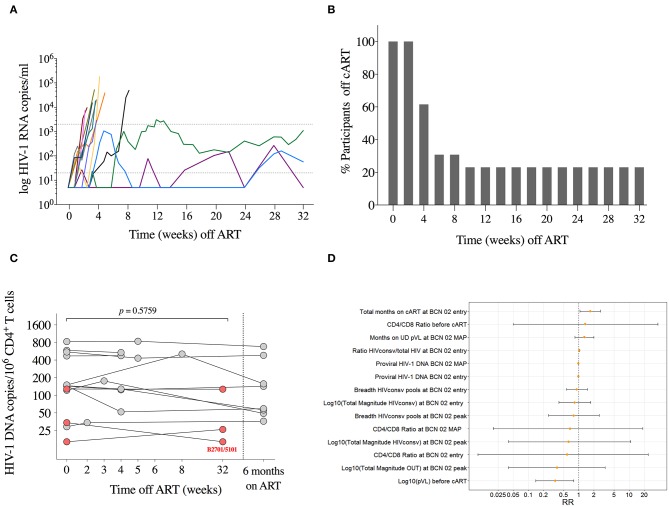
Kick&kill strategies combining drugs aiming to reactivate the viral reservoir with therapeutic vaccines to induce effective cytotoxic immune responses hold potential to achieve a functional cure for HIV-1 infection. Here, we report on an open-label, single-arm, phase I clinical trial, enrolling 15 early-treated HIV-1-infected individuals, testing the combination of the histone deacetylase inhibitor romidepsin as a latency-reversing agent and the MVA.HIVconsv vaccine. Romidepsin treatment resulted in increased histone acetylation, cell-associated HIV-1 RNA, and T-cell activation, which were associated with a marginally significant reduction of the viral reservoir. Vaccinations boosted robust and broad HIVconsv-specific T cells, which were strongly refocused toward conserved regions of the HIV-1 proteome. During a monitored ART interruption phase using plasma viral load over 2,000 copies/ml as a criterium for ART resumption, 23% of individuals showed sustained suppression of viremia up to 32 weeks without evidence for reseeding the viral reservoir. Results from this pilot study show that the combined kick&kill intervention was safe and suggest a role for this strategy in achieving an immune-driven durable viremic control.

Keywords: HDAC inhibitor; HIVconsv; early-treatment; kick&kill strategy; romidepsin.


Figures

Figure 1
Figure 1
Trial design. (A) Schematic study design. (B) Consolidated Standards of Reporting Trials (CONSORT) flow diagram for the trial. *Viral rebound during MAP was defined as pVL >20 copies/ml and #criteria for ART resumption included pVL over 2,000 copies/ml in two consecutive determinations, CD4+ cell counts decrease over 50% and/or below 500 cells/mm3 and/or development of clinical symptoms suggestive of an acute retroviral syndrome. MVA, MVA.HIVconsv vaccine; RMD, romidepsin; MAP, monitored antiretroviral pause; ART, antiretroviral therapy; pVL, plasma HIV-1 viral load.
Figure 2
Figure 2
Pharmacokinetic and pharmacodynamic effects of RMD. (A) Mean individual predictions of RMD plasma concentrations. (B) Levels of histone H3 acetylation in peripheral lymphocytes. (C) Viral transcription levels expressed as changes from pre-RMD1 levels of cell-associated HIV-1 RNA in peripheral CD4+ T-cells. (D) Levels of T-cell activation (CD3+/HLA-DR+ cells). (E) individual determinations of pVL. Median of frequencies and IQR (error bars) are represented. Wilcoxon signed-rank p-values compare each represented time point with the corresponding values preceding each RMD administration. *p < 0.05. **p < 0.01. ***p < 0.001 and ****p < 0.0001. The p value resulting from the comparison between the value at day 0 of RMD1 and 7 days after RMD3 is shown in red.
Figure 3
Figure 3
Vaccine immunogenicity. (A) Schematic representation of the selected regions in the HIV-1 proteome from different clades included in the HIVconsv immunogen and distribution of 6 peptide pools (P1-P6) and individual overlapping 15-mer peptides (OLP) used in the IFN-γ ELISPOT assays. (B) Magnitude (sum of SFU/106 PBMC to pools P1-P6) of vaccine-induced responses over the BCN02 study. Horizontal and error bars represent median and IQR, respectively, and p-values correspond to comparisons between the indicated time points using the Wilcoxon signed-rank test. (C) Breadth of vaccine-elicited responses toward individual OLP included in the indicated HIVconsv regions. Horizontal and error bars represent median and IQR, respectively. (D) Average distribution of total HIV-1 T-cells according to their specificity at the indicated time points. HIVconsv-specific responses are shown in blue. Pie charts are scaled according to the total frequencies of responses. IN are peptide pools corresponding to the HIVconsv vaccine insert and OUT peptide pools spanning the rest of HIV-1 proteome “outside the immunogen”.
Figure 4
Figure 4
Viral reservoir. (A) Total HIV-1 DNA copies/106 CD4+ T cells for each participant are shown at study entry (week 0), week 3 (day of RMD1), and week 6 (1 week after RMD3) and at week 17 (8 weeks after MVA2). Horizontal and error bars represent median and IQR, respectively, and p-values correspond to comparisons between the indicated time points using the Wilcoxon signed-rank test. (B) Changes in proviral DNA throughout the study with respect to baseline (week 0), which is considered to be 1.
Figure 5
Figure 5
Monitored antiretroviral pause. (A) Individual pVL during MAP is shown for each participant in different colors (n = 13). Lines are interrupted on day of ART resumption. Dotted lines represent detection limit and threshold for ART resumption (20 and 2,000 copies/ml, respectively). (B) Proportion of individuals remaining off ART during MAP. (C) Total HIV-1 DNA copies/106 CD4+ T cells are shown for each participant at MAP initiation, at day of ART ressumption, and 24 weeks after ART. P-value corresponds to comparison between MAP initiation and the day of ART resumption for each individual using the Wilcoxon signed-rank test. Individuals with sustained low-level viremia over 32 weeks are shown in red. (D) Estimated relative risks and 95% confidence intervals for the durable control of pVL during MAP obtained from univariate log-binomial regression models.

Similar articles

Cited by

References

    1. Bruner KM, Murray AJ, Pollack RA, Soliman MG, Laskey SB, Capoferri AA, et al. . Defective proviruses rapidly accumulate during acute HIV-1 infection. Nat Med. (2016) 22:1043–9. 10.1038/nm.4156 - DOI - PMC - PubMed
    1. Davey RT, Jr, Bhat N, Yoder C, Chun TW, Metcalf JA, Dewar RN, et al. . HIV-1 and T cell dynamics after interruption of highly active antiretroviral therapy (HAART) in patients with a history of sustained viral suppression. Proc Natl Acad Sci USA. (1999) 96:15109–14. 10.1073/pnas.96.26.15109 - DOI - PMC - PubMed
    1. Mothe B, Brander C. HIV T-cell vaccines. In: editors. Advances in Experimental Medicine and Biology, Vol. 1075. Springer: New York LLC; (2018). p. 31–51. 10.1007/978-981-13-0484-2_2 - DOI - PubMed
    1. Autran B, Murphy RL, Costagliola D, Tubiana R, Clotet B, Gatell J, et al. . Greater viral rebound and reduced time to resume antiretroviral therapy after therapeutic immunization with the ALVAC-HIV vaccine (vCP1452). AIDS. (2008) 22:1313–22. 10.1097/QAD.0b013e3282fdce94 - DOI - PubMed
    1. Schooley RT, Spritzler J, Wang H, Lederman MM, Havlir D, Kuritzkes DR, et al. . AIDS clinical trials group 5197: a placebo-controlled trial of immunization of HIV-1–infected persons with a replication-deficient adenovirus type 5 vaccine expressing the HIV-1 core protein. J Infect Dis. (2010) 202:705–16. 10.1086/655468 - DOI - PMC - PubMed

Publication types