

Amyloid accumulation in Down syndrome measured with amyloid load
- PMID: 32435686
- PMCID: PMC7233422
- DOI: 10.1002/dad2.12020
Amyloid accumulation in Down syndrome measured with amyloid load
Abstract
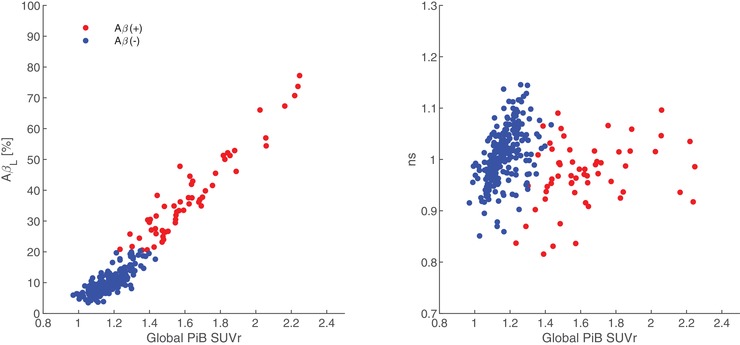
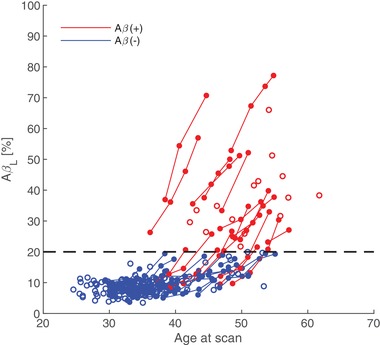
Introduction: Individuals with Down syndrome (DS) show enhanced amyloid beta (Aβ) deposition in the brain. A new positron emission tomography (PET) index of amyloid load (AβL ) was recently developed as an alternative to standardized uptake value ratios (SUVrs) to quantify Aβ burden with high sensitivity for detecting and tracking Aβ change.1.
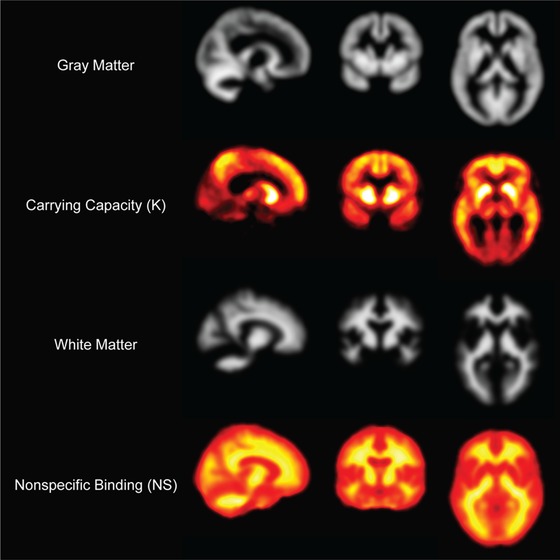
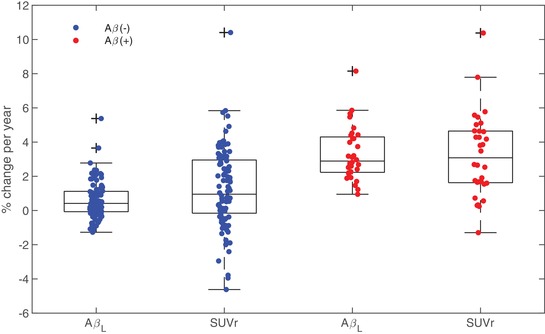
Methods: AβL was calculated in a DS cohort (N = 169, mean age ± SD = 39.6 ± 8.7 years) using [C-11]Pittsburgh compound B (PiB) PET imaging. DS-specific PiB templates were created for Aβ carrying capacity (K) and non-specific binding (NS).
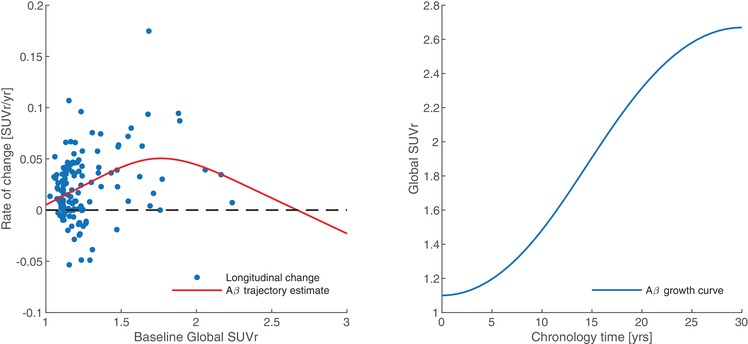
Results: The highest values of Aβ carrying capacity were found in the striatum and precuneus. Longitudinal changes in AβL displayed less variability when compared to SUVrs.
Discussion: These results highlight the utility of AβL for characterizing Aβ deposition in DS. Rates of Aβ accumulation in DS were found to be similar to that observed in late-onset Alzheimer's disease (AD; ≈3% to 4% per year), suggesting that AD progression in DS is of earlier onset but not accelerated.
Keywords: Alzheimer's disease; Down syndrome; PiB; amyloid PET; amyloid load; longitudinal.
© 2020 The Authors. Alzheimer's & Dementia: Diagnosis, Assessment & Disease Monitoring published by Wiley Periodicals, Inc. on behalf of the Alzheimer's Association.
Conflict of interest statement
The authors declare no conflicts of interest.
Figures
References
-
- Villemagne VL, Burnham S, Bourgeat P, et al. Amyloid β deposition, neurodegeneration, and cognitive decline in sporadic Alzheimer's disease: a prospective cohort study. Lancet Neurol. 2013;12(4):357‐367. - PubMed
-
- Schupf N. Genetic and host factors for dementia in Down's syndrome. Br J Psychiatry. 2002;180(5):405‐410. - PubMed
-
- Mann DMA. Alzheimer's disease and Down's syndrome. Histopathology. 1988;13:125‐137. - PubMed
-
- Wisniewski KE, Wisniewski HM, Wen GY. Occurrence of neuropathological changes and dementia of Alzheimer's disease in Down's syndrome. Ann Neurol. 1985;17:278‐282. - PubMed
Grants and funding
LinkOut - more resources
Full Text Sources
Miscellaneous