Meta-Analysis
. 2020 Jan-Dec:24:2331216520918416.
doi: 10.1177/2331216520918416.

Associations Between Subjective Tinnitus and Cognitive Performance: Systematic Review and Meta-Analyses

Affiliations
Meta-Analysis

Associations Between Subjective Tinnitus and Cognitive Performance: Systematic Review and Meta-Analyses

Nathan A Clarke et al. Trends Hear. 2020 Jan-Dec.

Abstract

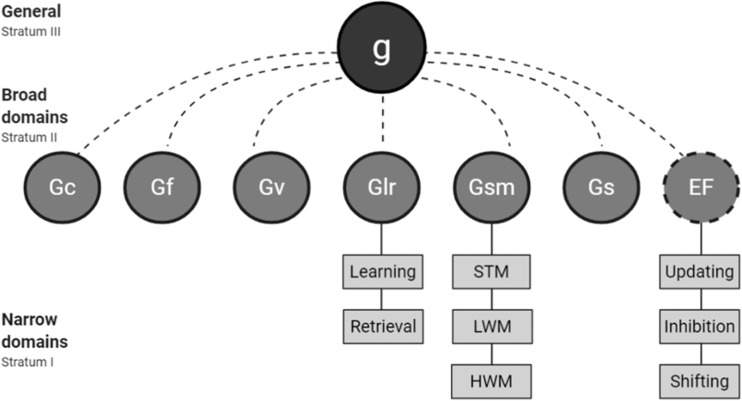
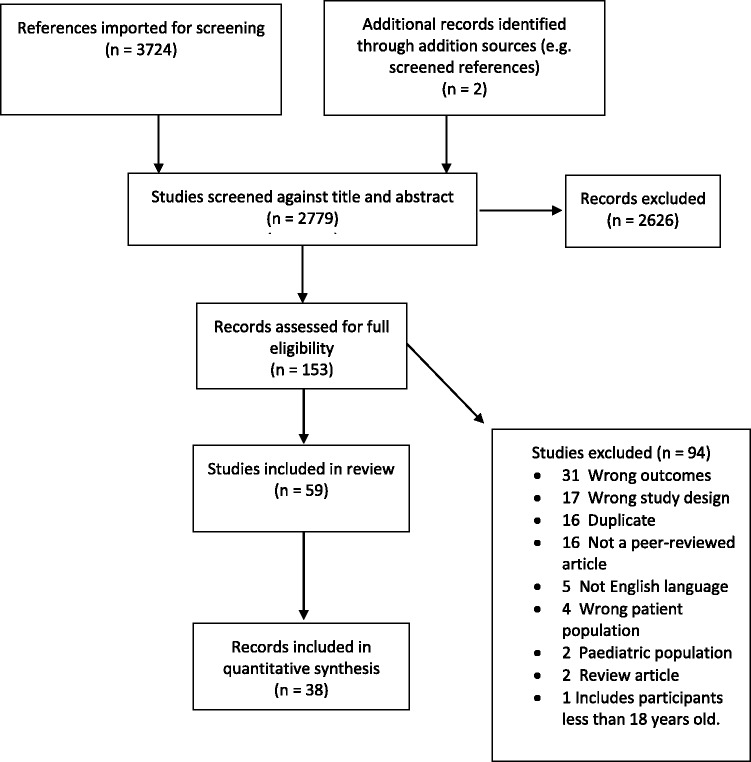
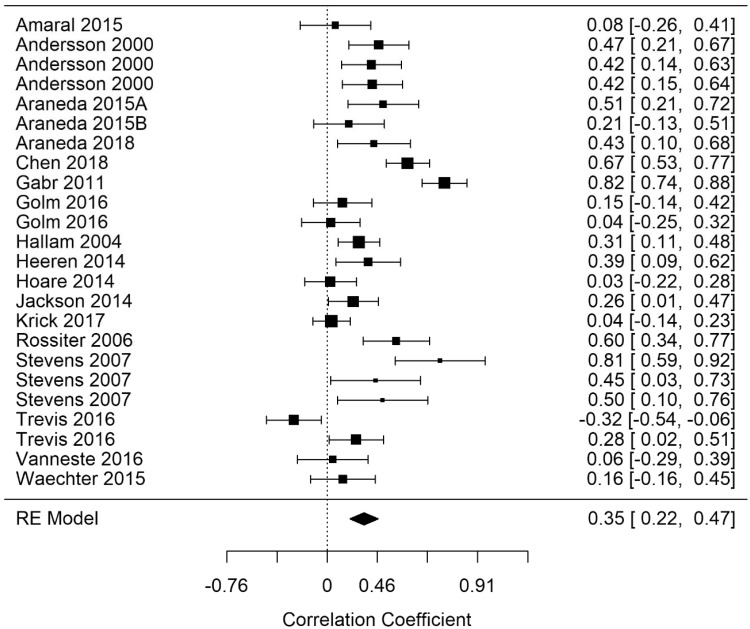
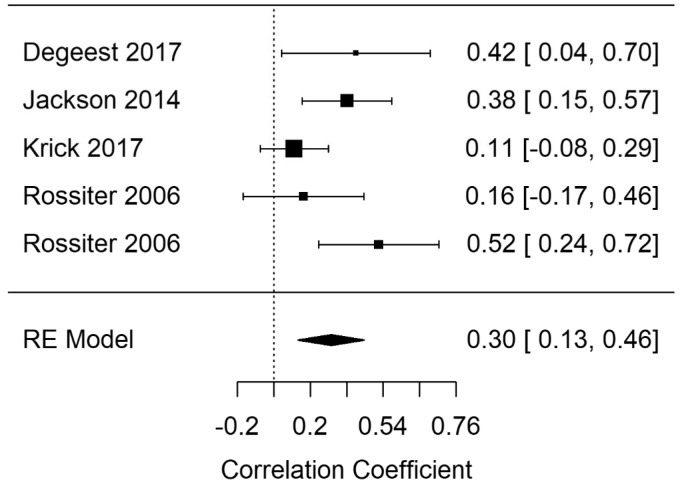
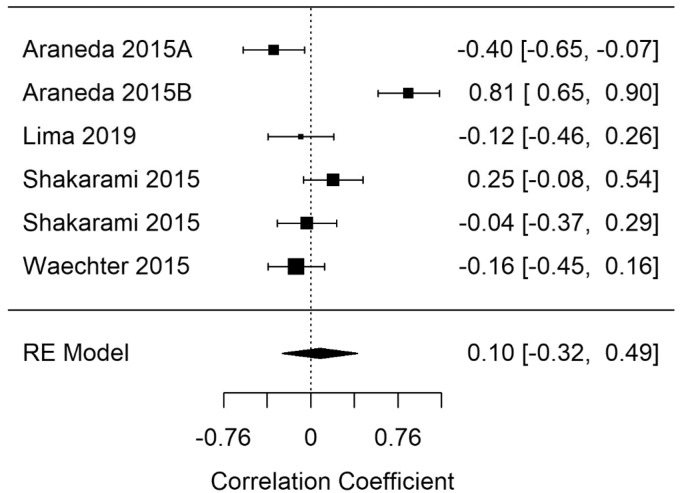
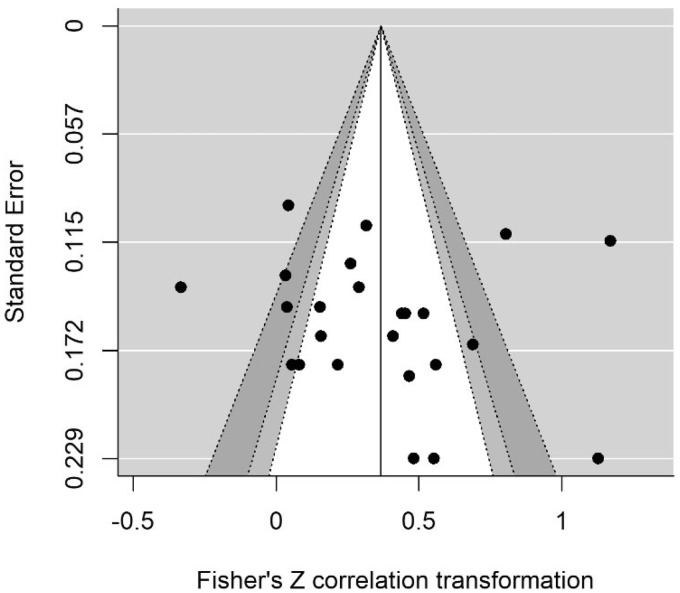
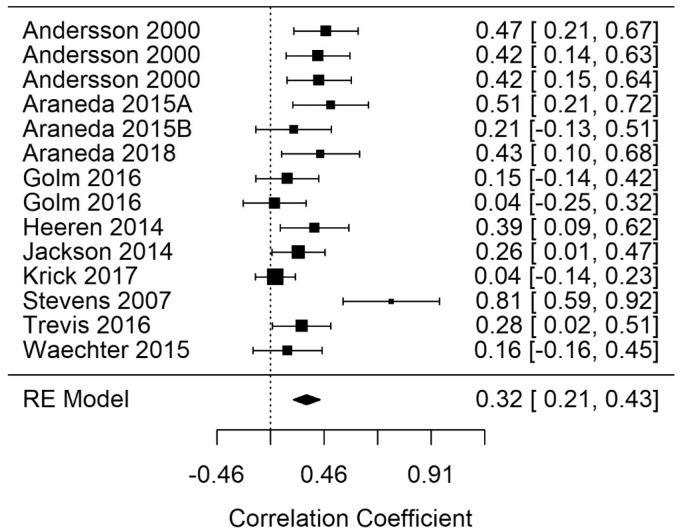
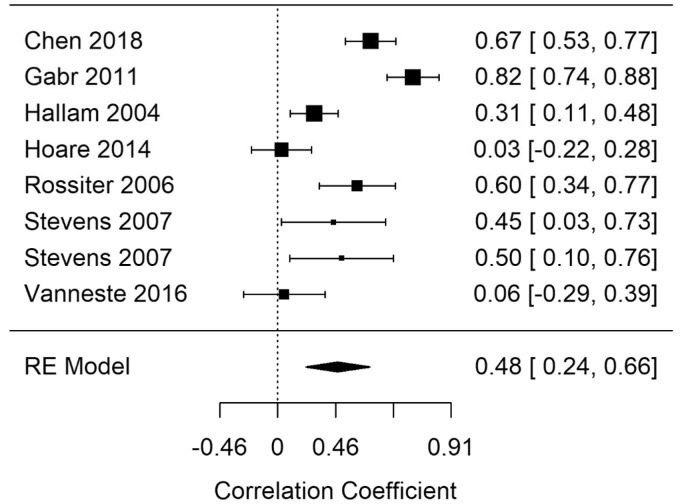
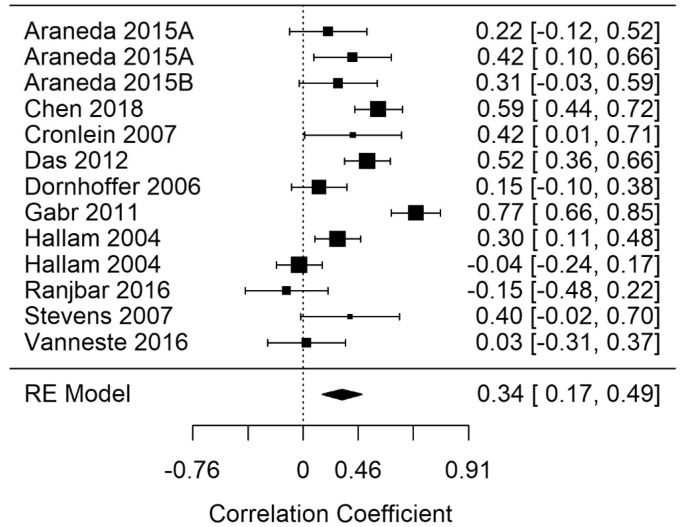
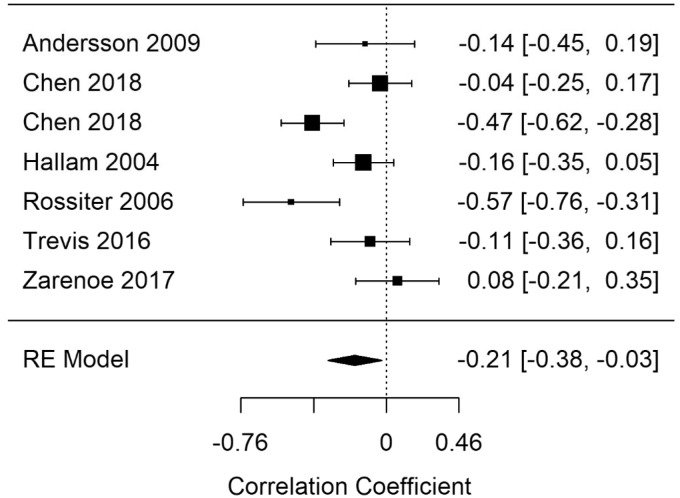
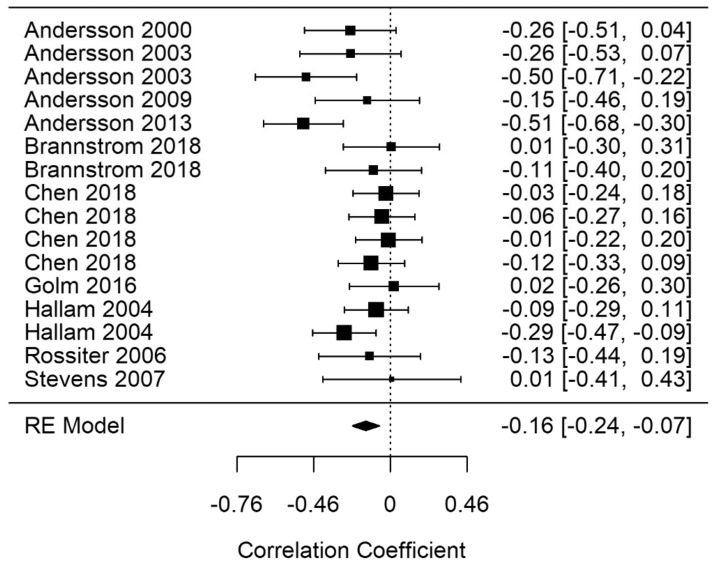
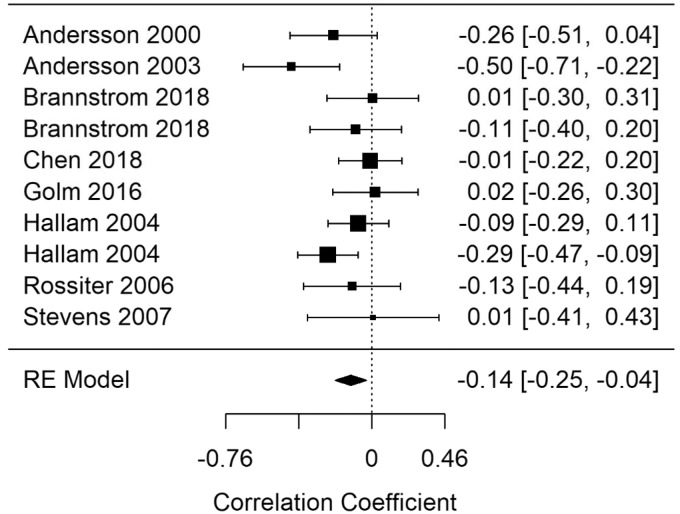
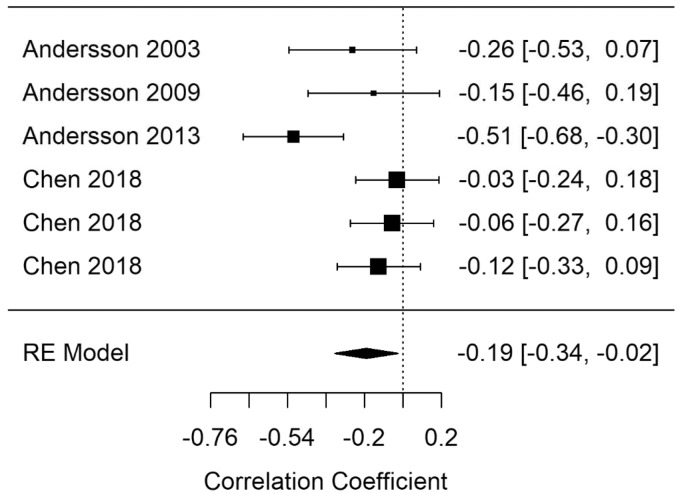
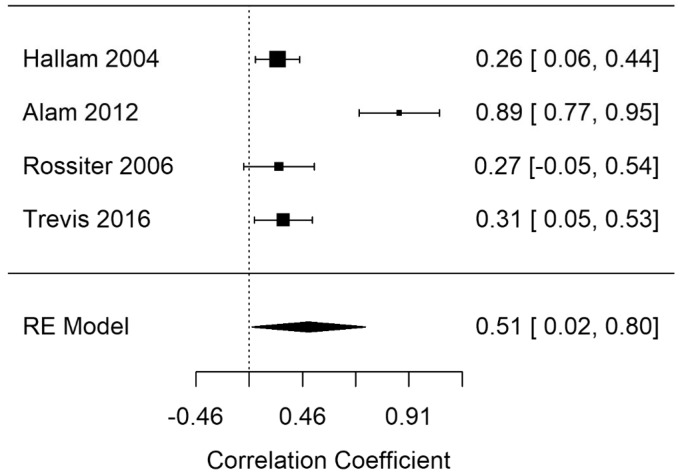
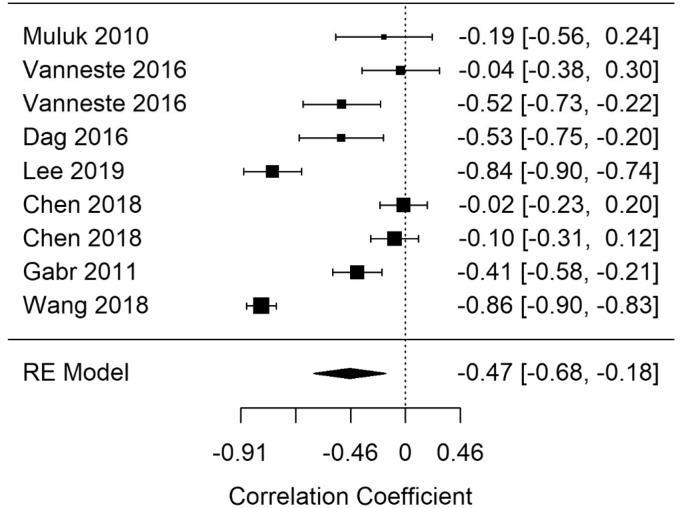
Tinnitus is the perception of sound in the absence of a corresponding external sound source, and bothersome tinnitus has been linked to poorer cognitive performance. This review comprehensively quantifies the association between tinnitus and different domains of cognitive performance. The review protocol was preregistered and published in a peer-reviewed journal. The review and analyses were reported according to Preferred Reporting Items for Systematic Review and Meta-analysis guidelines. Peer-reviewed literature was searched using electronic databases to find studies featuring participants with tinnitus who had undertaken measures of cognitive performance. Studies were assessed for quality and categorized according to an established cognitive framework. Random-effects meta-analyses were performed on various cognitive domains with potential moderator variables assessed where possible. Thirty-eight records were included in the analysis from a total of 1,863 participants. Analyses showed that tinnitus is associated with poorer executive function, processing speed, general short-term memory, and general learning and retrieval. Narrow cognitive domains of Inhibition and Shifting (within executive function) and learning and retrieval (within general learning and retrieval) were also associated with tinnitus.

Keywords: attention; cognition; cognitive performance; executive function; memory; tinnitus.


Figures

Figure 1.
Figure 1.
Hierarchical Representation of the CHC-M Composite Model (Adapted From Webb et al., 2018). g = general intelligence; Gf = fluid intelligence; Gc = crystallized intelligence; Gv = visual processing; Glr = long-term storage and retrieval; Gsm = general short-term memory; Gs = processing speed; EF = executive functions; STM = short-term memory; LWM = low-working memory; HWM = high-working memory. EF features a dotted outline to indicate its absence in the original CHC framework and subsequent addition by Webb et al. (2018) to create CHC-M.
Figure 2.
Figure 2.
Search and Screening Overview Preferred Reporting Items for Systematic Review and Meta-Analysis Flowchart.
Figure 3.
Figure 3.
Forest Plot Showing the Correlation Between Tinnitus and Response Times in Executive Functioning Tasks (EF-rt). Each study is represented by a point estimate bounded by a 95% CI, with the area of each square proportional the study’s weight within the model. Summary effect size is displayed as a polygon at the bottom of the plot, with the width of the polygon representing the 95% CI. RE = Random-effects.
Figure 4.
Figure 4.
Forest Plot Showing the Correlation Between Tinnitus and Error Rates in Executive Functioning Tasks (EF-error). Each study is represented by a point estimate bounded by a 95% CI, with the area of each square proportional the study’s weight within the model. Summary effect size is displayed as a polygon at the bottom of the plot, with the width of the polygon representing the 95% CI. RE = Random-effects.
Figure 5.
Figure 5.
Forest Plot Showing the Correlation Between Tinnitus and Correct Responses in Executive Functioning Tasks (EF-correct). Each study is represented by a point estimate bounded by a 95% CI, with the area of each square proportional the study’s weight within the model. Summary effect size is displayed as a polygon at the bottom of the plot, with the width of the polygon representing the 95% CI. RE = Random-effects.
Figure 6.
Figure 6.
Contour-Enhanced Funnel Plot for EF-rt Model. Individual study effect sizes are displayed on the x-axis, with their corresponding standard errors on the y-axis. The funnel lines are centered on the summary effect size, providing an indication of the spread. The unshaded region in the middle corresponds to p values greater than .10, the light gray shaded region corresponds to p values between .10 and .05, the dark gray region corresponds to p values between .05 and .01, and the region outside of the funnel corresponds to p values below .01.
Figure 7.
Figure 7.
Forest Plot Showing the Correlation Between Tinnitus and Response Times in Inhibition Tasks (Inhibition-rt). Each study is represented by a point estimate bounded by a 95% CI, with the area of each square proportional the study’s weight within the model. Summary effect size is displayed as a polygon at the bottom of the plot, with the width of the polygon representing the 95% CI. RE = Random-effects.
Figure 8.
Figure 8.
Forest Plot Showing the Correlation Between Tinnitus and Response Times in Shifting Tasks (Shifting-rt). Each study is represented by a point estimate bounded by a 95% CI, with the area of each square proportional the study’s weight within the model. Summary effect size is displayed as a polygon at the bottom of the plot, with the width of the polygon representing the 95% CI. RE = Random-effects.
Figure 9.
Figure 9.
Forest Plot Showing the Correlation Between Tinnitus and Response Times in Processing Speed Tasks (Gs-rt). Each study is represented by a point estimate bounded by a 95% CI, with the area of each square proportional the study’s weight within the model. Summary effect size is displayed as a polygon at the bottom of the plot, with the width of the polygon representing the 95% CI. RE = Random-effects.
Figure 10.
Figure 10.
Forest Plot Showing the Correlation Between Tinnitus and Correct Responses in General Short-Term Memory Tasks (Gsm-correct). Each study is represented by a point estimate bounded by a 95% CI, with the area of each square proportional the study’s weight within the model. Summary effect size is displayed as a polygon at the bottom of the plot, with the width of the polygon representing the 95% CI. RE = Random-effects.
Figure 11.
Figure 11.
Forest Plot Showing the Correlation Between Tinnitus and Correct Responses in General Learning and Retrieval Tasks (Glr-correct). Each study is represented by a point estimate bounded by a 95% CI, with the area of each square proportional the study’s weight within the model. Summary effect size is displayed as a polygon at the bottom of the plot, with the width of the polygon representing the 95% CI. RE = Random-effects.
Figure 12.
Figure 12.
Forest Plot Showing the Correlation Between Tinnitus and Correct Responses in General Learning Tasks (Glr-GL-correct). Each study is represented by a point estimate bounded by a 95% CI, with the area of each square proportional the study’s weight within the model. Summary effect size is displayed as a polygon at the bottom of the plot, with the width of the polygon representing the 95% CI. RE = Random-effects.
Figure 13.
Figure 13.
Forest Plot Showing the Correlation Between Tinnitus and Correct Responses in General Retrieval Tasks (Glr-GR-correct). Each study is represented by a point estimate bounded by a 95% CI, with the area of each square proportional the study’s weight within the model. Summary effect size is displayed as a polygon at the bottom of the plot, with the width of the polygon representing the 95% CI. RE = Random-effects.
Figure 14.
Figure 14.
Forest Plot Showing the Correlation Between Tinnitus and Cognitive Self-Report Measures (Self-report). Each study is represented by a point estimate bounded by a 95% CI, with the area of each square proportional the study’s weight within the model. Summary effect size is displayed as a polygon at the bottom of the plot, with the width of the polygon representing the 95% CI. RE = Random-effects.
Figure 15.
Figure 15.
Forest Plot Showing the Correlation Between Tinnitus and Cognitive Screening Measures. Each study is represented by a point estimate bounded by a 95% CI, with the area of each square proportional the study’s weight within the model. Summary effect size is displayed as a polygon at the bottom of the plot, with the width of the polygon representing the 95% CI. RE = Random-effects.

References

    1. Acrani I. O., Pereira L. D. (2010). Temporal resolution and selective attention of individuals with tinnitus. Pro-Fono, 22(3), 233–238. - PubMed
    1. Alam N., Katarkar A., Shah P., Jalvi R., Jain A., Shah M. (2012). Audiological, psychological and cognitive characteristics of tinnitus sufferers. Indian Journal of Otology, 18(1), 20 10.4103/0971-7749.98288 - DOI
    1. Amaral A. A., Langers D. R. M. (2015). Tinnitus-related abnormalities in visual and salience networks during a one-back task with distractors. Hear. Res., 326, 15–29. 10.1016/j.heares.2015.03.006 - DOI - PubMed
    1. Andersson G, Eriksson J., Lundh L. G., Lyttkens L. (2000). Tinnitus and cognitive interference: A stroop paradigm study. J. Speech Lang. Hear. Res., 43(5), 1168–1173. 10.1044/jslhr.4305.1168 - DOI - PubMed
    1. Andersson Gerhard, Edsjö L., Kaldo V., Westin V. (2009). Tinnitus and short-term serial recall in stable versus intermittent masking conditions. Scand. J. Psychol., 50(5), 517–522. 10.1111/j.1467-9450.2009.00752.x - DOI - PubMed

Publication types