CT findings of COVID-19 in follow-up: comparison between progression and recovery
- PMID: 32436847
- PMCID: PMC7360078
- DOI: 10.5152/dir.2019.20176
CT findings of COVID-19 in follow-up: comparison between progression and recovery
Abstract
Purpose: We aimed to retrospectively analyze the imaging changes detected in the follow-up of coronavirus disease 2019 (COVID-19) patients on thin-section computed tomography (CT).
Methods: We included 54 patients diagnosed with COVID-19. The mean interval between the initial and follow-up CT scans was 7.82±3.74 days. Patients were divided into progression and recovery groups according to their outcomes. We evaluated CT images in terms of distribution of lesions and imaging manifestations. The manifestations included ground-glass opacity (GGO), crazy-paving pattern, consolidation, irregular line, and air bronchogram sign.
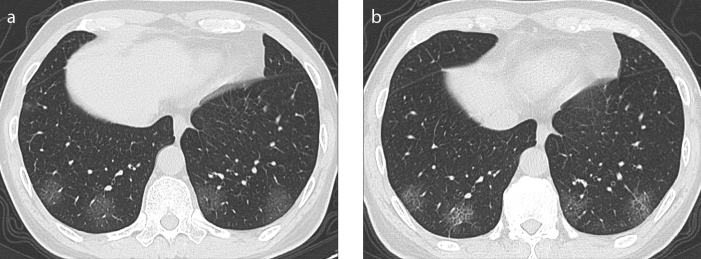
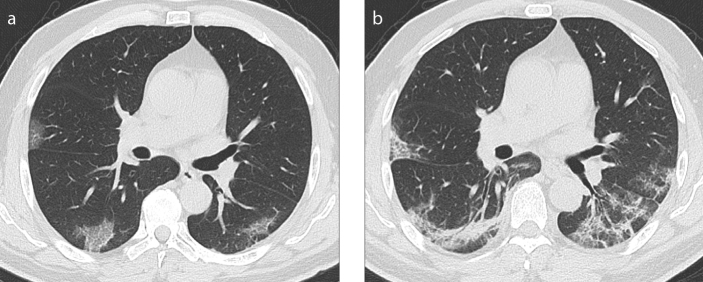
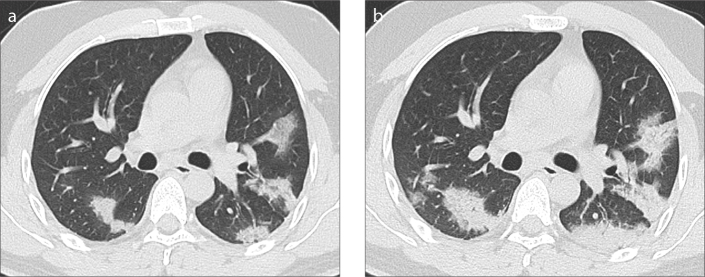
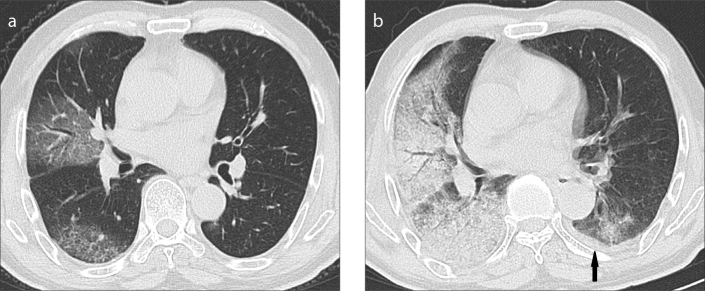
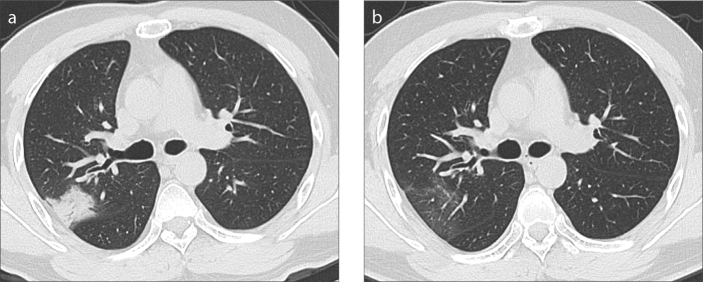
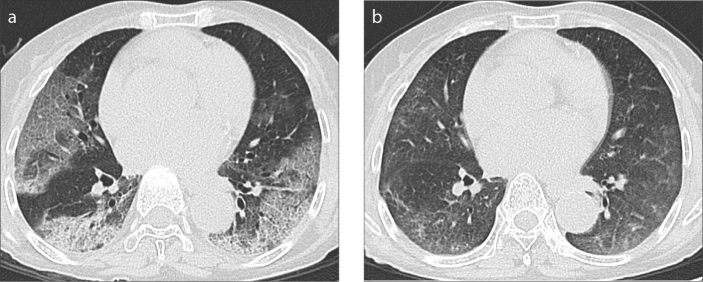
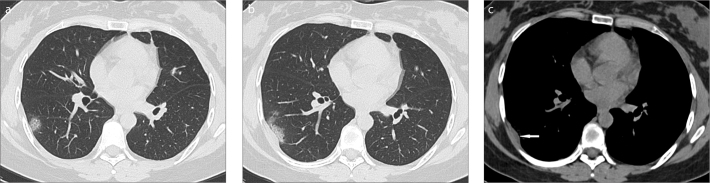
Results: COVID-19 lesions showed mainly subpleural distribution, which was accompanied by bronchovascular bundle distribution in nearly 30% of the patients. The lower lobes of both lungs were the most commonly involved. In the follow-up, the progression group showed more involvement of the upper lobe of the left lung than the recovery group. GGO was the most common sign. As the disease progressed, round GGO decreased and patchy GGO increased. On follow-up CT, consolidation increased in the progression group while decreasing in the recovery group. Air bronchogram sign was more commonly observed at the initial examination (90.9%) than at follow-up (30%) in the recovery group, but there was no significant change in the progression group. Pleural effusion and lymphadenopathy were absent in the initial examination, but pleural effusion was observed in three cases after follow-up.
Conclusion: As COVID-19 progressed, round GGOs tended to evolve into patchy GGOs, consolidation increased, and pleural effusion could be occasionally observed. As COVID-19 resolved, the crazy-paving pattern and air bronchogram significantly decreased.
Conflict of interest statement
The authors declared no conflicts of interest.
Figures
Similar articles
-
CT imaging features of COVID-19 pneumonia: initial experience from Turkey.Diagn Interv Radiol. 2020 Jul;26(4):308-314. doi: 10.5152/dir.2020.20307. Diagn Interv Radiol. 2020. PMID: 32558645 Free PMC article.
-
A Comparison of Clinical and Chest CT Findings in Patients With Influenza A (H1N1) Virus Infection and Coronavirus Disease (COVID-19).AJR Am J Roentgenol. 2020 Nov;215(5):1065-1071. doi: 10.2214/AJR.20.23214. Epub 2020 May 26. AJR Am J Roentgenol. 2020. PMID: 32452731
-
CT imaging features of 34 patients infected with COVID-19.Clin Imaging. 2020 Dec;68:226-231. doi: 10.1016/j.clinimag.2020.05.016. Epub 2020 May 16. Clin Imaging. 2020. PMID: 32425337 Free PMC article.
-
CT in coronavirus disease 2019 (COVID-19): a systematic review of chest CT findings in 4410 adult patients.Eur Radiol. 2020 Nov;30(11):6129-6138. doi: 10.1007/s00330-020-06975-7. Epub 2020 May 30. Eur Radiol. 2020. PMID: 32474632 Free PMC article.
-
Coronavirus Disease 2019 (COVID-19): A Systematic Review of Imaging Findings in 919 Patients.AJR Am J Roentgenol. 2020 Jul;215(1):87-93. doi: 10.2214/AJR.20.23034. Epub 2020 Mar 14. AJR Am J Roentgenol. 2020. PMID: 32174129
Cited by
-
Mediastinal lymphadenopathy in COVID-19: A review of literature.World J Clin Cases. 2021 Apr 26;9(12):2703-2710. doi: 10.12998/wjcc.v9.i12.2703. World J Clin Cases. 2021. PMID: 33969053 Free PMC article. Review.
-
Loculated Empyema and SARS-CoV-2 Infection: A Report of Two Cases and Review of the Literature.Eur J Case Rep Intern Med. 2021 Jul 15;8(7):002706. doi: 10.12890/2021_002706. eCollection 2021. Eur J Case Rep Intern Med. 2021. PMID: 34377699 Free PMC article.
-
A CT radiomics analysis of COVID-19-related ground-glass opacities and consolidation: Is it valuable in a differential diagnosis with other atypical pneumonias?PLoS One. 2021 Mar 10;16(3):e0246582. doi: 10.1371/journal.pone.0246582. eCollection 2021. PLoS One. 2021. PMID: 33690730 Free PMC article.
-
Rapid progression of COVID-19 pneumonia to extensive fibrosis assessed with 3D volumetric CT.Diagn Interv Radiol. 2021 Sep;27(5):692-693. doi: 10.5152/dir.2021.21105. Diagn Interv Radiol. 2021. PMID: 34318758 Free PMC article. No abstract available.
-
Management of pleural empyema in a 12-year-old obese patient with COVID-19: a pediatric case report.BMC Pediatr. 2021 Nov 30;21(1):531. doi: 10.1186/s12887-021-03007-1. BMC Pediatr. 2021. PMID: 34847919 Free PMC article.
References
-
- International Committee on Taxonomy of Viruses. [Accessed 11 February 2020]. Available at: https://talk.ictvonline.org/. Published 11 February 2020.
-
- World Health Organization. World experts and funders set priorities for COVID-19 research. [Accessed 11 February 2020]. Available at: https://www.who.int/news-room/detail/12-02-2020-world-experts-and-funder.... Published 11 February 2020.
-
- World Health Organization. Coronavirus disease (COVID-19) situation reports. [Accessed 21 April 2020]. Available at: https://www.who.int/emergencies/diseases/novel-coronavirus-2019/situatio.... Published 20 April 2020.
-
- National Health Commission of the People’s Republic of China. Consensus on Guidelines for the Publication of the Seventh Trail Version of the Diagnosis and Treatment Plan of the Novel Coronavirus. [Accessed 4 March 2020]. Available at: http://www.nhc.gov.cn/yzygj/s7653p/202003/46c9294a7dfe4cef80dc7f5912eb19.... Published 4 March 2020.
Publication types
MeSH terms
LinkOut - more resources
Full Text Sources
Medical
Research Materials