. 2020 Jun 1;130(6):2872-2887.
doi: 10.1172/JCI131842.

PLA2G1B is involved in CD4 anergy and CD4 lymphopenia in HIV-infected patients

Affiliations

PLA2G1B is involved in CD4 anergy and CD4 lymphopenia in HIV-infected patients

Julien Pothlichet et al. J Clin Invest. .

Abstract

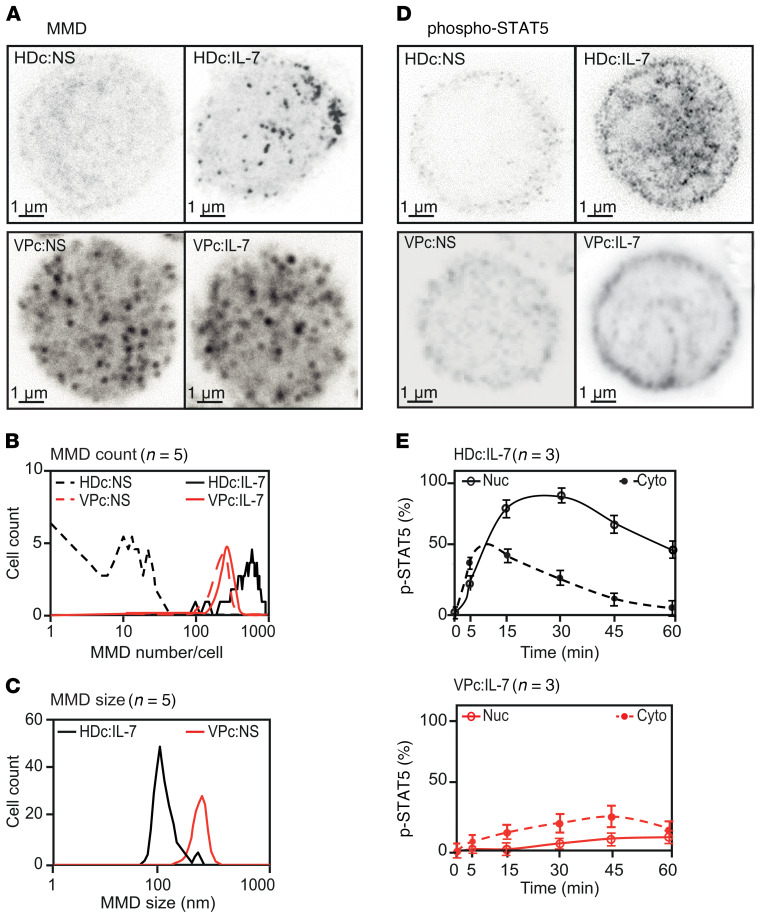
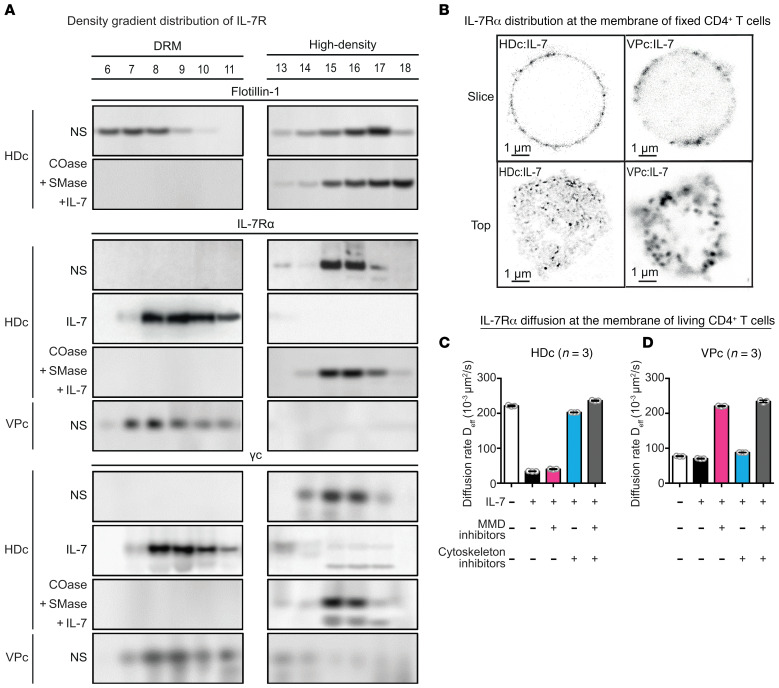
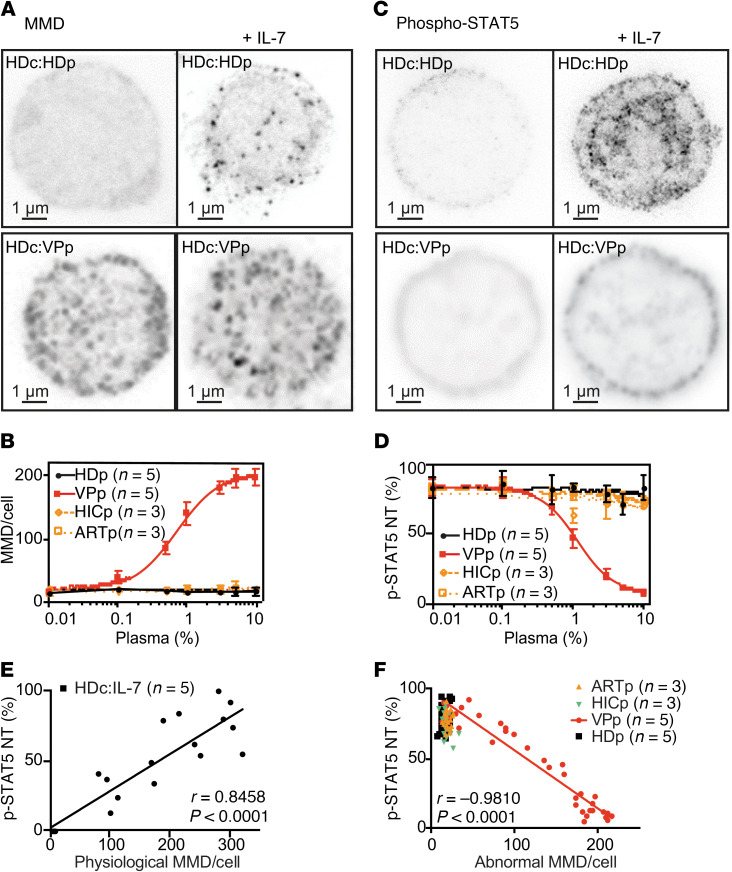
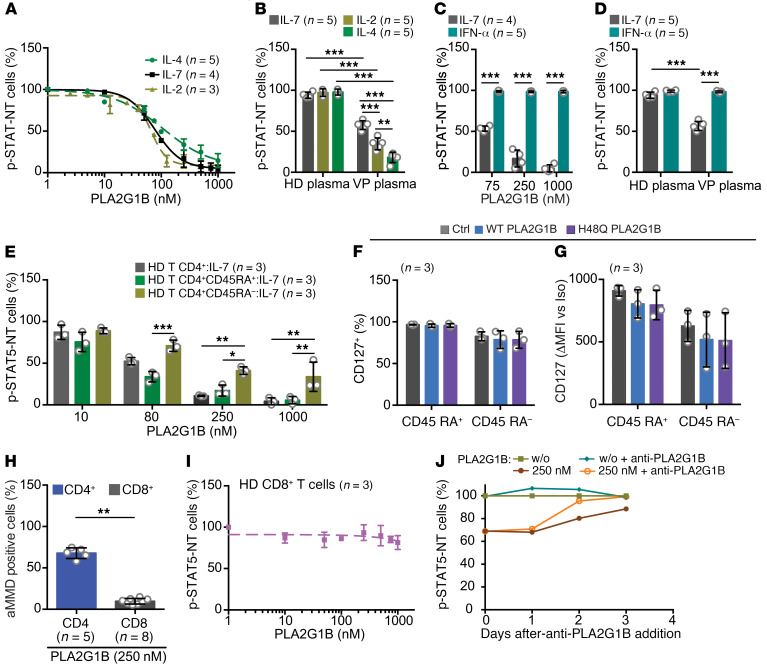
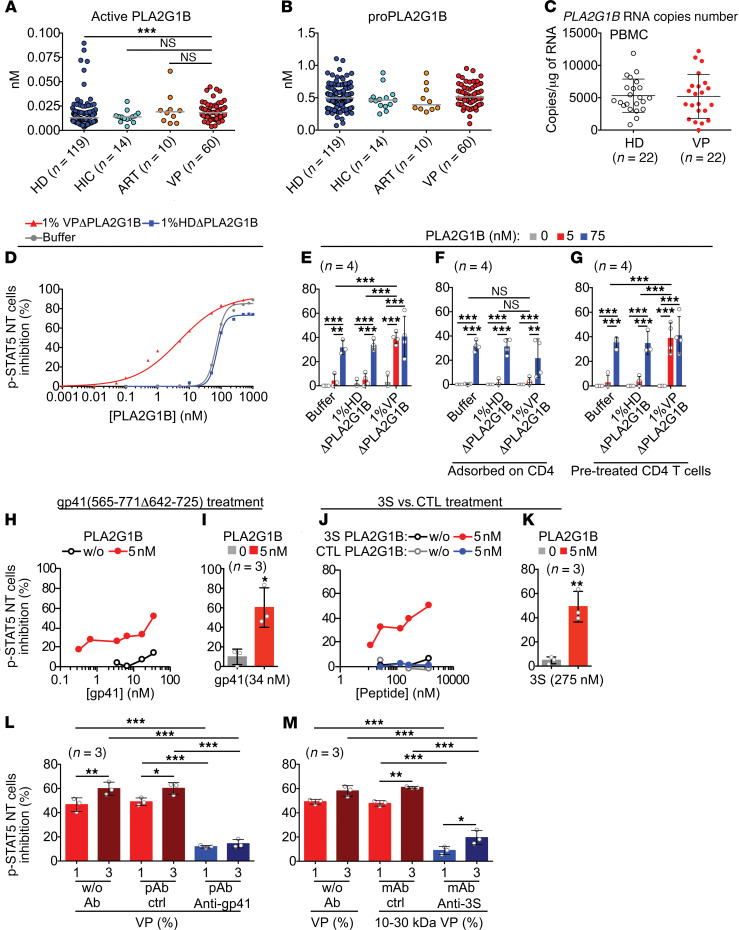
The precise mechanism leading to profound immunodeficiency of HIV-infected patients is still only partially understood. Here, we show that more than 80% of CD4+ T cells from HIV-infected patients have morphological abnormalities. Their membranes exhibited numerous large abnormal membrane microdomains (aMMDs), which trap and inactivate physiological receptors, such as that for IL-7. In patient plasma, we identified phospholipase A2 group IB (PLA2G1B) as the key molecule responsible for the formation of aMMDs. At physiological concentrations, PLA2G1B synergized with the HIV gp41 envelope protein, which appears to be a driver that targets PLA2G1B to the CD4+ T cell surface. The PLA2G1B/gp41 pair induced CD4+ T cell unresponsiveness (anergy). At high concentrations in vitro, PLA2G1B acted alone, independently of gp41, and inhibited the IL-2, IL-4, and IL-7 responses, as well as TCR-mediated activation and proliferation, of CD4+ T cells. PLA2G1B also decreased CD4+ T cell survival in vitro, likely playing a role in CD4 lymphopenia in conjunction with its induced IL-7 receptor defects. The effects on CD4+ T cell anergy could be blocked by a PLA2G1B-specific neutralizing mAb in vitro and in vivo. The PLA2G1B/gp41 pair constitutes what we believe is a new mechanism of immune dysfunction and a compelling target for boosting immune responses in HIV-infected patients.

Keywords: AIDS/HIV; Cytokines; Immunology; Lipid rafts; T cells.


Conflict of interest statement

Conflict of interest: JT is cofounder and CEO of DIACCURATE, a spin-off of the Institut Pasteur. JP, LJ, and AM are employees of DIACCURATE.

Figures

Figure 1
Figure 1. Characterization of Bumpy T cells from HIV-infected patients.
(A) MMD analysis by CW-STED microscopy. From top to bottom, purified HD CD4+ T cells (HDc) and VP CD4+ T cells (VPc). For each group, the top half of a representative nonstimulated (NS) CD4+ T cell, or after IL-7 stimulation, is shown from Z-stack images. (B) Quantification of MMDs on the surface of HD CD4+ cells (HDc) and VP CD4+ cells (VPc) before (NS) and after IL-7 stimulation. (C) Size of MMDs at the surface of IL-7–stimulated HD cells (HDc:IL-7) and VP cells before stimulation (VPc:NS). Lines represent the mean values. (D) Analysis of IL-7–induced phosphorylation and nuclear translocation of STAT5 by pulsed-STED microscopy (0.5 μm slices) in nonstimulated and IL-7–stimulated HD CD4+ T cells (top) or VP CD4+ T cells (bottom). In AD, an average of 50 cells from each HD and 15 to 50 cells from each VP (HIV RNA/mL = 49,144 ± 33,689) were examined from 5 donors in each group and representative images are shown in A and D. (E) The kinetics of p-STAT5 in the nucleus (Nuc) and cytoplasm (Cyto) of HD and VP CD4+ T cells after IL-7 stimulation was measured using ImageJ and represented as the mean ± SD for 3 donors.
Figure 2
Figure 2. Analysis of membrane domains and IL-7R distribution on the surface of HD and VP CD4+ T cells.
(A) Purified CD4+ T lymphocytes were lysed (0.5% Triton X-100) and the lysates loaded onto a 5% to 40% sucrose gradient. After 16 hours of centrifugation (280,000 g) at 4°C, 18 fractions were collected (no. 1 left = tube top = 5% sucrose; no. 18 right = tube bottom = 40% sucrose). Each fraction was analyzed by SDS-PAGE (2 gels). Flotillin-1 was used as a marker to indicate low-density fractions corresponding to DRMs. IL-7R α and γ chains were revealed by Western blotting. Results are shown for purified nonstimulated HD CD4+ T cells (HDc:NS), IL-7–stimulated HD CD4+ T cells (HDc:IL-7), or HD CD4+ T cells pretreated with cholesterol oxidase (COase: 31 μM, 25 minutes) and sphingomyelinase (SMase: 2.7 μM, 5 minutes), and IL-7–stimulated (HDc:COase+SMase/IL-7), as well as nonstimulated VP CD4+ T cells (VPc:NS) (n = 3 donors). (B) IL-7Rα chain localization at the membrane of CD4+ T cells from HDs and VPs was analyzed by CW-STED. Images of a section (slice) and the top view (top) of representative cells are shown among 50 cells per donor for HD (n = 3 donors) and 15 to 50 cells for VP CD4+ T cells (n = 3 donors). (C and D) The effect of cytoskeletal reorganization and MMD inhibition on IL-7R compartmentalization was evaluated by measuring the 2-dimensional effective diffusion rates (Deff) of the IL-7Rα chain by fluorescence correlation spectroscopy (FCS), as described in Tamarit et al. (34). Histograms represent the mean ± SD of the effective diffusion rate Deff in each condition at the surface of (C) HD (n = 3 donors) and (D) VP CD4+ T cells (n = 3 donors).
Figure 3
Figure 3. Induction of Bumpy CD4+ T cells by plasma from HIV-infected patients.
(A) CW-STED images of MMDs on HD CD4+ T cells treated with 10% HD plasma (HDc:HDp) or VP plasma (HDc:VPp) before and after IL-7 stimulation. (B) Dose effect of plasma from HD (HDp, n = 5), VP (VPp, n = 5, HIV RNA/mL = 49,144 ± 33,689), HIV-controllers (HICp, n = 3), and ART-treated donors (ARTp, n = 3) on the number of MMDs per HD CD4+ T cell. (C) Pulsed-STED images of p-STAT5 of HD CD4+ T cells pretreated with 10% plasma from HDs or VPs. (D) Plasma dose effects as in B on p-STAT5 NT in IL-7–treated HD CD4+ T cells. Data are represented as the mean ± SD. In AD, for each condition, an average of 50 HD CD4+ T cells were analyzed from 5 donors and representative images are shown in A and C. (E) Pearson’s correlation between the kinetics of p-STAT5 NT and the number of physiological MMDs throughout IL-7 activation of HD cells (up to 60 minutes). Linear regression for the mean of the 5 HD plasma samples is shown. (F) Pearson’s correlation between p-STAT5 NT and abnormal MMDs per HD CD4+ T cell treated with various amounts of HDp (n = 5), VPp (n = 5, HIV RNA/mL = 49,144 ± 33,689), HICp (n = 3), and ARTp (n = 3). Linear regression for the mean of the 5 VP plasma samples is shown.
Figure 4
Figure 4. Cloned plasma PLA2G1B induces the Bumpy T cell phenotype.
(A) Crystal structure of PLA2G1B (PDB: 6Q42). (B) PLA2G1B effect on MMD formation followed by STED (representative of 2 experiments at 250 nM and verified at 500 nM and 1 μM). (C) Dose effect of PLA2G1B on IL-7–induced p-STAT5 NT in HD purified CD4+ T cells after analysis of confocal images. Results are shown as the mean ± SD from 4 donors. (DG) The effects on aMMD formation (D and E) and p-STAT5 NT (F and G) in CD4+ T cells of 250 nM WT PLA2G1B were compared to those of the inactive mutant H48Q (D and F) and other PLA2s (PLA2GIIA, PLA2GIID, or PLA2GX) (E and G). Results are shown as the mean ± SD from 5 (DF) or 7 donors (G). (H) VP plasma (3%, from 5 donors) was depleted with anti-PLA2G1B, anti-PLA2GIIA, or anti-PLA2GIID rabbit polyclonal antibodies (100 μg/mL). The effect of depletion was analyzed by following p-STAT5 NT in IL-7–stimulated CD4+ T cells (n = 3 donors) incubated with depleted plasma. Results were normalized to the response obtained with HD plasma and are shown as the mean ± SD. (I) Effect of VP plasma treated with various doses of neutralizing anti-PLA2G1B mAb 14G9 on p-STAT5 NT in CD4+ T cells from 1 donor and the effect of 100 μg/mL of 14G9 mAb on p-STAT5 NT in CD4+ T cells from 5 donors. **P < 0.01; ***P < 0.001 by Mann-Whitney t test (D, F, and I) and by the Kruskal-Wallis test followed by the Mann-Whitney test with P values adjusted for multiple comparisons between groups (E and G) or 1-way ANOVA (H) with Tukey’s correction for multiple comparisons.
Figure 5
Figure 5. Effect of PLA2G1B on CD4+ T cell subpopulations, specificity, and reversion.
(A) Dose effect of PLA2G1B (IL-7, n = 4; IL-2, n = 3; IL-4, n = 5) and (B) of 1% HD plasma (IL-7, n = 4; IL-2 and IL-4, n = 3) and VP plasma (n = 5) on IL-2–, IL-4–, and IL-7–induced p-STAT NT in CD4+ T cells. (C) Effects of PLA2G1B (IL-7, n = 4; IFN-α, n = 5) and (D) plasma (HD [n = 4] or VP [n = 5], 1%) on IL-7–induced p-STAT5 NT and IFN-α–induced p-STAT1 NT in CD4+ T cells (n = 5 donors). (E) The effect of PLA2G1B (30 minutes) on IL-7–induced p-STAT5 NT was analyzed in total (HD T CD4+:IL-7), naive (HD T CD4+ CD45RA+:IL-7), and memory (HD T CD4+ CD45RA:IL-7) CD4+ T cells from the same donor in response to IL-7 (n = 3 donors). (F) Percentage of CD127+ cells among and (G) CD127 expression (Δ anti-CD127 MFI minus isotype control MFI) on CD45RA+ and CD45RA CD4+ T cells after treatment with 1 μM WT or H48Q PLA2G1B (see gating strategy in Supplemental Figure 3A, n = 3 donors). (H) Effect of PLA2G1B (250 nM) on aMMD induction in CD4+ T cells (n = 5) and CD8+ T cells (n = 8) and (I) on IL-7–induced p-STAT5 NT in CD8+ T cells (dose effect, n = 3). In AI, results are shown as the mean ± SD. *P < 0.05; **P < 0.01; ***P < 0.001 by 1-way ANOVA (BD) and 2-way ANOVA (E) with Tukey’s correction for multiple comparisons or by the Mann-Whitney 2-tailed unpaired t test (H). (J) Anti-PLA2G1B treatment accelerates the recovery of a functional p-STAT5 NT response of PLA2G1B-treated CD4+ T cells to IL-7. The results of 1 representative experiment of 3 are presented.
Figure 6
Figure 6. PLA2G1B acts on dying CD4+ T cells and reduces CD4+ T cell survival.
(A and B) PLA2G1B reduces the survival of human CD4+ T cells. (A) Cells were treated with PBS (Ctrl) or various amounts of PLA2G1B (1, 10, 100 μM) for 1 experiment. Results are shown as the percentage of CD4+ T cell counts normalized to the number of Ctrl cells at each time point. (B) Cells were treated with PBS (Ctrl) or 250 nM PLA2G1B (n = 6 donors). Results are shown as the mean ± SD of the percentage of CD4+ T cell counts normalized to the number of Ctrl cells at each time point. (A and B) The lines show the linear regression and the P values indicate the significance of the difference from control. (CE) PLA2G1B acts on dying CD4+ T cells and digests phosphatidylserine. FACS analysis of CD4+ T cells for annexin V–APC on Live/Dead marker (Zombie-Violet) positive cells after treatment with (C) 250 nM PLA2G1B WT or H48Q or (D) 250 nM PLA2G1B with anti-PLA2G1B (14G9) or not (without Ab). (C and D) Annexin V–APC labeling (MFI) at various time points after treatment are presented (1 representative experiment of 2 in C and 3 in D is presented). (E) Results are shown as the mean ± SD of the percentage of annexin V–negative Zombie-positive CD4+ T cells after treatment with PBS (Ctrl), PLA2G1B alone (without Ab), or anti-PLA2G1B (14G9) (n = 3 donors). (F) Anti-PLA2G1B treatment inhibits the effect of PLA2G1B on the survival of CD4+ T cells. Results are shown as the mean ± SD of the percentage of CD4+ T cell counts normalized to the number of Ctrl cells at each time point (n = 3 donors). Lines show the linear regression and P values indicate the significance of the difference between experimental conditions. ***P < 0.001.
Figure 7
Figure 7. Immunological effects of hPLA2G1B on mouse CD4+ T cells in vitro and in vivo.
(AG) FACS analysis of the effect of hPLA2G1B on mouse CD4+ T cells after anti-CD3/CD28 and IL-2 stimulation (5 days, see gating strategy on Supplemental Figure 6C). (AE) mCD4+ T cells were pretreated with WT or H48Q hPLA2G1B. (A) CD25 expression after treatment with 125 nM hPLA2G1B. (B) CD25 expression (MFI) and (C) cell survival (n = 3, 10 mice). (D) mCD4+ T cell proliferation profile after treatment with 125 nM hPLA2G1B. (E) Percentage of live mCD4+ T cells per cell generation (Go to G5; n = 3, 9 mice). (F and G) Effects of mAb anti-PLA2G1B 14G9 in vitro treatment on 125 nM hPLA2G1B action on CD4+ T cell survival and CD25 expression (n = 4, 11 mice). (HL) In vivo effects of hPLA2G1B on CD4+ T cell response to IL-7. Spleen CD4+ T cells were isolated after intraperitoneal injection into C57BL/6 mice and the ex vivo p-STAT5 NT response to IL-7 was evaluated by confocal microscopy, with an average of 200 cells examined for each condition. Effect of hPLA2G1B injection at several doses of PLA2G1B for 3 hours (H, 6 mice, 2 experiments) and at several times after injection (I, 3 mice, 1 experiment; J, 8 mice, 2 experiments). (K) Effects of mAb anti-hPLA2G1B 14G9 injected in vivo on the hPLA2G1B (100 μg, 3 hours) response (5 mice, 1 experiment). (L) Inhibition of the effects of hPLA2G1B after injection into hPLA2G1B/BSA–immunized mice (5 mice, 1 experiment). Results are shown as the mean ± SEM (B, C, and EG) or mean ± SD (HL). *P < 0.05; **P < 0.01; ***P < 0.001 adjusted for multiple comparisons by Kruskal-Wallis test P < 0.001, followed by the Mann-Whitney test (B) and 2-way ANOVA with correction for multiple comparisons by Tukey’s (C, H, and JL), Dunnett’s for the condition without PLA2G1B as a control group (E), or Sidak’s (F, G, and I) post hoc test.
Figure 8
Figure 8. Synergy between PLA2G1B activity and gp41.
(A and B) ELISA quantification of PLA2G1B in plasma from HD, VP, HIV-controllers (HIC), and ART-treated donors (ART) (median is shown). The Kruskal-Wallis test P value was 0.0025 in A, and then multiple comparisons were performed using the Mann-Whitney test. ***P < 0.001. (C) Level of PLA2G1B RNA in PBMCs from HDs and VPs. Results are shown as the mean ± SD of the number of copies of PLA2G1B/μg of total RNA. (D) Inhibitory activity of PLA2G1B diluted in PBS or plasma from HDs or VPs previously depleted (Δ) of endogenous PLA2G1B (P < 0.0001, nonlinear regression in VP plasma relative to HD plasma or buffer). (E) The same experiment as in D with 1% plasma and 5 or 75 nM PLA2G1B. (F) VP plasma previously adsorbed on CD4+ T cells. Adsorbed plasma or buffer was collected and used to treat other CD4+ T cells together with PLA2G1B or not. (G) PLA2G1B activity on VP plasma–pretreated CD4+ T cells. CD4+ T cells were pretreated with plasma or buffer, and then plasma or buffer was removed and PLA2G1B was added, or not, to the pretreated CD4+ T cells. (HK) PLA2G1B inhibitory activity in the presence of the gp41 fragment 565–771Δ642–725 (H and I) or 3S or control (CTL) peptides (J and K). (L and M) Inhibitory activity of 1% or 3% VP plasma depleted with anti-gp41 (gp41) polyclonal antibody (pAb) (L) or anti–gp41 3S monoclonal antibody (anti-3S) (M), control (ctrl) or not depleted (without Ab) on CD4+ T cells. D, H, and J show 1 representative dose-response experiment among 2 to 3. In EG, I, and KM, results are shown as the mean ± SD of the percentage of p-STAT5 NT cells inhibition on 3 or 4 donors, as indicated. *P < 0.05; **P < 0.01; ***P < 0.001 by 2-tailed unpaired t test (I and K) or by ANOVA with Tukey’s correction for multiple comparisons (EG, L, and M).

References

    1. Walker B, McMichael A. The T-cell response to HIV. Cold Spring Harb Perspect Med. 2012;2(11):a007054. - PMC - PubMed
    1. Klatt NR, Chomont N, Douek DC, Deeks SG. Immune activation and HIV persistence: implications for curative approaches to HIV infection. Immunol Rev. 2013;254(1):326–342. doi: 10.1111/imr.12065. - DOI - PMC - PubMed
    1. Pitman MC, Lau JSY, McMahon JH, Lewin SR. Barriers and strategies to achieve a cure for HIV. Lancet HIV. 2018;5(6):e317–e328. doi: 10.1016/S2352-3018(18)30039-0. - DOI - PMC - PubMed
    1. Doitsh G, et al. Cell death by pyroptosis drives CD4 T-cell depletion in HIV-1 infection. Nature. 2014;505(7484):509–514. doi: 10.1038/nature12940. - DOI - PMC - PubMed
    1. Doitsh G, Greene WC. Dissecting how CD4 T cells are lost during HIV infection. Cell Host Microbe. 2016;19(3):280–291. doi: 10.1016/j.chom.2016.02.012. - DOI - PMC - PubMed

Publication types