

Abortion Access in Ohio's Changing Legislative Context, 2010-2018
- PMID: 32437269
- PMCID: PMC7349452
- DOI: 10.2105/AJPH.2020.305706
Abortion Access in Ohio's Changing Legislative Context, 2010-2018
Abstract
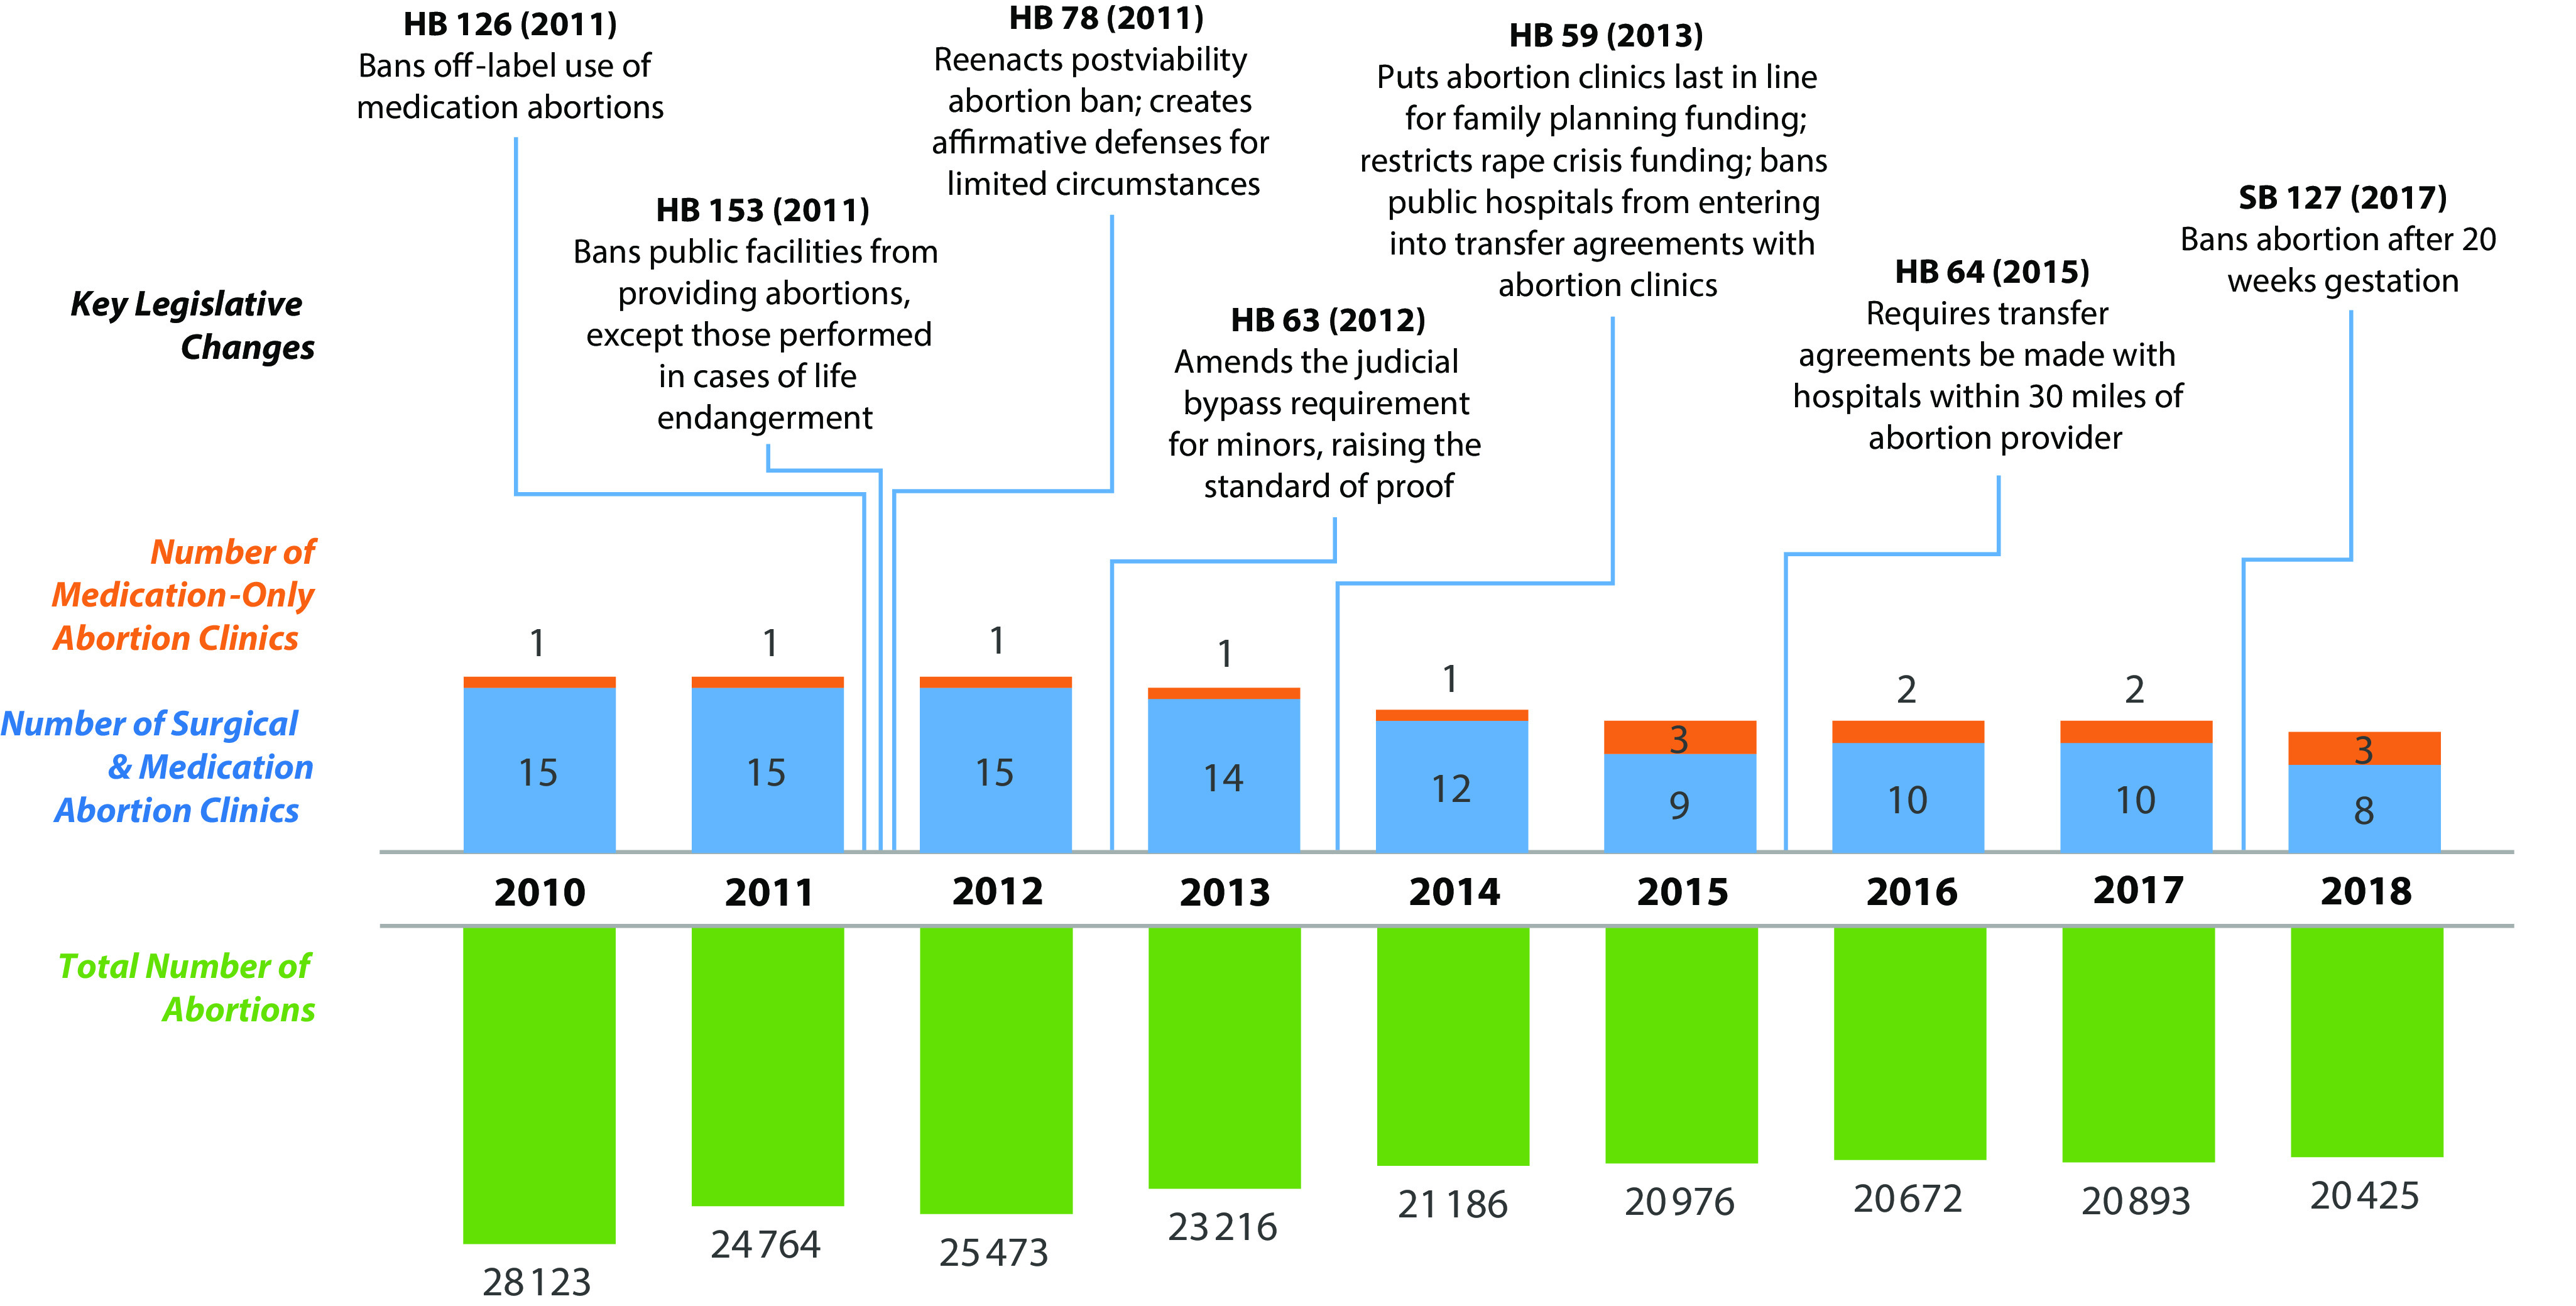
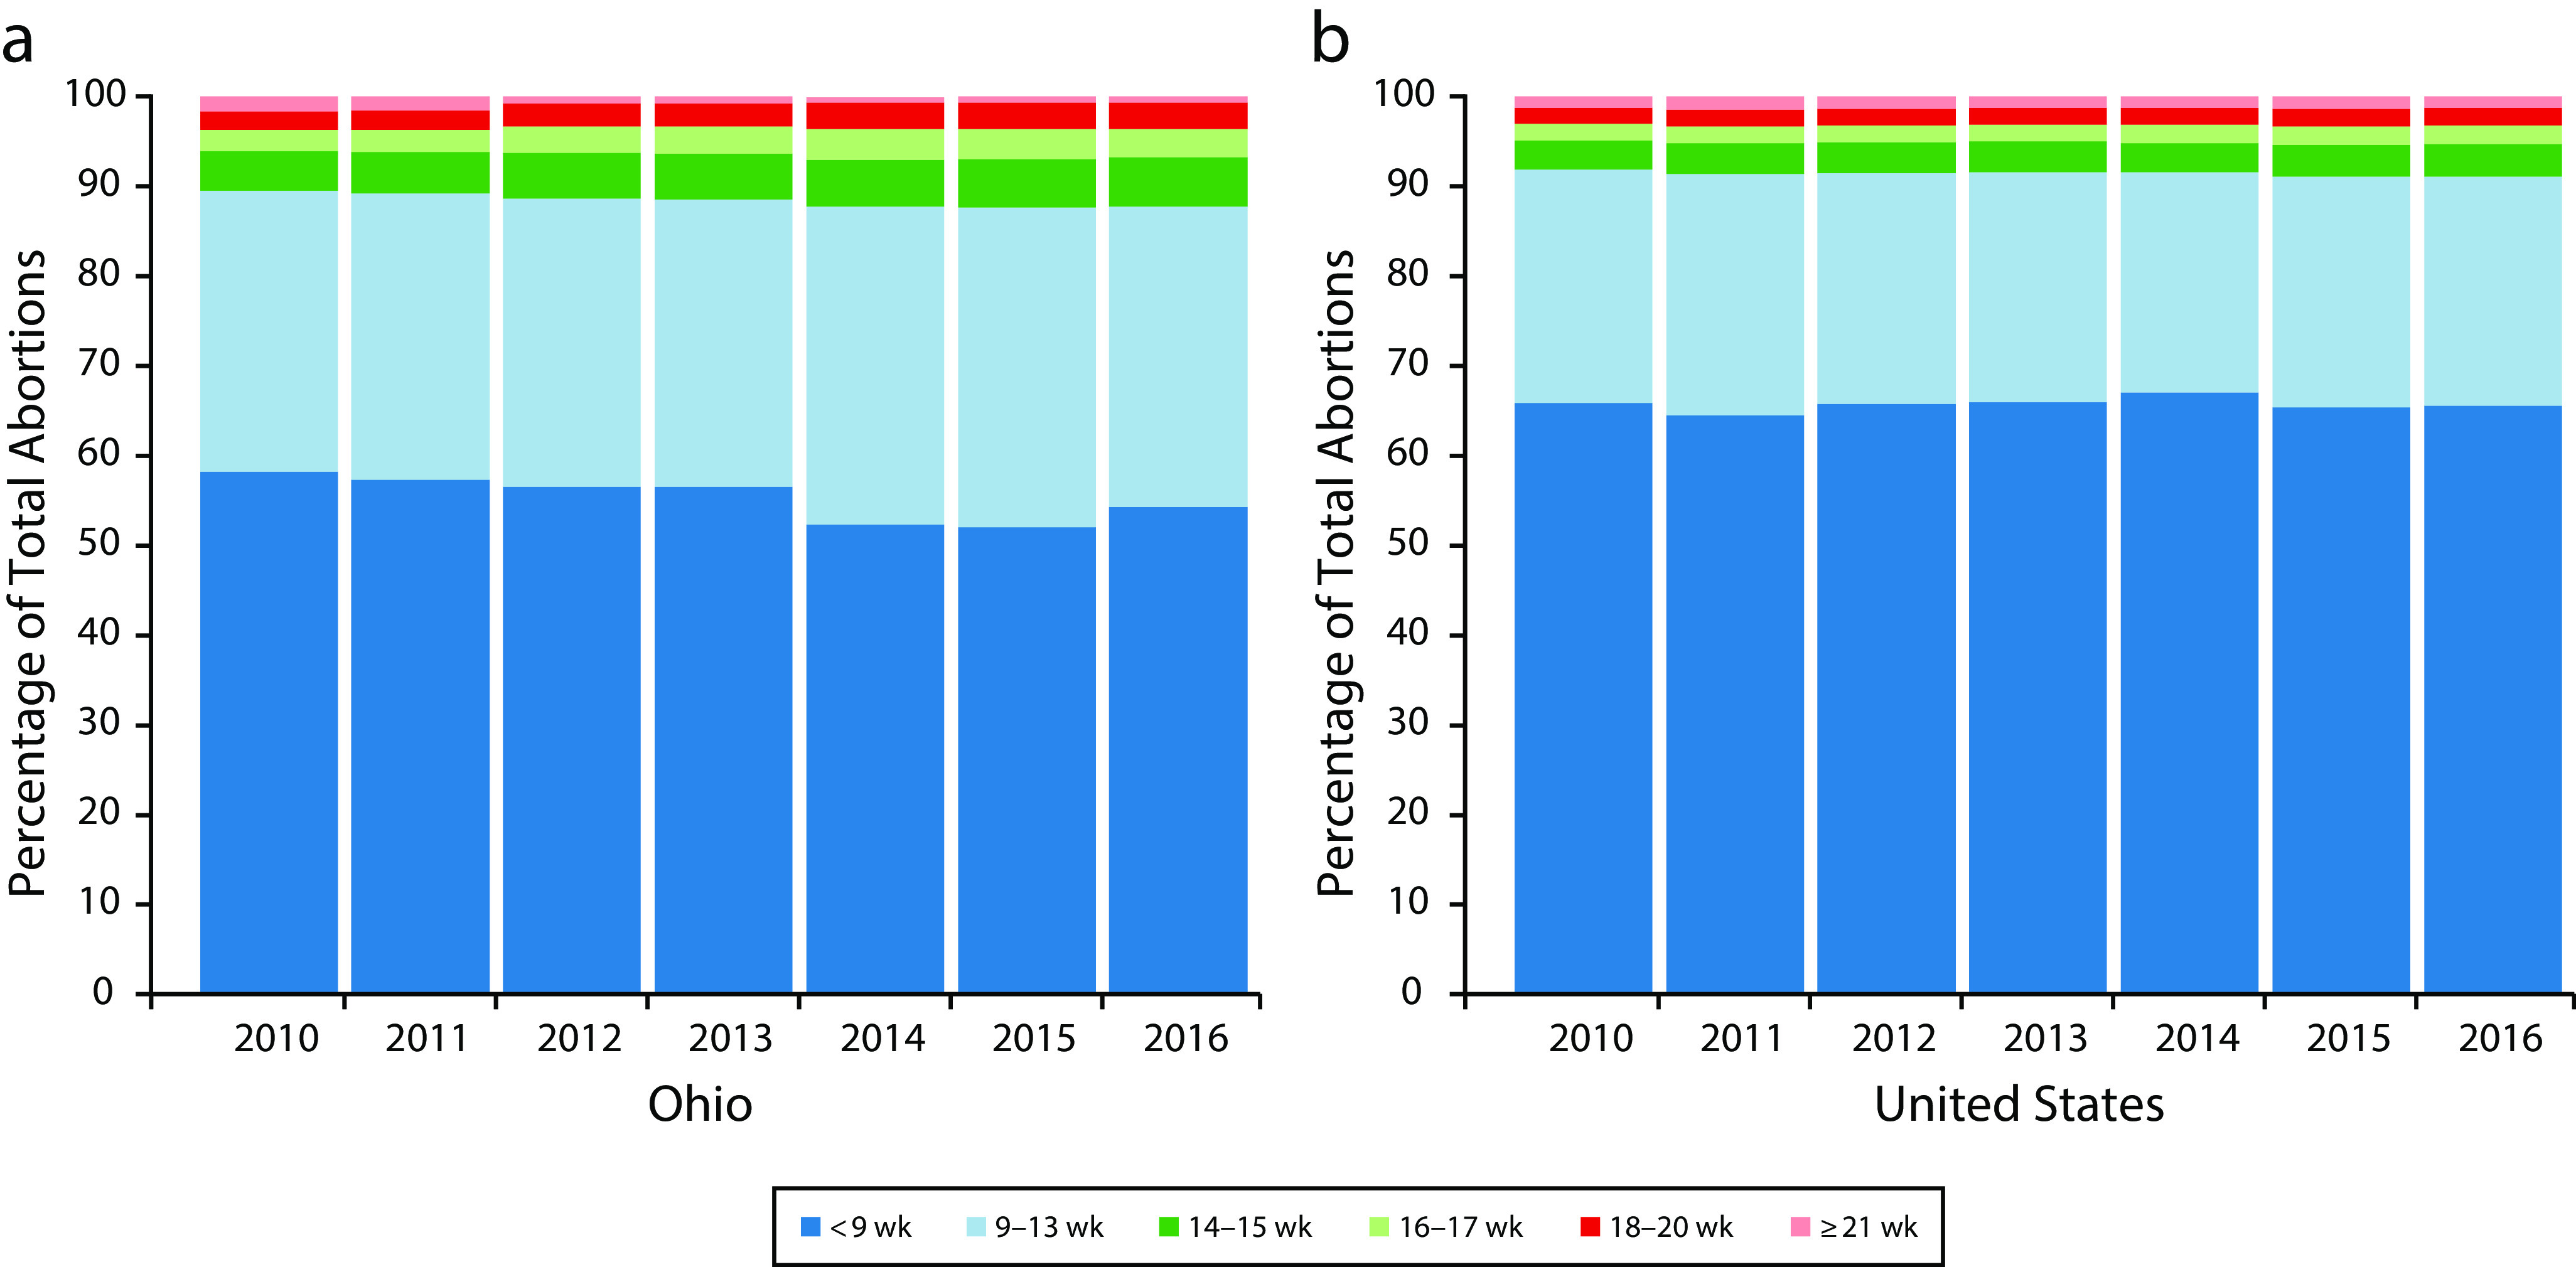
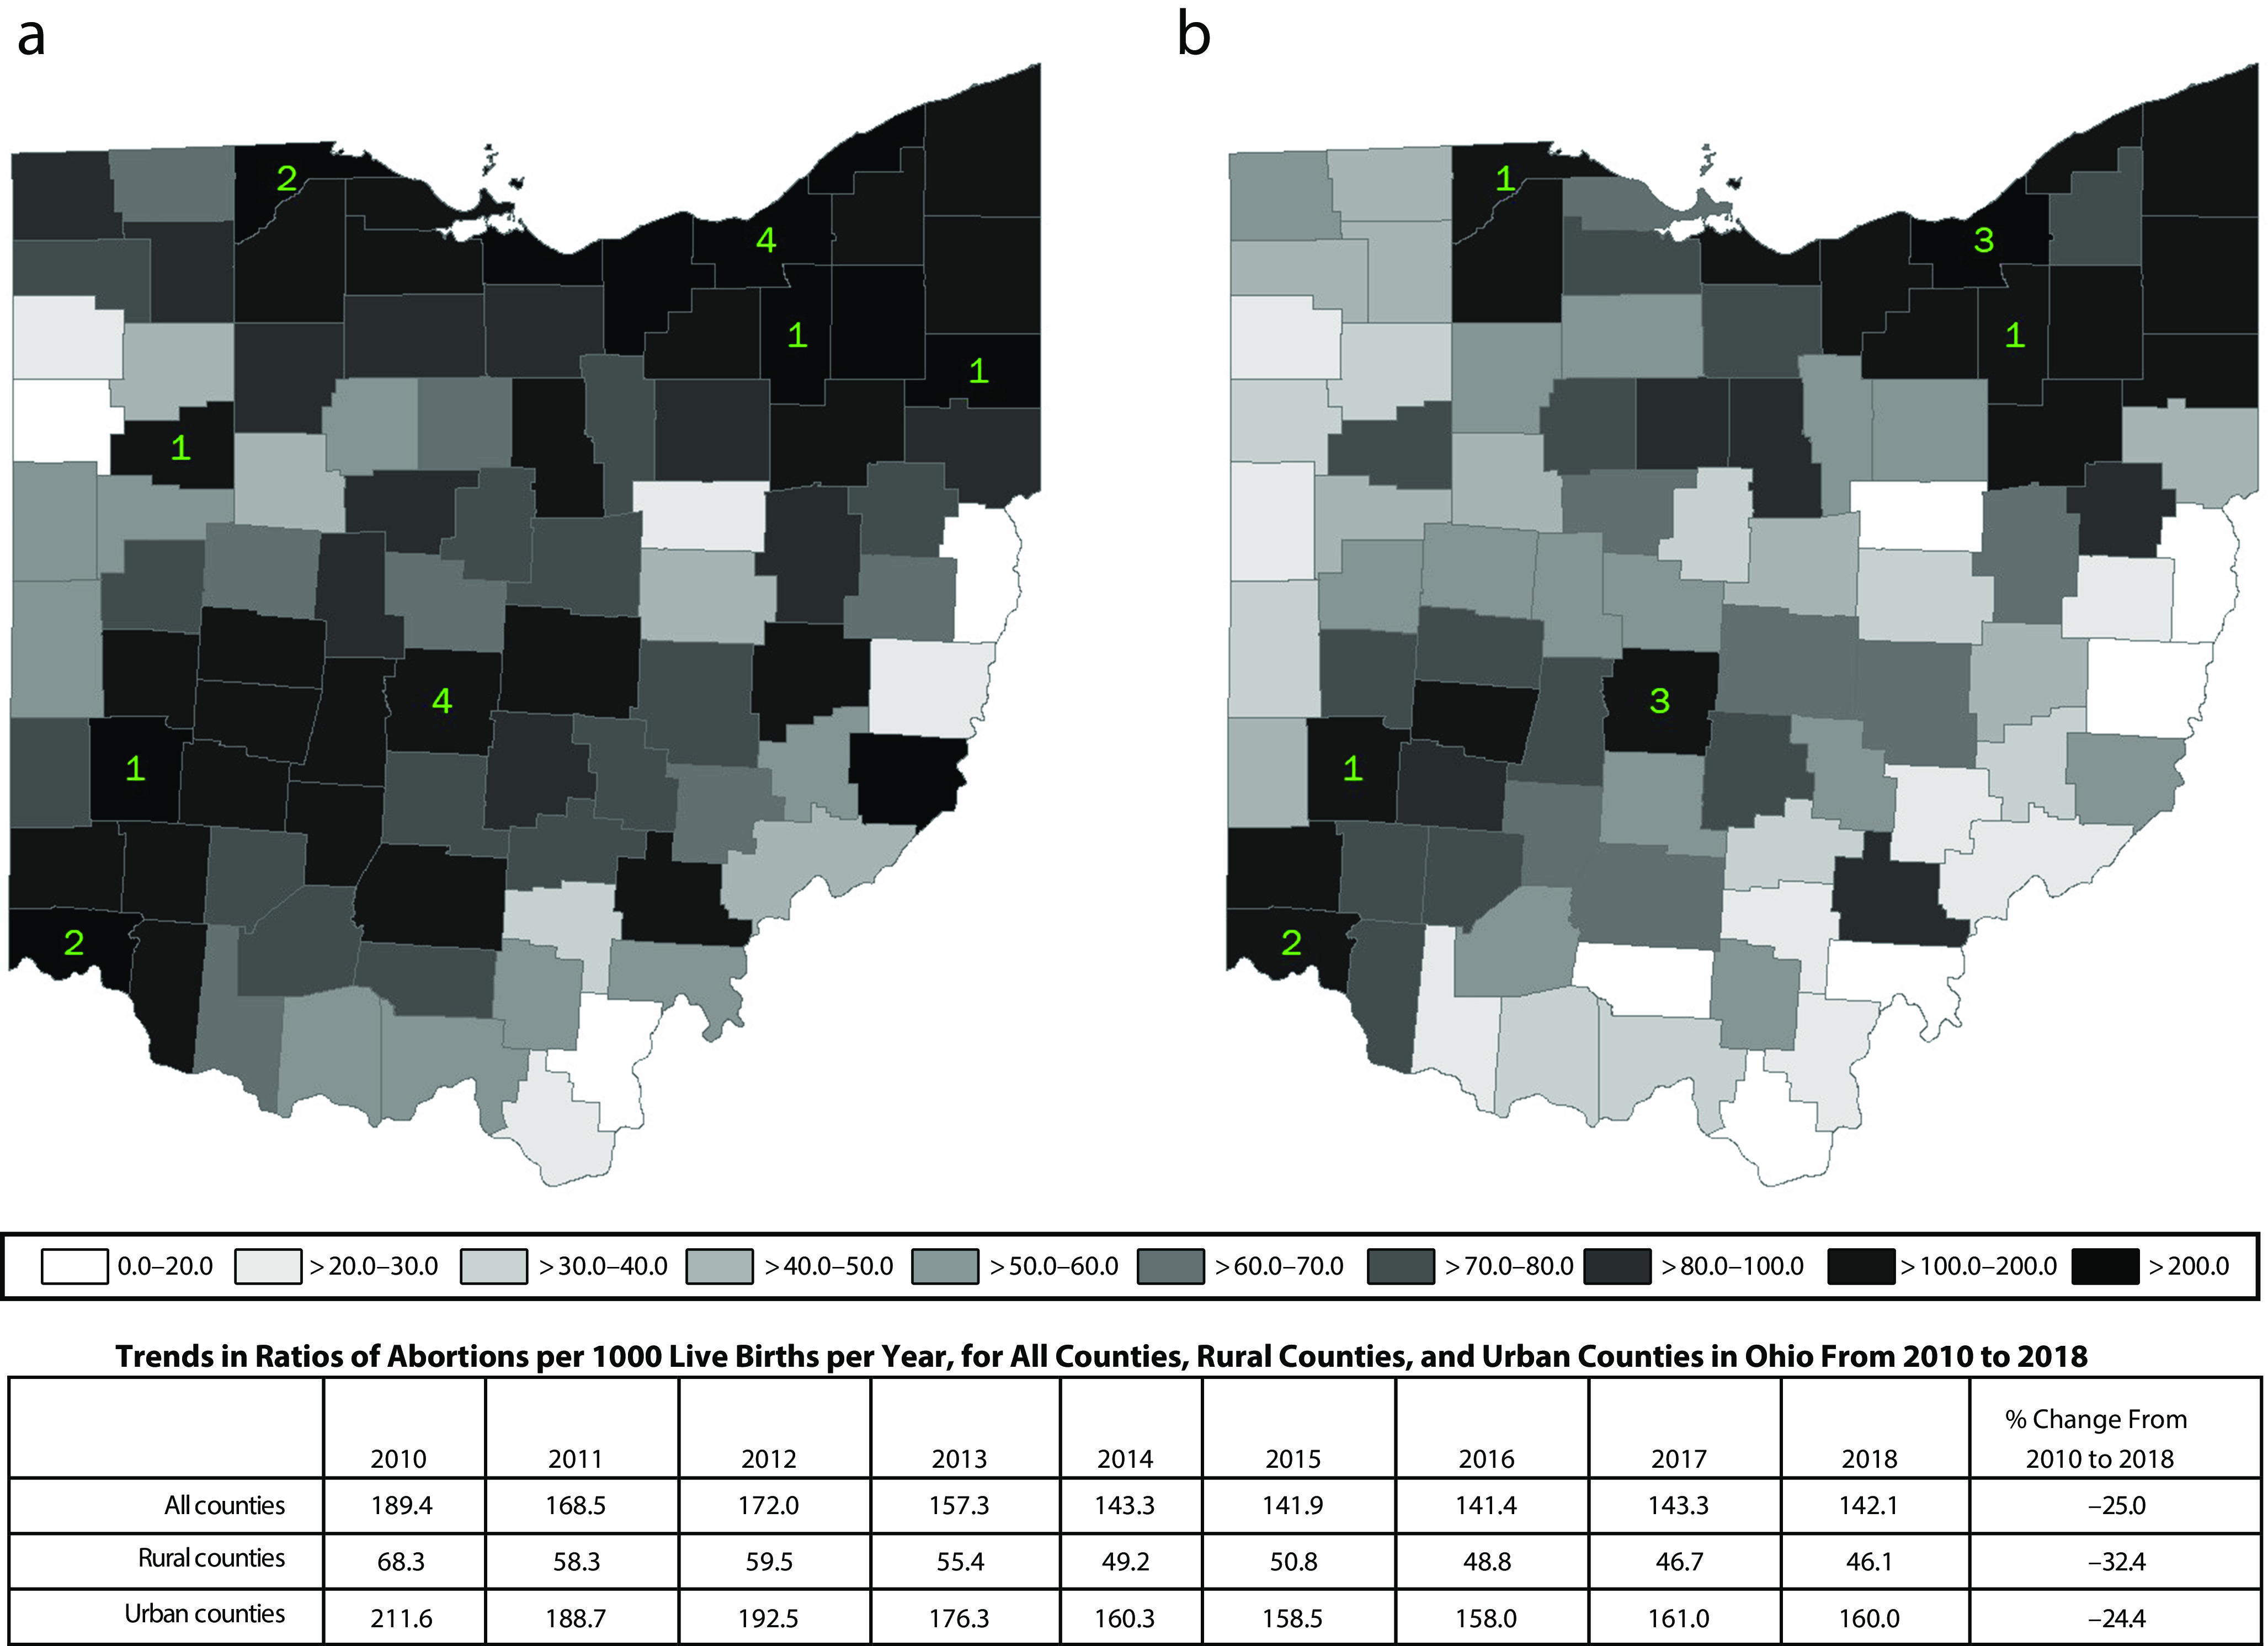
Objectives. To examine abortion utilization in Ohio from 2010 to 2018, a period when more than 15 abortion-related laws became effective.Methods. We evaluated changes in abortion rates and ratios examining gestation, geographic distribution, and abortion method in Ohio from 2010 to 2018. We used data from Ohio's Office of Vital Statistics, the Centers for Disease Control and Prevention's Abortion Surveillance Reports, the American Community Survey, and Ohio's Public Health Data Warehouse.Results. During 2010 through 2018, abortion rates declined similarly in Ohio, the Midwest, and the United States. In Ohio, the proportion of early first trimester abortions decreased; the proportion of abortions increased in nearly every later gestation category. Abortion ratios decreased sharply in most rural counties. When clinics closed, abortion ratios dropped in nearby counties.Conclusions. More Ohioans had abortions later in the first trimester, compared with national patterns, suggesting delays to care. Steeper decreases in abortion ratios in rural versus urban counties suggest geographic inequity in abortion access.Public Health Implications. Policies restricting abortion access in Ohio co-occur with delays to care and increasing geographic inequities. Restrictive policies do not improve reproductive health.
Figures

Similar articles
-
How Ohio's proposed abortion bans would impact travel distance to access abortion care.Perspect Sex Reprod Health. 2022 Jun;54(2):54-63. doi: 10.1363/psrh.12191. Epub 2022 Apr 20. Perspect Sex Reprod Health. 2022. PMID: 35442569 Free PMC article.
-
Abortion surveillance - United States, 2010.MMWR Surveill Summ. 2013 Nov 29;62(8):1-44. MMWR Surveill Summ. 2013. PMID: 24280963
-
Effects of Legislation Regulating Abortion in Arizona.Womens Health Issues. 2018 Jul-Aug;28(4):297-300. doi: 10.1016/j.whi.2018.02.002. Epub 2018 Apr 7. Womens Health Issues. 2018. PMID: 29631976
-
Induced abortion in Italy: levels, trends and characteristics.Fam Plann Perspect. 1996 Nov-Dec;28(6):267-71, 277. Fam Plann Perspect. 1996. PMID: 8959417 Review.
-
Unsafe abortion: global and regional incidence, trends, consequences, and challenges.J Obstet Gynaecol Can. 2009 Dec;31(12):1149-58. J Obstet Gynaecol Can. 2009. PMID: 20085681 Review.
Cited by
-
How Ohio's proposed abortion bans would impact travel distance to access abortion care.Perspect Sex Reprod Health. 2022 Jun;54(2):54-63. doi: 10.1363/psrh.12191. Epub 2022 Apr 20. Perspect Sex Reprod Health. 2022. PMID: 35442569 Free PMC article.
-
Use of nonpreferred contraceptive methods among women in Ohio.Contraception. 2021 May;103(5):328-335. doi: 10.1016/j.contraception.2021.02.006. Epub 2021 Feb 16. Contraception. 2021. PMID: 33607120 Free PMC article.
-
Making sense of the economics of abortion in the United States.Perspect Sex Reprod Health. 2024 Sep;56(3):199-210. doi: 10.1111/psrh.12288. Epub 2024 Nov 13. Perspect Sex Reprod Health. 2024. PMID: 39537337 Free PMC article.
-
Kentucky's abortion landscape, 2010 to 2019: an analysis of pre-Dobbs abortion disparities in a rural, restrictive state.Lancet Reg Health Am. 2023 Feb 15;19:100441. doi: 10.1016/j.lana.2023.100441. eCollection 2023 Mar. Lancet Reg Health Am. 2023. PMID: 36852333 Free PMC article.
-
'The Biggest Problem With Access': Provider Reports of the Effects of Wisconsin 2011 Act 217 Medication Abortion Legislation.WMJ. 2023 Mar;122(1):15-19. WMJ. 2023. PMID: 36940116 Free PMC article.
References
-
- Health, United States, 2016, With Chartbook on Long-Term Trends in Health. Hyattsville, MD: National Center for Health Statistics; 2017. - PubMed
-
- Pazol K, Creanga AA, Burley KD, Hayes B, Jamieson DJ Centers for Disease Control and Prevention. Abortion surveillance—United States, 2010 [erratum in MMWR Surveill Summ. 2014;62(51):1053] MMWR Surveill Summ. 2013;62(8):1–44. - PubMed
-
- Pazol K, Creanga AA, Burley KD, Jamieson DJ. Abortion surveillance—United States, 2011. MMWR Surveill Summ. 2014;63(11):1–41. - PubMed
-
- Pazol K, Creanga AA, Jamieson DJ Centers for Disease Control and Prevention. Abortion surveillance—United States, 2012. MMWR Surveill Summ. 2015;64(10):1–40. - PubMed
-
- Jatlaoui TC, Ewing A, Mandel MG et al. Abortion surveillance—United States, 2013. MMWR Surveill Summ. 2016;65(12):1–44. - PubMed
Publication types
MeSH terms
Grants and funding
LinkOut - more resources
Full Text Sources
Medical
