. 2020 Jul 6;219(7):e201912098.
doi: 10.1083/jcb.201912098.

A PI3K-WIPI2 positive feedback loop allosterically activates LC3 lipidation in autophagy

Affiliations

A PI3K-WIPI2 positive feedback loop allosterically activates LC3 lipidation in autophagy

Dorotea Fracchiolla et al. J Cell Biol. .

Abstract

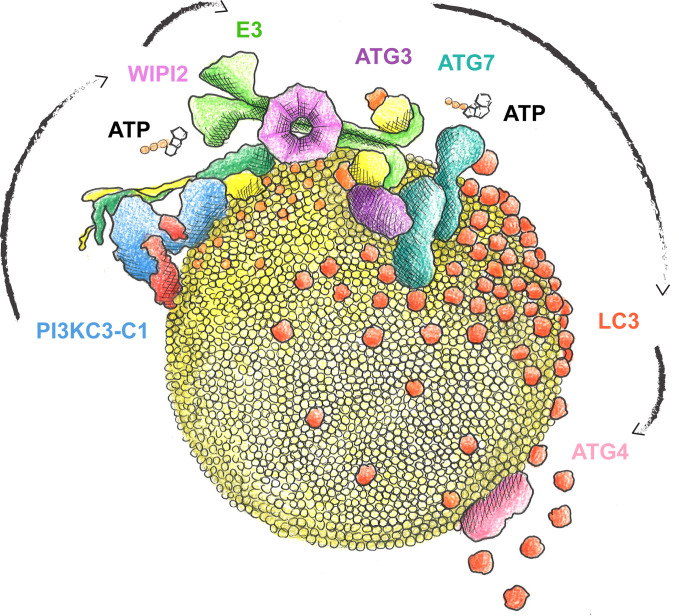
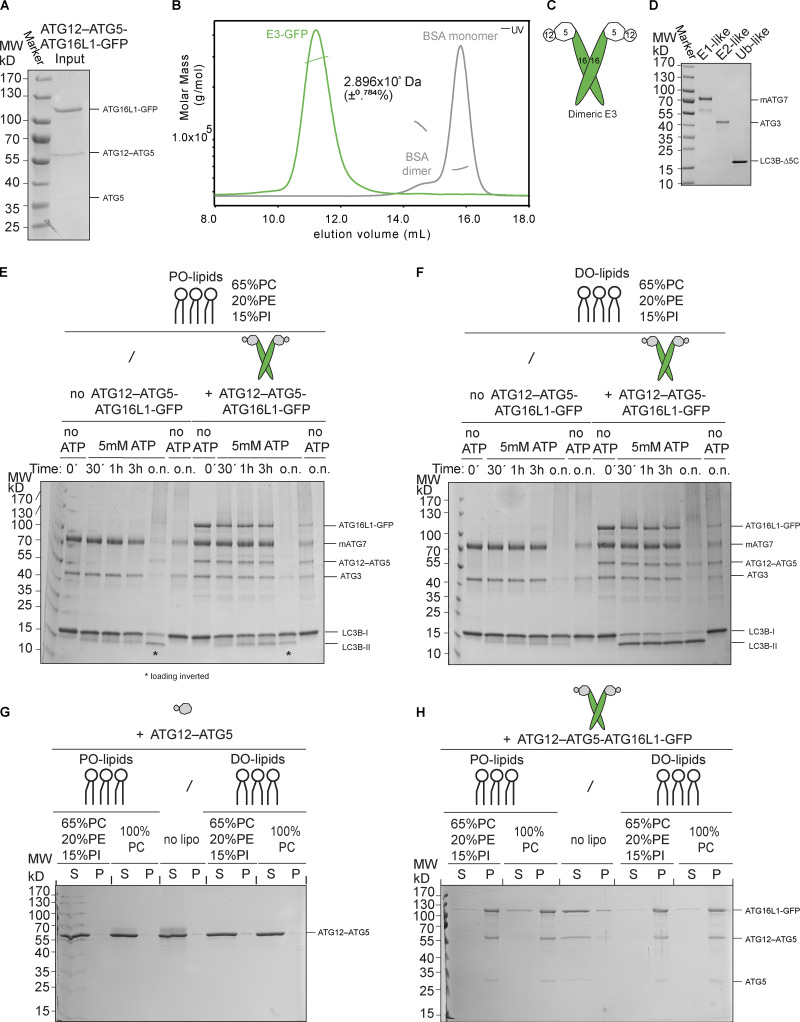
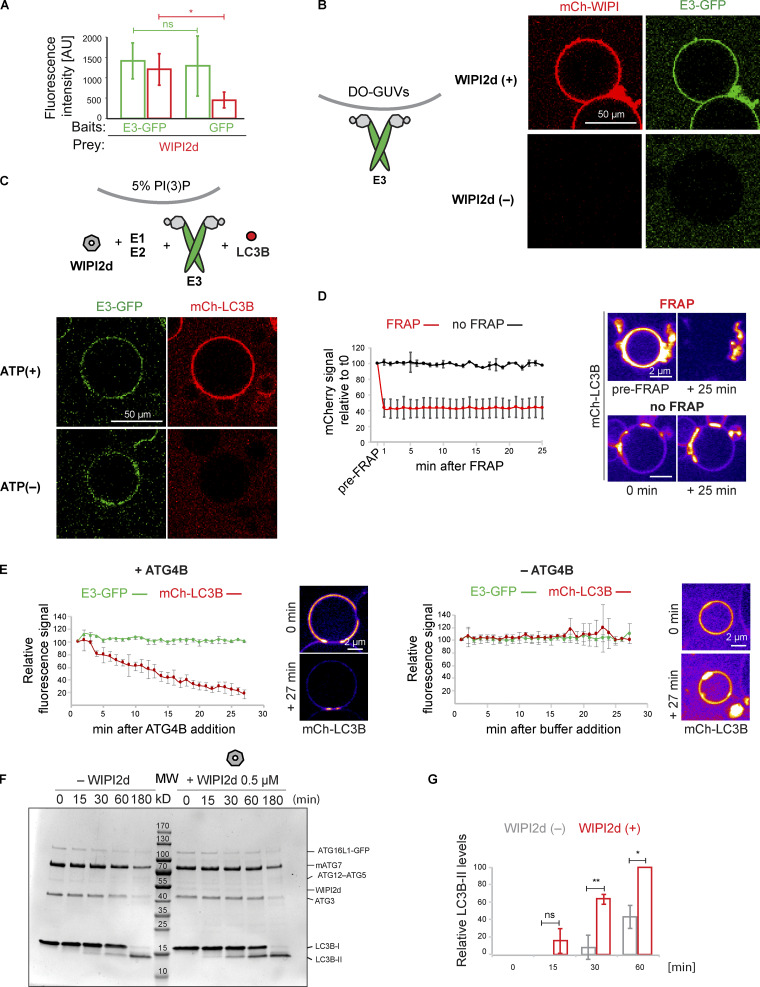
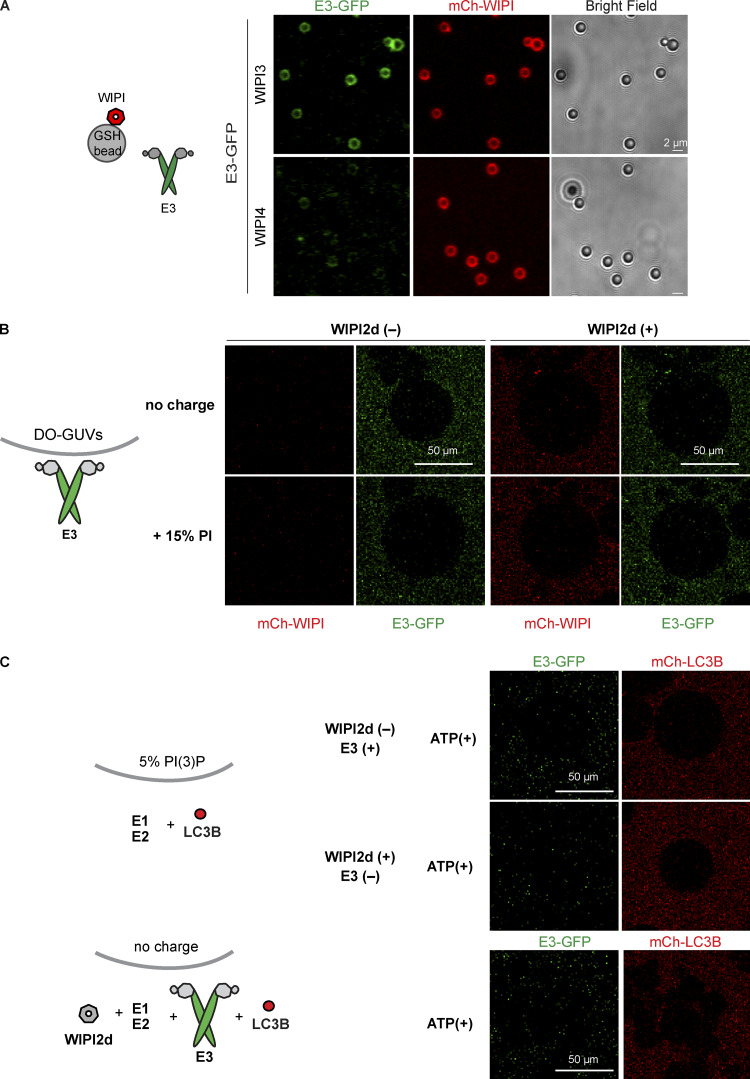
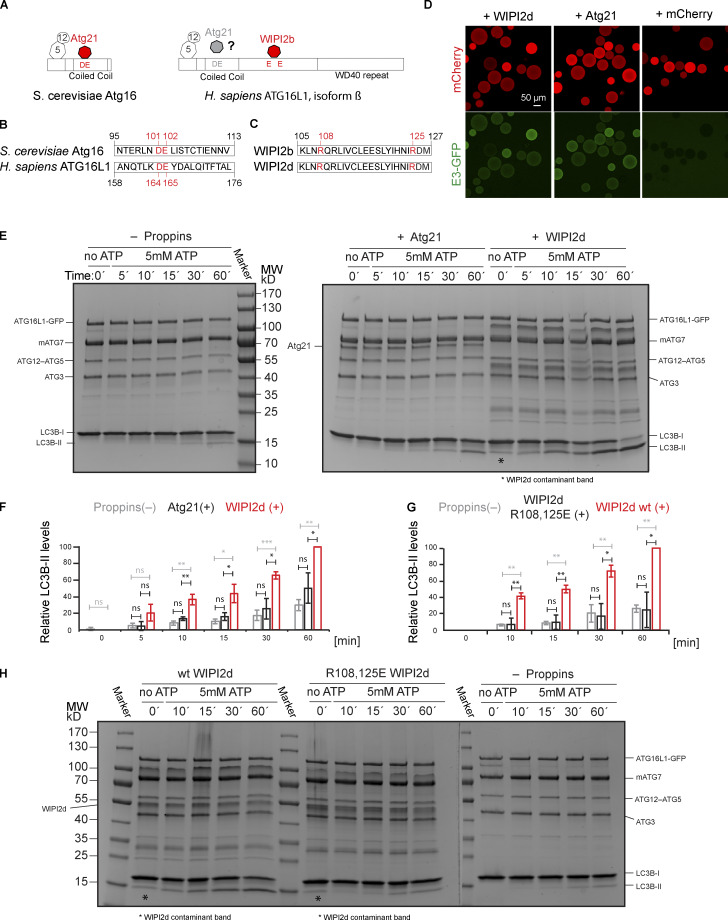
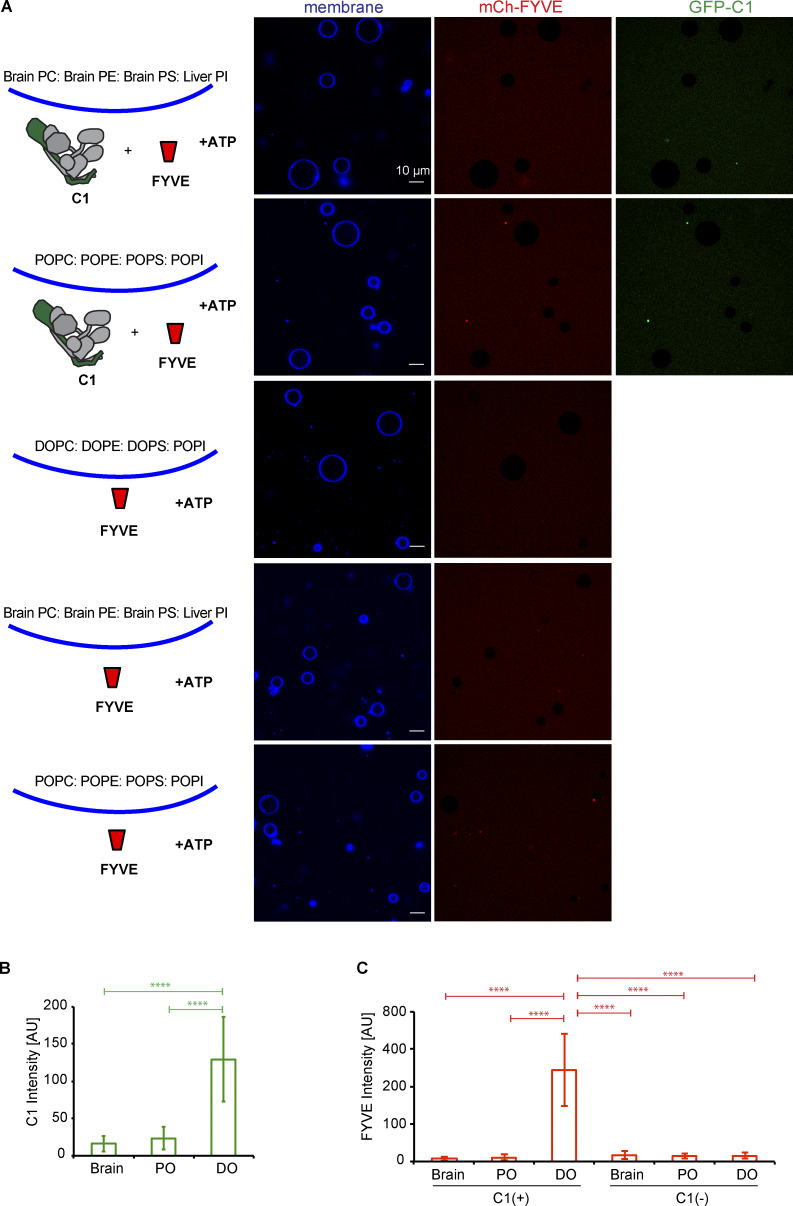
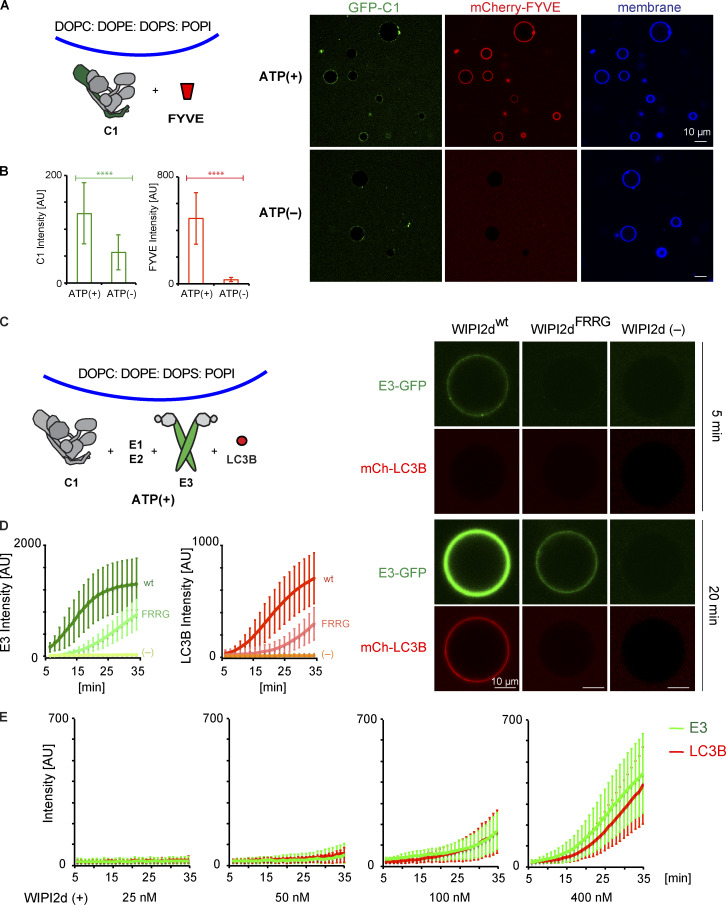
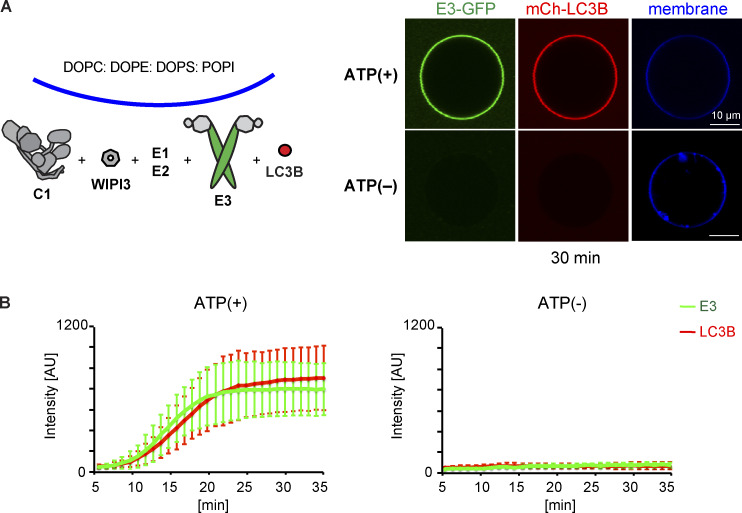
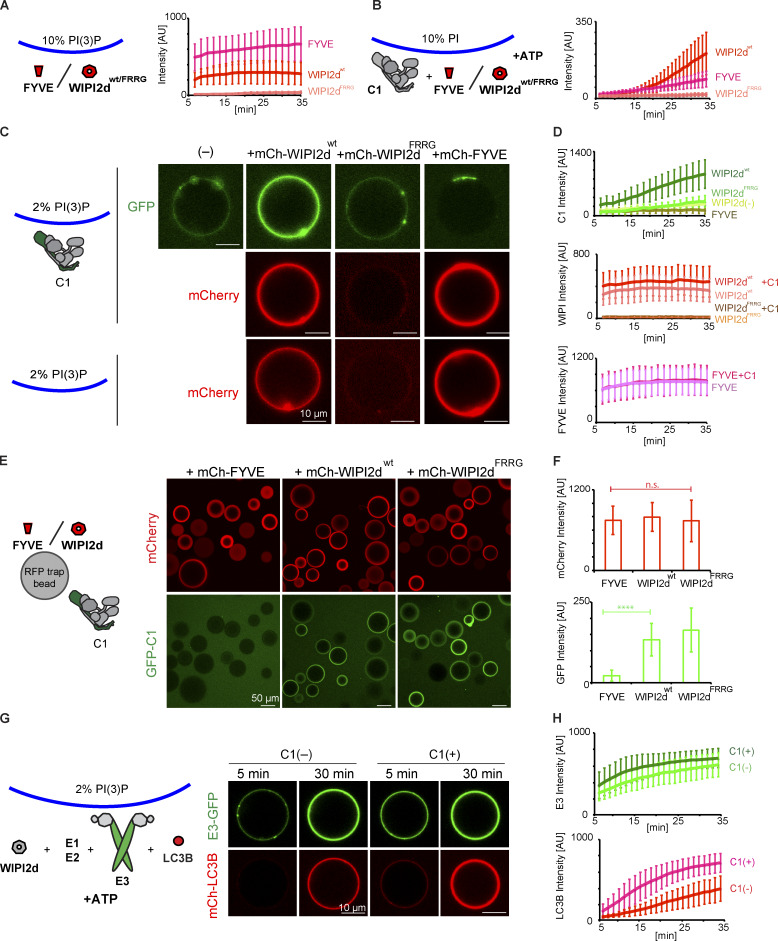
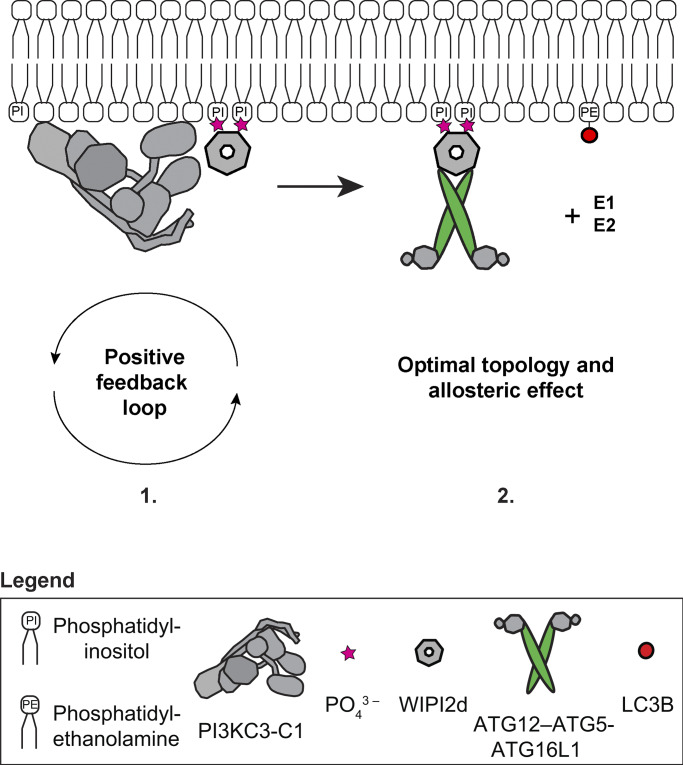
Autophagy degrades cytoplasmic cargo by its delivery to lysosomes within double membrane autophagosomes. Synthesis of the phosphoinositide PI(3)P by the autophagic class III phosphatidylinositol-3 kinase complex I (PI3KC3-C1) and conjugation of ATG8/LC3 proteins to phagophore membranes by the ATG12-ATG5-ATG16L1 (E3) complex are two critical steps in autophagosome biogenesis, connected by WIPI2. Here, we present a complete reconstitution of these events. On giant unilamellar vesicles (GUVs), LC3 lipidation is strictly dependent on the recruitment of WIPI2 that in turn depends on PI(3)P. Ectopically targeting E3 to membranes in the absence of WIPI2 is insufficient to support LC3 lipidation, demonstrating that WIPI2 allosterically activates the E3 complex. PI3KC3-C1 and WIPI2 mutually promote the recruitment of each other in a positive feedback loop. When both PI 3-kinase and LC3 lipidation reactions were performed simultaneously, positive feedback between PI3KC3-C1 and WIPI2 led to rapid LC3 lipidation with kinetics similar to that seen in cellular autophagosome formation.


Figures

None
Graphical abstract
Figure S1.
Figure S1.
Biochemical characterization of the E3 and the LC3 lipidation machinery. (A) Purified human E3-GFP complex resolved on a 10% SDS-polyacrylamide gel and stained with Coomassie Brilliant Blue. MW, molecular weight. (B) SLS plot of recombinant E3-GFP. The protein was applied onto a Superose 6 Increase 10/300 GL column coupled with a TREOS II instrument. BSA was used for calibration. (C) Schematic representation of the dimeric E3-like ligase holo-complex containing two copies of each subunit of ATG12, ATG5, and ATG16L1(+monoGFP). (D) Recombinant mouse ATG7, human ATG3, and LC3BΔ5C resolved on a 10% SDS-polyacrylamide gel and stained with Coomassie Brilliant Blue. MW, molecular weight. (E) In vitro LC3B lipidation assay using PO-SUVs (65% PC:15% liver PI:20% PE), ATG7, ATG3, E3-GFP (1 µM), and LC3B incubated at 37°C in the presence of MgCl2/ATP. Samples taken at the indicated time points (o.n.) were loaded on a 4–15% SDS-polyacrylamide gel. Time points corresponding to o.n. incubation indicated with an asterisk (*) were swapped during loading. MW, molecular weight. (F) ATG7, ATG3, E3-GFP (1 µM), and LC3B were incubated with DO-SUVs (65% PC:15% PI:20% PE) at 37°C with MgCl2 and ATP. Samples at the indicated time points (o.n.) were loaded on a 4–15% SDS-polyacrylamide gel. MW, molecular weight. (G) Co-sedimentation assay of ATG12–ATG5 with DO-lipid (left) or PO-lipid (right) SUVs (65% PC:15% PI: 20% PE). MW, molecular weight. (H) Co-sedimentation assay of the E3 with DO-lipid (left) or PO-lipid (right) SUVs with the indicated lipid composition. MW, molecular weight.
Figure 1.
Figure 1.
LC3 lipidation machinery is active on SUVs, but not on GUVs. (A) In vitro LC3B lipidation assay on DO-SUVs. ATG7, ATG3, and LC3B were mixed with SUVs (65% PC:15% liver PI:20% PE), in the absence (left) or presence of the E3 complex (1 µM; middle) or the ATG12–ATG5 conjugate (1 µM; right) and incubated at 37°C in the presence of MgCl2/ATP. Samples taken at the indicated time points (minutes to hours) were loaded on a 4–15% SDS-polyacrylamide gel. MW, molecular weight. (B) The E3-GFP complex (0.5 µM) was added to DO-GUVs (65% PC:15% liver PI:20% PE). (C) The E3-GFP (0.5 µM), ATG7, ATG3, and mCherry-LC3B were added to GUVs (65% PC:15% liver PI:20% PE), in the presence of MgCl2/ATP. Representative confocal micrographs are shown.
Figure 2.
Figure 2.
WIPI2d both recruits and allosterically activates E3 for LC3 lipidation. (A) Quantification of the mCherry-WIPI2d signal intensity (red bars) measured on GFP-Trap beads coated with either GFP or GFP-tagged E3 (means ± SD; n = 94 [E3-GFP] or 80 [GFP]). P values were calculated using Student’s t test: not significant (ns), P ≥ 0.05; *, 0.01 < P < 0.05; **, 0.001 < P < 0.01; AU, arbitrary units. (B) E3-GFP (0.5 µM) was added to DO-GUVs containing 75% PC:5% PI(3)P:20% PE in the absence or presence of mCherry-WIPI2d (0.5 µM). (C) E3-GFP (0.1 µM) was coincubated with WIPI2d (0.5 µM), mCherry-LC3B, and the lipidation machinery on DO-GUVs [75% PC:5% PI(3)P:20% PE] in the presence of MgCl2/ATP. (D) FRAP experiment on GUVs after lipidation in the presence of ATP as conducted in (C). A quantification is shown (means ± SD; n FRAP = 3, n no FRAP = 2), together with representative images of the two conditions, at times 0 and 25 min after the photobleaching. (E) De-lipidation reactions on GUVs treated as in (C), in the presence of ATP. CIP/ATG4B (left) or buffer (right) was added to the wells, and imaging was conducted for the indicated time. Quantification of the mCherry-LC3B and E3-GFP signals over time is shown (means ± SD; n CIP/ATG4B = 31, n buffer = 6), together with representative images of the two conditions, at times 0 and 27 min after the addition. (F) In vitro LC3B lipidation assay on DO-SUVs in the absence or presence of WIPI2d. ATG7, ATG3, E3-GFP (0.1 µM), and LC3B are mixed with DO-SUVs [75% PC:5% PI(3)P:20% PE], either in the absence (left) or in the presence of 0.5 µM WIPI2d (right), and incubated at 37°C with MgCl2/ATP. Samples were taken at the indicated time points and loaded on a 4–15% SDS-polyacrylamide gel. MW, molecular weight. (G) Quantification of three independent experiments is shown as relative LC3B-II levels at each time point (means ± SD; n = 3). ns, not significant.
Figure S2.
Figure S2.
PI(3)P- and WIPI2d-dependent E3 recruitment to GUVs and LC3 lipidation. (A) GST-mCherry–tagged WIPI3 or WIPI4 was incubated with GFP-tagged E3 and glutathione-coated polystyrene beads. Representative confocal images taken after 30-min incubation are shown. (B) E3 was coincubated with mCherry-WIPI2d and DO-GUVs containing either 65% PC:20% PE:15% PI (bearing the same net negative charge as GUVs in Fig. 2 B) or GUVs containing 80% PC:20% PE (zero net charge). (C) mCherry-LC3B was coincubated with ATG7 and ATG3 in the presence or absence of E3-GFP or WIPI2d with GUVs containing either 75% PC:20% PE:5% PI(3)P (as GUVs in Fig. 2 C) or GUVs containing 80% PC:20% PE (zero net charge).
Figure S3.
Figure S3.
Role of WIPI2d binding to the E3 complex goes beyond its membrane recruitment. (A) Co-sedimentation assay using DO-SUVs [75% PC:20% PE:5% PI(3)P] and the E3-GFP complex in the presence or absence of WIPI2d or Atg21. Quantification of three independent experiments (means ± SD; n = 3) is shown on the right. P, pellet; MW, molecular weight; ns, not significant; S, supernatant. (B) GFP-Trap beads coated with E3-GFP and mCherry-WIPI2d or mCherry-Atg21 or no PROPPINs were incubated with DO-SUVs containing 72% PC:20% PE:5% PI(3)P:3% ATTO390-PE. Quantification of three independent experiments (means ± SD; n = 3) is shown. AU, arbitrary units; n.s., not significant. (C) RFP-Trap beads coated with mCherry, mCherry-WIPI2d, or mCherry-Atg21 were incubated with DO-SUVs containing 72% PC: 20% PE:5% PI(3)P:3% ATTO390-PE. Quantification of three independent experiments (means ± SD; n = 3) is shown. P values were calculated using Student’s t test: **, 0.001 < P < 0.01. AU, arbitrary units. (D) E3-GFP (0.1 µM) recruitment to DO-GUVs containing 75% PC:20% PE:5% PI(3)P in the presence of wild-type (wt) WIPI2d (0.2 µM) or R108,125E mutant WIPI2d (0.2 µM) or no PROPPINs (–). The E3-GFP signal on GUVs was quantified and plotted (means ± SD; n wt = 107, n mut = 197, n no PROPPINs = 170). A blot probed for WIPI2 shows the protein input. AU, arbitrary units. (E) Coomassie-stained gel showing equal amounts of wild-type (wt) and R108,125E mutant proteins used in the bulk lipidation assays of Fig. 3. G and H.MW, molecular weight. (F) Co-sedimentation assay using DO-SUVs [75% PC:5% PI(3)P:20% PE] and the wild-type (wt) WIPI2d or R108,125E WIPI2d. MW, molecular weight.
Figure 3.
Figure 3.
WIPI2d specifically promotes LC3 lipidation. (A) Scheme showing the domain organization of S. cerevisiae Atg16 and H. sapiens ATG16L1 (isoform β) and their interactors. (B) Alignment of S. cerevisiae Atg16 and H. sapiens ATG16L1 (isoform β) protein sequences spanning a region around the D101, E102 of Atg16 (Atg21 binding site) and residues D164, E165 in ATG16L1. (C) Alignment of the H. sapiens WIPI2 isoforms b and d spanning the region surrounding the ATG16L1 binding site including R108 and R125. (D) Microscopy-based bead protein interaction assay with RFP-Trap beads coated with mCherry-WIPI2d, mCherry-Atg21, or mCherry as baits and incubated with 5 µM E3-GFP as prey. Representative confocal micrographs are shown. (E and F) DO-SUVs [75% PC:5% PI(3)P:20% PE] were incubated with ATG7, ATG3, E3-GFP (0.5 µM), and LC3B in the presence of no PROPPIN, WIPI2d or Atg21 (both 2.5 µM). Samples taken at the indicated time points (minutes) were loaded on a 4–15% SDS-polyacrylamide gel. MW, molecular weight. Quantification is shown in F as relative LC3B-II levels for each time point (means ± SD; n = 3). P values were calculated using Student’s t test: not significant (ns), P ≥ 0.05; *, 0.01 < P < 0.05; **, 0.001 < P < 0.01; ***, P < 0.001. (G and H) DO-SUVs [75% PC:5% PI(3)P:20% PE] were incubated with ATG7, ATG3, E3-GFP (0.5 µM) and LC3B in the presence of wt WIPI2d, R108,125E mutant WIPI2d (at 2.5 µM), or no PROPPINs. Samples taken at the indicated time points (minutes) were loaded on a 4–15% SDS-polyacrylamide gel. MW, molecular weight. Quantification is shown in G as relative LC3B-II levels for each time point (means ± SD; n = 3).
Figure S4.
Figure S4.
PI3KC3-C1 is active on unsaturated flat membranes. (A) Representative confocal images of GUVs showing the binding of the PI3KC3-C1 complex and FYVE domain on different membranes. mCherry-FYVE domain (1 µM) was incubated with GUVs with brain lipids (64.8% brain PC:20% brain PE:5% brain PS:10% liver PI:0.2% Atto647 DOPE), PO lipids (64.8% POPC:20% POPE:5% POPS:10% POPI:0.2% Atto647 DOPE), or DO lipids (64.8% DOPC:20% DOPE:5% DOPS:10% POPI:0.2% Atto647 DOPE) in the absence or presence of GFP-tagged PI3KC3-C1 (200 nM) for 30 min. (B) Quantification of the relative intensities of PI3KC3-C1 on different GUV membranes (means ± SD; n = 50). P values were calculated using Student’s t test: ****, P < 0.0001. AU, arbitrary units. (C) Quantification of the relative intensities of FYVE domain on different GUV membranes (means ± SD; n = 50). P values were calculated using Student’s t test: ****, P < 0.0001. AU, arbitrary units.
Figure 4.
Figure 4.
PI3KC3-C1 supports LC3B lipidation on unsaturated flat membranes. The schematic drawing illustrates the reaction setting. Colors indicate fluorescent protein–fused components. Components in gray are not labeled but are present in the reaction mix. (A) Representative confocal images of GUVs showing the membrane binding of the PI3KC3-C1 and FYVE domain. GFP-tagged PI3KC3-C1 (200 nM) and mCherry-tagged FYVE (1 µM) were incubated with DO-GUVs (64.8% PC:20% PE:5% PS:10% POPI:0.2% Atto647 DOPE) in the presence or absence of ATP/Mn2+ (50 µM/1 mM) at RT. Images were taken after 30-min incubation. (B) Quantification of the relative intensities of PI3KC3-C1 (green bars) and FYVE domain (red bars) on GUV membranes in A (means ± SD; n = 50). P values were calculated using Student’s t test: ****, P < 0.0001. AU, arbitrary units. (C) Representative confocal images of GUVs showing E3 binding and LC3B lipidation. mCherry-tagged LC3B was incubated with GUVs in the presence of PI3KC3-C1 (0.1 µM), WIPI2d (0.4 µM or none) or WIPI2d FRRG mutant (0.4 µM), E3-GFP, ATG7, ATG3, and ATP/Mn2+ (50 µM/1 mM). Images taken at indicated time points are shown. (D) Quantitation of the kinetics of E3 recruitment and LC3B lipidation on the membrane from individual GUV tracing in C (means ± SD; n = 53 [wt], 45 [FRRG], 52 [-]). AU, arbitrary units; wt, wild type. (E) Quantitation of the kinetics of E3 recruitment and LC3B lipidation on the membrane from individual GUV tracing (means ± SD; n = 26 [25 nM], 40 [50 nM], 37 [100 nM], and 32 [400 nM]). mCherry-LC3B was incubated with PI3KC3-C1 (0.1 µM), E3-GFP, ATG7, and ATG3 in the presence of WIPI2d with different concentration. AU, arbitrary units.
Figure S5.
Figure S5.
WIPI3 mediates PI3KC3-C1 trigged LC3 lipidation on GUV membranes. (A) Representative confocal images of GUVs showing E3 membrane recruitment and LC3B lipidation. mCherry-tagged LC3B was incubated with PI3KC3-C1 (100 nM), WIPI3 (400 nM), E3-GFP, ATG7, and ATG3 in the presence or absence of ATP. (B) Quantitation of the kinetics of E3 recruitment and LC3B lipidation on the membrane from individual GUV tracing in (A) (means ± SD; n = 20; 15). AU, arbitrary units.
Figure 5.
Figure 5.
Positive feedback between PI3KC3-C1 and WIPI2d promotes LC3B lipidation. (A) Quantitation of the kinetics of FYVE domain or WIPI2d recruitment to the membrane from individual GUV tracing (means ± SD; n = 45 [FYVE], 54 [WIPI2dwt], and 40 [WIPI2dFRRG]). mCherry-FYVE, mCherry-WIPI2d, or mCherry-WIPI2d FRRG mutant (0.5 µM) was incubated with 10% PI(3)P DO-GUVs (64.8% PC:20% PE:5% PS:10% PI(3)P:0.2% Atto647 DOPE]). AU, arbitrary units; wt, wild type. (B) Quantitation of the kinetics of FYVE domain or WIPI2d recruitment to the membrane from individual GUV tracing (means ± SD; n = 53 [FYVE], 64 [WIPI2dwt], and 66 [WIPI2dFRRG]). mCherry-FYVE, mCherry-WIPI2d, or mCherry-WIPI2d FRRG mutant (0.5 µM) and PI3KC3-C1 (0.1 µM) were incubated with 10% PI DO-GUVs (64.8% PC:20% PE:5% PS:10% POPI:0.2% Atto647 DOPE) in the presence of ATP/Mn2+ (50 µM/1 mM). AU, arbitrary units; wt, wild type. (C) Representative confocal images showing the membrane binding of the PI3KC3-C1 complex, WIPI2d, WIPI2d FRRG mutant, or FVYE domain. GFP-tagged PI3KC3-C1 (0.1 µM) was incubated with 2% PI(3)P DO-GUVs [72.8% PC:20% PE:5% DOPS:2% PI(3)P:0.2% Atto647 DOPE] in the absence or presence of 250 nM mCherry-tagged WIPI2d, WIPI2d FRRG mutant, or FYVE domain, respectively (top two panels). 250 nM WIPI2d, WIPI2d FRRG mutant, or FYVE domain was incubated with 2% PI(3)P GUVs in the absence of PI3KC3-C1 (bottom). wt, wild type. (D) Quantitation of the kinetics of PI3KC3-C1, WIPI2d, WIPI2d FRRG mutant, or FYVE domain recruitment to the membrane from individual GUV tracing in (C) (means ± SD; n = 47 [C1 alone], 48 [C1+WIPI2wt], 40 [C1+WIPI2FRRG], 33 [C1+FYVE], 42 [WIPI2wt alone], 43 [WIPI2FRRG alone], and 42 [FYVE alone]). AU, arbitrary units; wild type. (E) Microscopy-based bead protein interaction assay with RFP-Trap beads coated with mCherry-FYVE, mCherry-WIPI2d, or mCherry-WIPI2d FRRG mutant as baits and incubated with 0.1 µM GFP-PI3KC3-C1 as prey. Representative confocal micrographs are shown. (F) Quantification of the GFP-PI3KC3-C1 signal intensity (green bars) measured on RFP-Trap beads coated with mCherry-FYVE, mCherry-WIPI2d, or mCherry-WIPI2d FRRG mutant (means ± SD; n = 75). P values were calculated using Student’s t test: not significant (n.s.), P ≥ 0.05; ****, P < 0.0001. AU, arbitrary units. (G) Representative confocal images of GUVs showing E3 recruitment and LC3B lipidation. mCherry-LC3B was incubated with 2% PI(3)P GUVs in the presence of PI3KC3-C1 (0.1 µM or none), WIPI2d (0.25 µM), E3-GFP, ATG7, ATG3, and ATP/Mn2+. (H) Quantitation of the kinetics of E3 recruitment and LC3B lipidation on the membrane from individual GUV tracing in G (means ± SD; n = 20 [C1−] and 31 [C1+]). AU, arbitrary units.
Figure 6.
Figure 6.
A model of the biochemical reactions reconstituted in this work driving LC3 lipidation in vivo. (1) The PI3KC3-C1 complex phosphorylates PI to produce PI(3)P on the target membrane. This in turn robustly recruits PI(3)P-sensor WIPI2 protein in a self-enhanced positive feedback loop and (2) leads to the downstream recruitment of the E3-like ligase ATG12–ATG5-ATG16L1 complex. These direct protein–protein interactions sustain and promote the catalytic activity of the E3-like ligase enzyme, possibly via an induced conformational change within the E3 or the achievement of an optimal topology of the entire lipidation machinery on the target membrane, resulting in the efficient LC3B–PE conjugation.

References

    1. Anding A.L., and Baehrecke E.H.. 2017. Cleaning House: Selective Autophagy of Organelles. Dev. Cell. 41:10–22. 10.1016/j.devcel.2017.02.016 - DOI - PMC - PubMed
    1. Axe E.L., Walker S.A., Manifava M., Chandra P., Roderick H.L., Habermann A., Griffiths G., and Ktistakis N.T.. 2008. Autophagosome formation from membrane compartments enriched in phosphatidylinositol 3-phosphate and dynamically connected to the endoplasmic reticulum. J. Cell Biol. 182:685–701. 10.1083/jcb.200803137 - DOI - PMC - PubMed
    1. Baskaran S., Ragusa M.J., Boura E., and Hurley J.H.. 2012. Two-site recognition of phosphatidylinositol 3-phosphate by PROPPINs in autophagy. Mol. Cell. 47:339–348. 10.1016/j.molcel.2012.05.027 - DOI - PMC - PubMed
    1. Baskaran S., Carlson L.-A., Stjepanovic G., Young L.N., Kim D.J., Grob P., Stanley R.E., Nogales E., and Hurley J.H.. 2014. Architecture and dynamics of the autophagic phosphatidylinositol 3-kinase complex. eLife. 3 e05115 10.7554/eLife.05115 - DOI - PMC - PubMed
    1. Bento C.F., Renna M., Ghislat G., Puri C., Ashkenazi A., Vicinanza M., Menzies F.M., and Rubinsztein D.C.. 2016. Mammalian Autophagy: How Does It Work? Annu. Rev. Biochem. 85:685–713. 10.1146/annurev-biochem-060815-014556 - DOI - PubMed

Publication types

MeSH terms