. 2020 May 1;143(5):1555-1571.
doi: 10.1093/brain/awaa097.

Redefining the multidimensional clinical phenotypes of frontotemporal lobar degeneration syndromes

Affiliations

Redefining the multidimensional clinical phenotypes of frontotemporal lobar degeneration syndromes

Alexander G Murley et al. Brain. .

Abstract

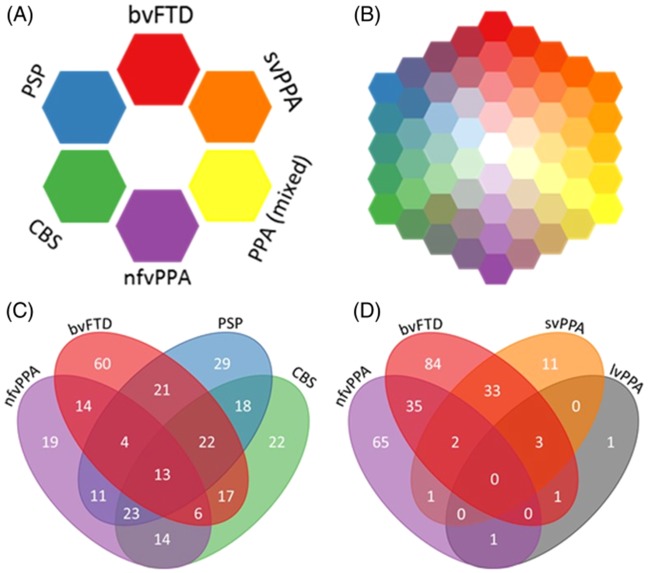
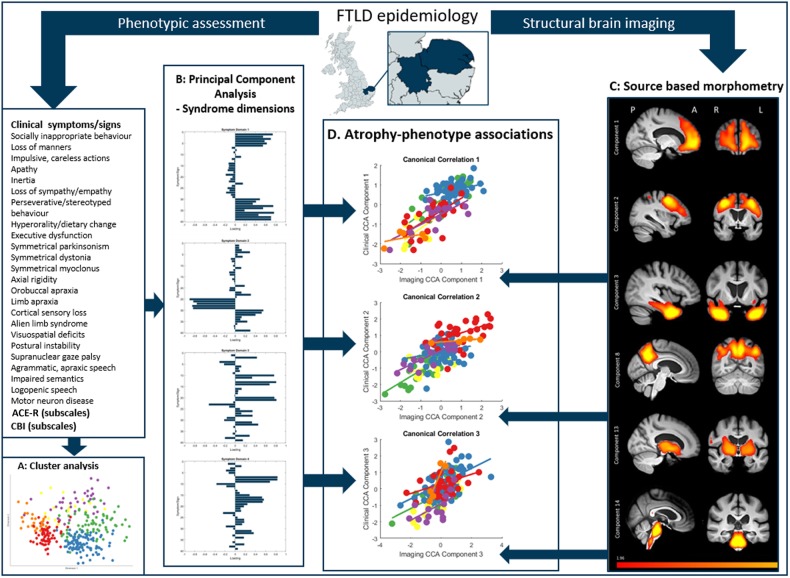
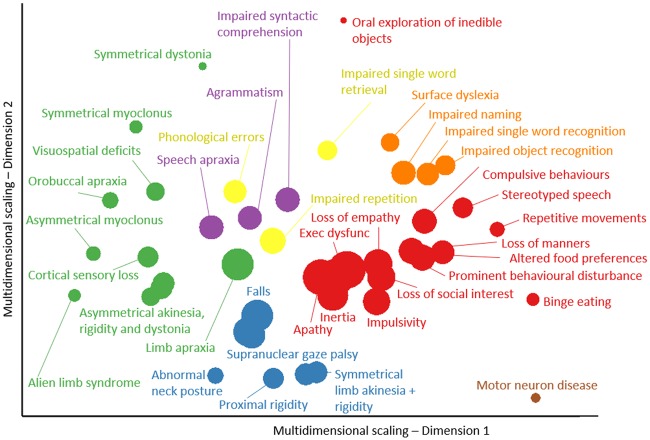
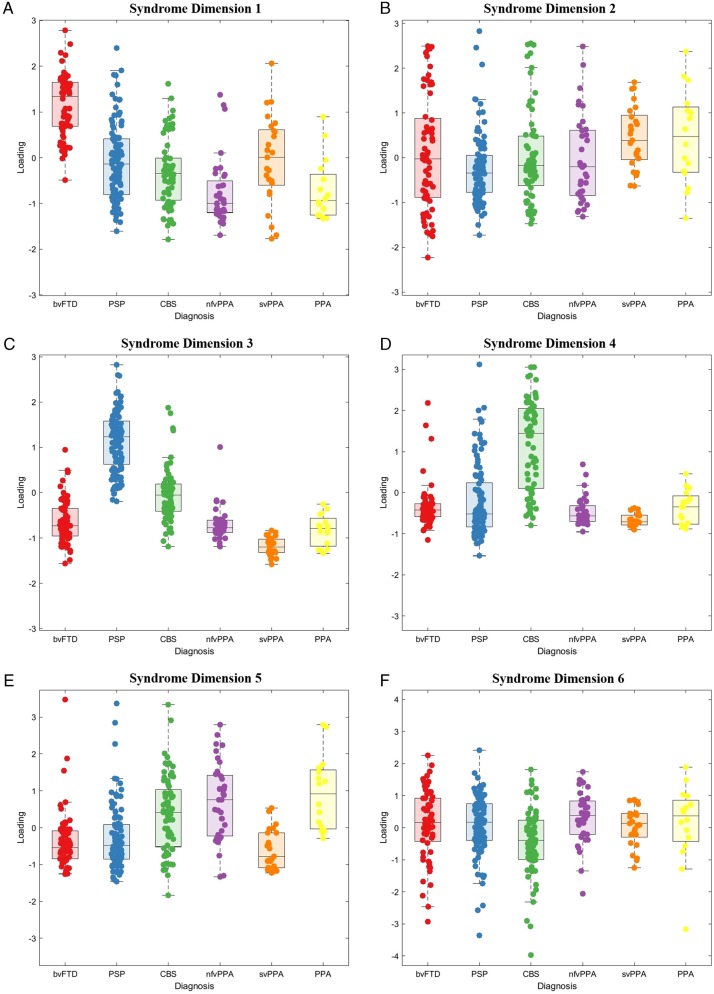
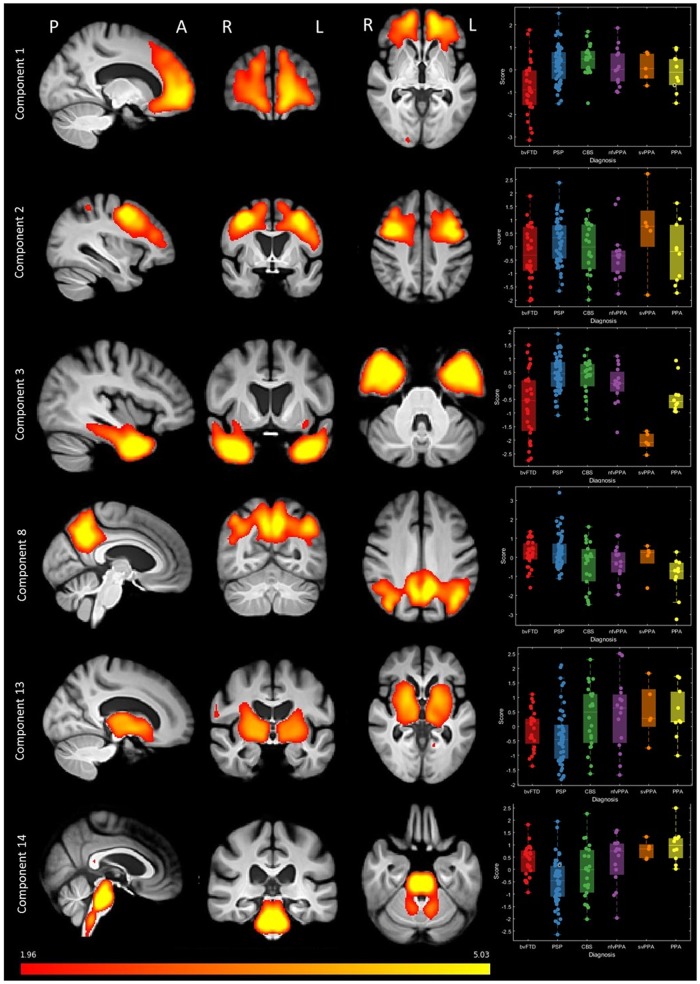
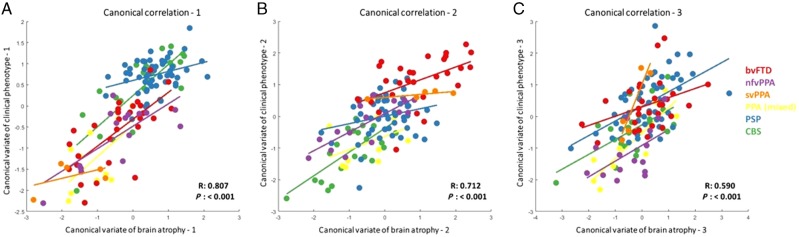
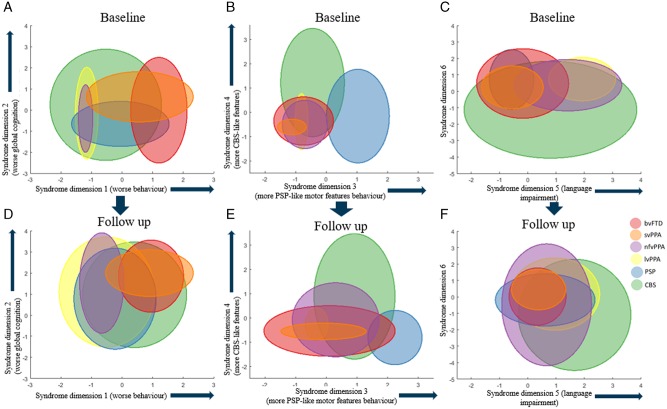
The syndromes caused by frontotemporal lobar degeneration have highly heterogeneous and overlapping clinical features. There has been great progress in the refinement of clinical diagnostic criteria in the past decade, but we propose that a better understanding of aetiology, pathophysiology and symptomatic treatments can arise from a transdiagnostic approach to clinical phenotype and brain morphometry. In a cross-sectional epidemiological study, we examined 310 patients with a syndrome likely to be caused by frontotemporal lobar degeneration, including behavioural variant frontotemporal dementia, non-fluent, and semantic variants of primary progressive aphasia (PPA), progressive supranuclear palsy and corticobasal syndrome. We included patients with logopenic PPA and those who met criteria for PPA but not a specific subtype. To date, 49 patients have a neuropathological diagnosis. A principal component analysis identified symptom dimensions that broadly recapitulated the core features of the main clinical syndromes. However, the subject-specific scores on these dimensions showed considerable overlap across the diagnostic groups. Sixty-two per cent of participants had phenotypic features that met the diagnostic criteria for more than one syndrome. Behavioural disturbance was prevalent in all groups. Forty-four per cent of patients with corticobasal syndrome had progressive supranuclear palsy-like features and 30% of patients with progressive supranuclear palsy had corticobasal syndrome-like features. Many patients with progressive supranuclear palsy and corticobasal syndrome had language impairments consistent with non-fluent variant PPA while patients with behavioural variant frontotemporal dementia often had semantic impairments. Using multivariate source-based morphometry on a subset of patients (n = 133), we identified patterns of covarying brain atrophy that were represented across the diagnostic groups. Canonical correlation analysis of clinical and imaging components found three key brain-behaviour relationships, with a continuous spectrum across the cohort rather than discrete diagnostic entities. In the 46 patients with follow-up (mean 3.6 years) syndromic overlap increased with time. Together, these results show that syndromes associated with frontotemporal lobar degeneration do not form discrete mutually exclusive categories from their clinical features or structural brain changes, but instead exist in a multidimensional spectrum. Patients often manifest diagnostic features of multiple disorders while deficits in behaviour, movement and language domains are not confined to specific diagnostic groups. It is important to recognize individual differences in clinical phenotype, both for clinical management and to understand pathogenic mechanisms. We suggest that a transdiagnostic approach to the spectrum of frontotemporal lobar degeneration syndromes provides a useful framework with which to understand disease aetiology, progression, and heterogeneity and to target future treatments to a higher proportion of patients.

Keywords: corticobasal syndrome; frontotemporal dementia; primary progressive aphasia; progressive supranuclear palsy; semantic dementia.


Figures

Figure 1
Figure 1
The FTLD syndrome spectrum. (A) Schematic of current diagnostic criteria. (B) Schematic to highlight our hypothesis that FTLD syndromes occur on a spectrum. (C and D) Four-way Venn diagrams of overlap between FTLD syndromes in the study. The numbers in each oval refer to the number of patients who met the diagnostic criteria for those syndromes. Many patients met the diagnostic criteria for two or more syndromes. (C) Overlap between bvFTD, nfvPPA, PSP and CBS. (D) Overlap between bvFTD, nfvPPA, svPPA and lvPPA.
Figure 2
Figure 2
Schematic of data processing. First, patients were recruited from the study catchment area for phenotypic assessment and structural brain imaging. Second, a cluster analysis was performed on clinical features. Third, we performed PCA on all clinical features to find latent syndrome dimensions across FTLD. Fourth, we used source-based morphometry (independent component analysis on grey and white matter) to create atrophy components. Finally, we explored the relationship between phenotype (syndrome dimensions from the PCA) and brain structure (source-based morphometry imaging components) using canonical correlation analysis. A = anterior; L = left; P = posterior; R = right.
Figure 3
Figure 3
Cluster analysis and multidimensional scaling of behavioural, language and motor impairments in FTLD. Each feature is colour-coded by FTLD subtype (same colour codes as Fig. 1) based on the primary diagnostic criteria to which the symptom contributes. The size of each point is scaled based on its prevalence in the cohort (larger icons have a higher prevalence). Symptoms from each FTLD syndrome cluster together, but many features are also closely located to those from other syndromes.
Figure 4
Figure 4
Principal component analysis scores of clinical features in FTLD syndromes. Six principal components (AF) were selected. (A) Syndrome dimension 1: clinician and carer ratings of behavioural impairment. (B) Syndrome dimension 2: global cognitive impairment, composed of all ACE-R subscores. (C) Syndrome dimension 3: supranuclear gaze palsy, postural stability and symmetrical rigidity (positive loading) and semantic language impairment (negative loading). (D) Syndrome dimension 4: asymmetrical parkinsonism, dystonia, myoclonus with limb apraxia, cortical sensory loss and alien limb syndrome. (E) Syndrome dimension 5: agrammatic, apraxic and logopenic language impairments. (F) Syndrome dimension 6: carer ratings of low mood and abnormal beliefs.
Figure 5
Figure 5
Source-based morphometry (based on independent component analysis) of combined grey and white matter. A subset of components is shown (all components are provided in the Supplementary material). Fifteen components were selected, each representing a region of independently covarying grey and white matter atrophy. Images are standardized group spatial maps for each component, superimposed on an average of all brain images. The scatter-box plots show the standardized subject loading coefficients, grouped by FTLD syndrome subtype.
Figure 6
Figure 6
Structure-phenotype associations using canonical correlation analysis with phenotypic (syndrome dimensions from PCA) and structural (atrophy components from source-based morphometry) information. Three canonical correlation components were selected, each composed of multiple imaging and clinical phenotype components. (A) First canonical correlation. Atrophy in the motor cortex and brainstem had the greatest loading onto the imaging component. Syndrome dimensions 3 (PSP-like motor features) and 4 (CBS-like motor features) had positive loadings and syndrome dimension 2 (global cognitive impairment) had negative loading on the clinical component. (B) Second canonical correlation. Atrophy in the frontal and temporal lobes had the greatest loading on the imaging component. On the clinical component, syndrome dimension one (behavioural impairment) had positive loadings. (C) Third canonical correlation. A spread of cortical and subcortical atrophy components loaded on the imaging component and syndrome dimensions 1–3 contributed to the clinical component. Plots of loadings onto all imaging and clinical components are provided in the Supplementary material.
Figure 7
Figure 7
Longitudinal phenotype information. A subset of patients was assessed at two time points. Three arbitrary pairs of syndrome dimensions are given to illustrate the convergence of clinical phenotype in syndrome dimensions at follow-up. Each ellipse shows the 95% confidence intervals of the syndrome dimension scores for each FTLD subgroup at baseline and follow-up. At follow-up there was greater overlap across all FTLD syndromes in all syndrome dimensions.

Comment in

References

    1. Alexander SK, Rittman T, Xuereb JH, Bak TH, Hodges JR, Rowe JB.. Validation of the new consensus criteria for the diagnosis of corticobasal degeneration. J Neurol Neurosurg Psychiatry 2014; 85: 925–9. - PMC - PubMed
    1. Armstrong MJ, Litvan I, Lang AE, Bak TH, Bhatia KP, Borroni B, et al.Criteria for the diagnosis of corticobasal degeneration. Neurology 2013; 80: 496–503. - PMC - PubMed
    1. Bensimon G, Ludolph A, Agid Y, Vidailhet M, Payan C, Leigh PN.. Riluzole treatment, survival and diagnostic criteria in Parkinson plus disorders: the NNIPPS Study. Brain 2009; 132: 156–71. - PMC - PubMed
    1. Bevan-Jones WR, Cope TE, Jones PS, Passamonti L, Hong YT, Fryer TD, et al.[18F]AV-1451 binding in vivo mirrors the expected distribution of TDP-43 pathology in the semantic variant of primary progressive aphasia. J Neurol Neurosurg Psychiatry 2017; 89: 1032–7. - PMC - PubMed
    1. Bevan-Jones WR, Cope TE, Jones PS, Passamonti L, Hong YT, Fryer TD, et al. Neuroinflammation and protein aggregation co-localize across the frontotemporal dementia spectrum. Brain 2020; 143: 1010–26. - PMC - PubMed

Publication types