

A novel statistical method for modeling covariate effects in bisulfite sequencing derived measures of DNA methylation
- PMID: 32438470
- PMCID: PMC8359306
- DOI: 10.1111/biom.13307
A novel statistical method for modeling covariate effects in bisulfite sequencing derived measures of DNA methylation
Abstract
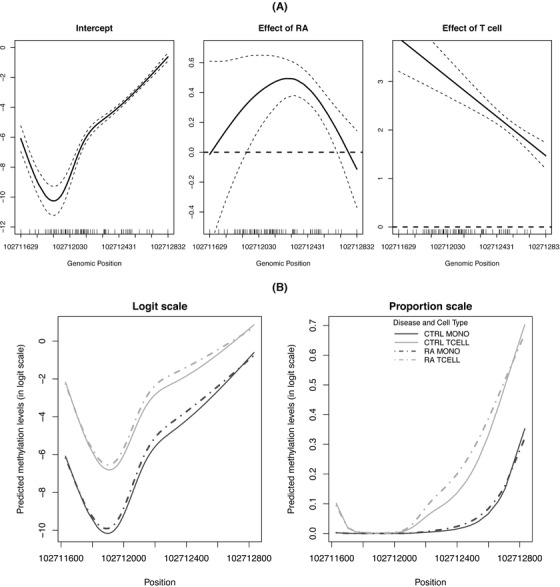
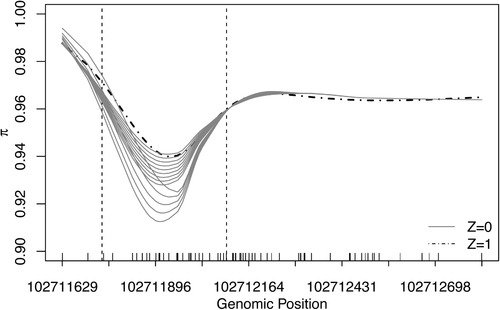
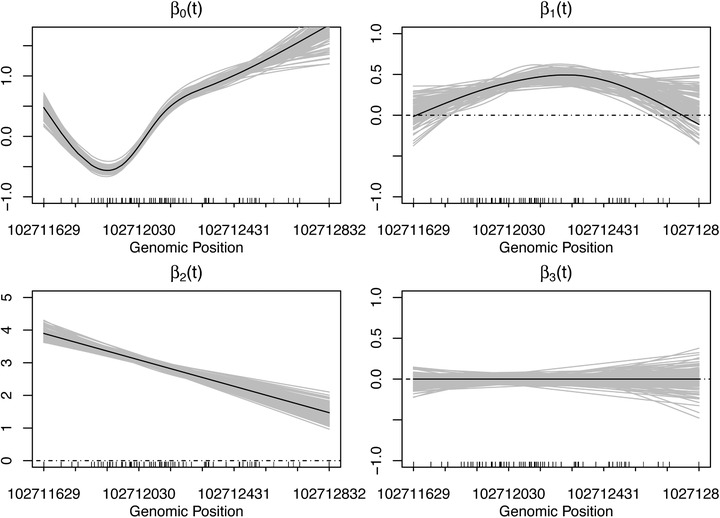
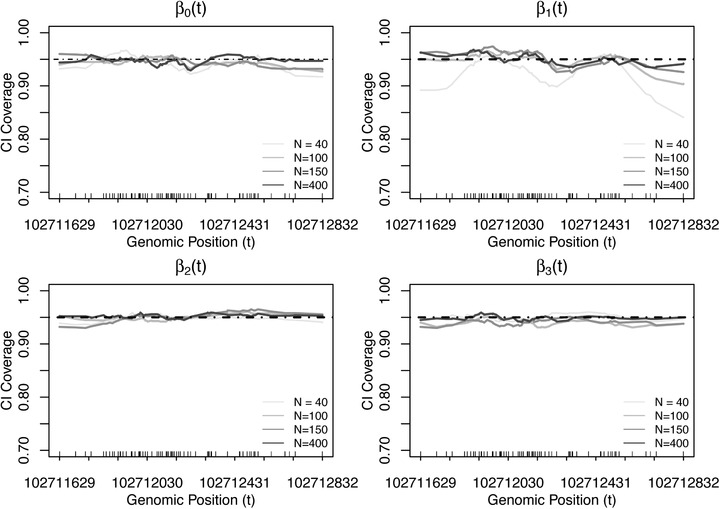
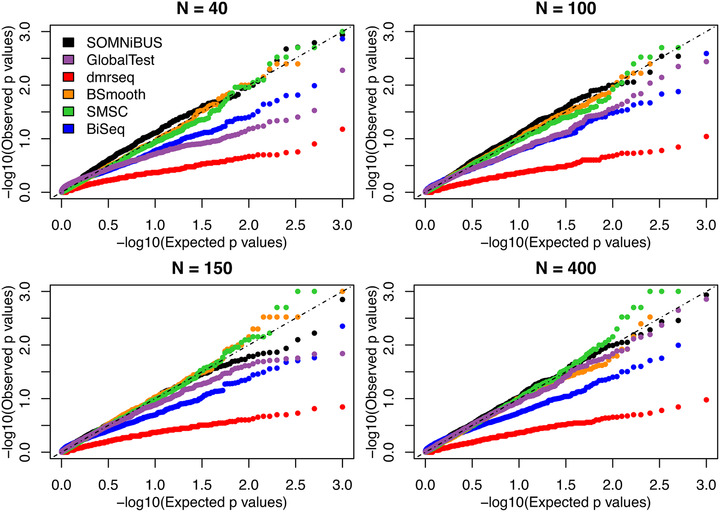
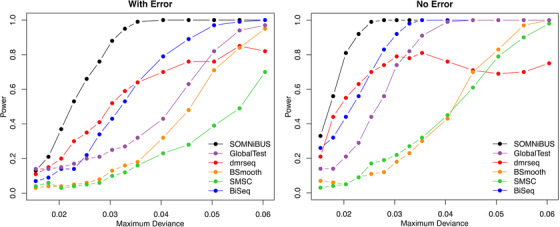
Identifying disease-associated changes in DNA methylation can help us gain a better understanding of disease etiology. Bisulfite sequencing allows the generation of high-throughput methylation profiles at single-base resolution of DNA. However, optimally modeling and analyzing these sparse and discrete sequencing data is still very challenging due to variable read depth, missing data patterns, long-range correlations, data errors, and confounding from cell type mixtures. We propose a regression-based hierarchical model that allows covariate effects to vary smoothly along genomic positions and we have built a specialized EM algorithm, which explicitly allows for experimental errors and cell type mixtures, to make inference about smooth covariate effects in the model. Simulations show that the proposed method provides accurate estimates of covariate effects and captures the major underlying methylation patterns with excellent power. We also apply our method to analyze data from rheumatoid arthritis patients and controls. The method has been implemented in R package SOMNiBUS.
Keywords: EM algorithm; differentially methylated region; generalized additive model; next-generation sequencing; penalized regression splines.
© 2020 The Authors. Biometrics published by Wiley Periodicals, Inc. on behalf of International Biometric Society.
Figures
References
-
- Allum, F., Shao, X., Guénard, F., Simon, M.‐M., Busche, S., Caron, M., Lambourne, J., Lessard, J., Tandre, K., Hedman, A.K., Kwan, T., Ge, B., Rönnblom, L., McCarthy, M.I., Deloukas, P., Richmond, T., Burgess, D., Spector, T.D., Tchernof, A., Marceau, S., Lathrop, M., Vohl, M.‐C., Pastinen, T., Grundberg, E. and Multiple Tissue Human Expression Resource Consortium , (2015) Characterization of functional methylomes by next‐generation capture sequencing identifies novel disease‐associated variants. Nature Communications, 6(1), 1–12. - PMC - PubMed
-
- Cheng, L. and Zhu, Y. (2013) A classification approach for DNA methylation profiling with bisulfite next‐generation sequencing data. Bioinformatics, 30(2), 172–179. - PubMed
-
- De Jager, P.L., Srivastava, G., Lunnon, K., Burgess, J., Schalkwyk, L.C., Yu, L., Eaton, M.L., Keenan, B.T., Ernst, J., McCabe, C., Tang, A., Raj, T., Replogle, J., Brodeur, W., Gabriel, S., Chai, H.S., Younkin, C., Younkin, S.G., Zou, F., Szyf, M., Epstein, C.B., Schneider, J.A., Bernstein, B.E., Meissner, A., Ertekin‐Taner, N., Chibnik, L.B., Kellis, M., Mill, J. and Bennett, D.A. (2014) Alzheimer's disease: early alterations in brain DNA methylation at ANK1, BIN1, RHBDF2 and other loci. Nature Neuroscience, 17(9), 1156–1163. - PMC - PubMed
-
- Dempster, A.P., Laird, N.M. and Rubin, D.B. (1977) Maximum likelihood from incomplete data via the EM algorithm. Journal of the Royal Statistical Society. Series B (Methodological), 39(1), 1–22.
-
- Feinberg, A.P. (2007) Phenotypic plasticity and the epigenetics of human disease. Nature, 447(7143), 433–440. - PubMed
Publication types
MeSH terms
Substances
Grants and funding
LinkOut - more resources
Full Text Sources
