

Trends over time in HIV prevalence among people who inject drugs in 89 large US metropolitan statistical areas, 1992-2013
- PMID: 32439148
- PMCID: PMC7430257
- DOI: 10.1016/j.annepidem.2020.03.011
Trends over time in HIV prevalence among people who inject drugs in 89 large US metropolitan statistical areas, 1992-2013
Abstract
Purpose: After years of stable or declining HIV prevalence and declining incidence among people who inject drugs (PWID) in the United States, some rapidly emerging outbreaks have recently occurred in new areas (e.g., Scott County, Indiana). However, to our knowledge, trends over time in HIV prevalence among PWID in US metropolitan statistical areas (MSAs) across all major regions of the country have not been systematically estimated beyond 2002, and the extent to which HIV prevalence may be increasing in other areas is largely unknown. This article estimates HIV prevalence among PWID in 89 of the most populated US MSAs, both overall and by geographic region, using more recent surveillance and HIV testing data.
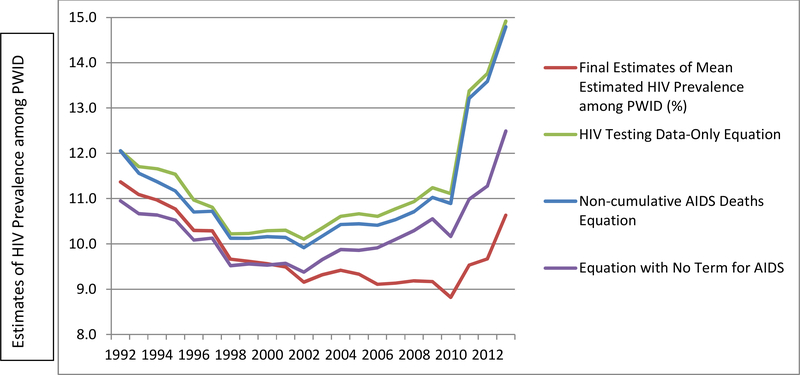
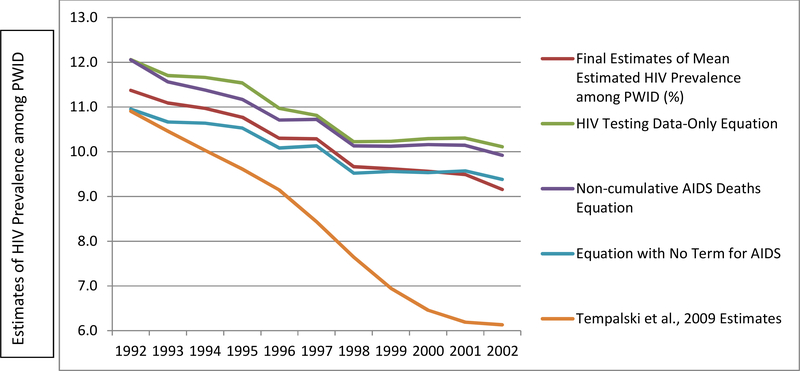
Methods: We computed MSA-specific annual estimates of HIV prevalence (both diagnosed and undiagnosed infections) among PWID for these 89 MSAs, for 1992-2013, using several data series from the Centers for Disease Control and Prevention's (CDC) National HIV Surveillance System and National HIV Prevention Monitoring and Evaluation data; Holmberg's (1997) estimates of 1992 PWID population size and of HIV prevalence and incidence among PWID; and research estimates from published literature using 1992-2013 data. A mixed effects model, with time nested within MSAs, was used to regress the literature review estimates on all of the other data series. Multiple imputation was used to address missing data. Resulting estimates were validated using previous 1992-2002 estimates of HIV prevalence and data on antiretroviral (ARV) prescription volumes and examined for patterns based on geographic region, numbers of people tested for HIV, and baseline HIV prevalence.
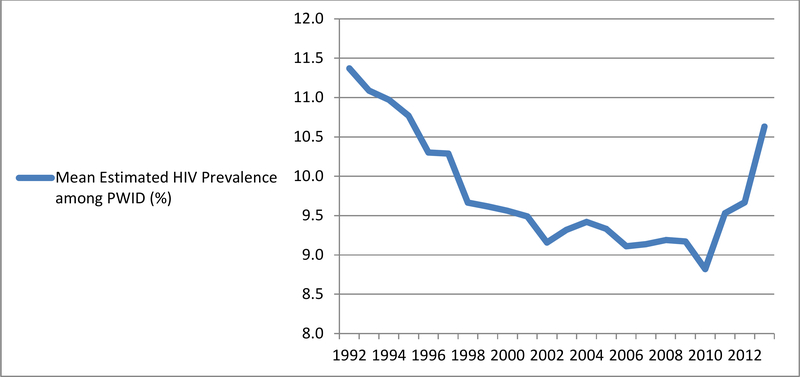
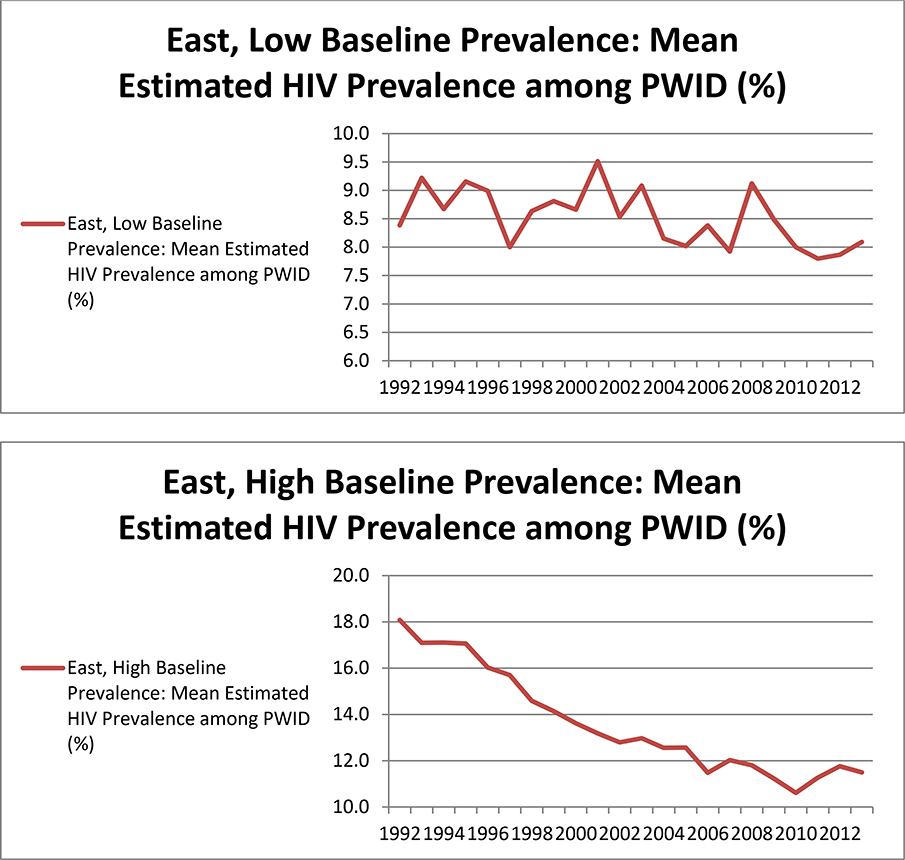
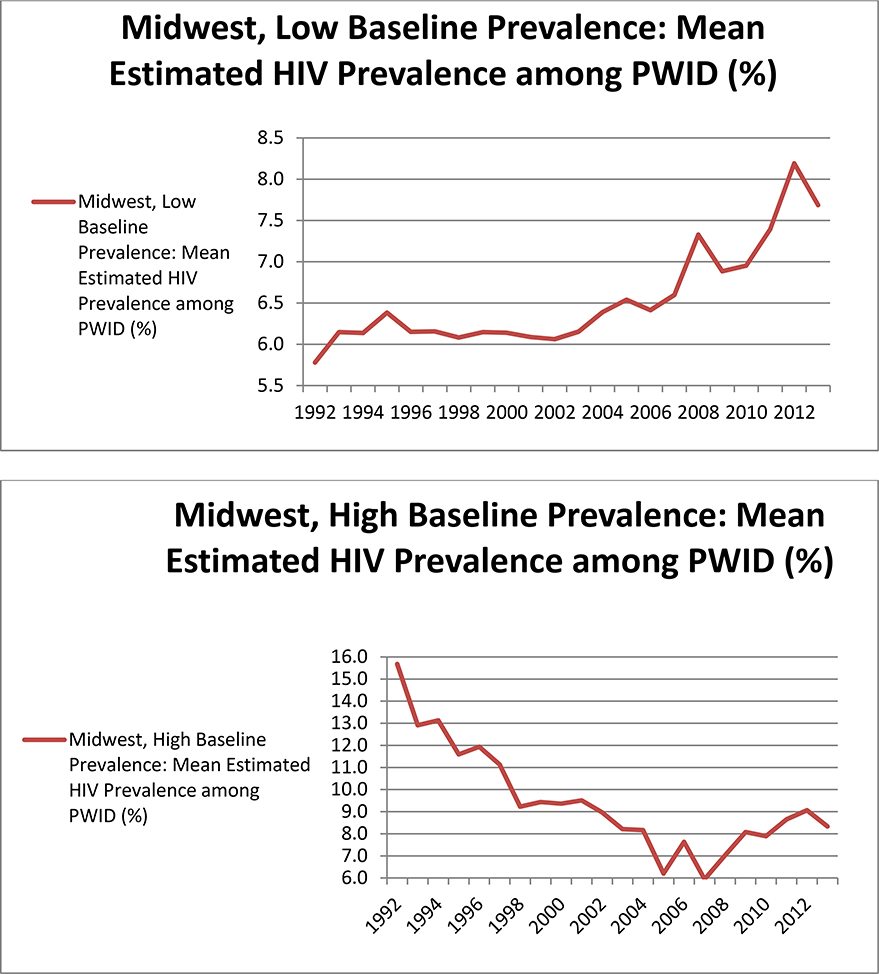
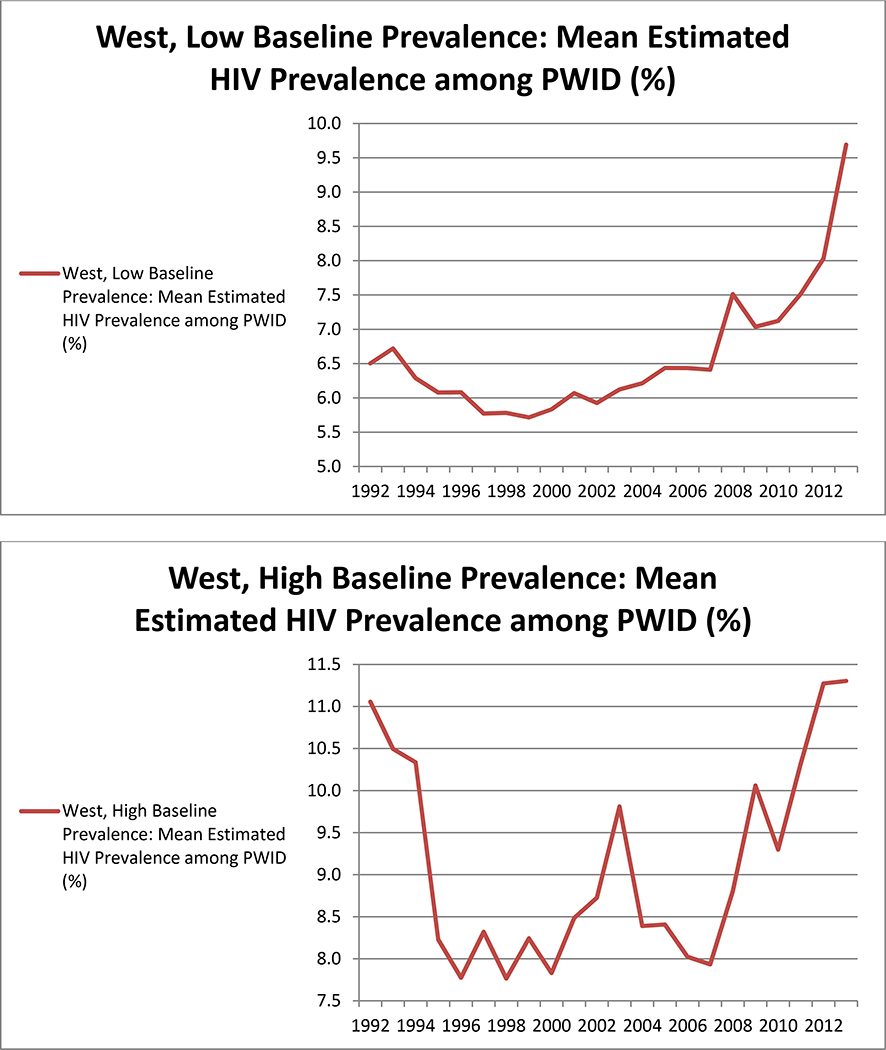
Results: Mean (across all MSAs) trends over time suggested decreases through 2002 (from approximately 11.4% in 1992 to 9.2% in 2002), followed by a period of stability, and steep increases after 2010 (to 10.6% in 2013). Validation analyses found a moderate positive correlation between our estimates and ARV prescription volumes (r = 0.45), and a very strong positive correlation (r = 0.94) between our estimates and previous estimates by Tempalski et al. (2009) for 1992-2002 (which used different methods). Analysis by region and baseline prevalence suggested that mean increases in later years were largely driven by MSAs in the Western United States and by MSAs in the Midwest that had low baseline prevalence. Our estimates suggest that prevalence decreased across all years in the Eastern United States. These trends were particularly clear when MSAs with very low numbers of people tested for HIV were removed from analyses to reduce unexplained variability in mean trajectories.
Conclusions: Our estimates suggest a fairly large degree of variation in 1992-2013 trajectories of PWID HIV prevalence among 89 US MSAs, particularly by geographic region. They suggest that public health responses in many MSAs (particularly those with larger HIV prevalence among PWID in the early 1990s) were sufficient to decrease or maintain HIV prevalence over time. However, future research should investigate potential factors driving the estimated increase in prevalence after 2002 MSAs in the West and Midwest. These findings have potentially important implications for program and/or policy decisions, but estimates for MSAs with low HIV testing denominators should be interpreted with caution and verified locally before planning action.
Keywords: HIV prevalence; Metropolitan statistical areas; People who Inject Drugs.
Copyright © 2020 Elsevier Inc. All rights reserved.
Conflict of interest statement
The authors have no Conflicts of Interest to report.
Figures
References
Data Citations
-
- Centers for Disease Control and Prevention. National HIV Prevention Monitoring and Evaluation data (CDC NHM&E) 1992–2013. Division of HIV/AIDS Prevention. National Center for HIV/AIDS, Viral Hepatitis, STD, and TB Prevention.
-
- Centers for Disease Control and Prevention. Expanded Testing Program Initiative (ETP) data 2008–2013.Division of HIV/AIDS Prevention. National Center for HIV/AIDS, Viral Hepatitis, STD, and TB Prevention.
-
- Centers for Disease Control and Prevention. National HIV Surveillance System data (1992–2017). Division of HIV/AIDS Prevention. National Center for HIV/AIDS, Viral Hepatitis, STD, and TB Prevention.
-
- Centers for Disease Control and Prevention. National HIV Behavioral Surveillance data (2017). Division of HIV/AIDS Prevention, National Center for HIV/AIDS, Viral Hepatitis, Sexual Transmitted Diseases and Tuberculosis Prevention.
References
-
- Centers for Disease Control and Prevention. HIV Surveillance Report, 2016; vol. 28 http://www.cdc.gov/hiv/library/reports/hiv-surveillance.html Published November 2017.
-
- Centers for Disease Control and Prevention. HIV infection and risk, prevention, and testing behaviors among injecting drug users—National HIV Behavioral Surveillance System, 20 US cities, 2009. 2014. 1546–0738. - PubMed
-
- Centers for Disease Control and Prevention. HIV Infection, Risk, Prevention, and Testing Behaviors among Persons Who Inject Drugs—National HIV Behavioral Surveillance: Injection Drug Use, 20 U.S. Cities, 2012. 2015.
-
- Centers for Disease Control and Prevention. HIV Infection, Risk, Prevention, and Testing Behaviors among Persons Who Inject Drugs—National HIV Behavioral Surveillance: Injection Drug Use, 20 U.S. Cities, 2015. 2017.
Publication types
MeSH terms
Grants and funding
LinkOut - more resources
Full Text Sources
Medical
