. 2020 Jun 19;368(6497):1371-1376.
doi: 10.1126/science.aax0860. Epub 2020 May 21.

T cells with dysfunctional mitochondria induce multimorbidity and premature senescence

Affiliations

T cells with dysfunctional mitochondria induce multimorbidity and premature senescence

Gabriela Desdín-Micó et al. Science. .

Abstract

The effect of immunometabolism on age-associated diseases remains uncertain. In this work, we show that T cells with dysfunctional mitochondria owing to mitochondrial transcription factor A (TFAM) deficiency act as accelerators of senescence. In mice, these cells instigate multiple aging-related features, including metabolic, cognitive, physical, and cardiovascular alterations, which together result in premature death. T cell metabolic failure induces the accumulation of circulating cytokines, which resembles the chronic inflammation that is characteristic of aging ("inflammaging"). This cytokine storm itself acts as a systemic inducer of senescence. Blocking tumor necrosis factor-α signaling or preventing senescence with nicotinamide adenine dinucleotide precursors partially rescues premature aging in mice with Tfam-deficient T cells. Thus, T cells can regulate organismal fitness and life span, which highlights the importance of tight immunometabolic control in both aging and the onset of age-associated diseases.


Conflict of interest statement

Competing interests

The authors declare no competing interests.

Figures

Fig. 1
Fig. 1. Mitochondrial dysfunction in T cells causes premature aging.
(A) Tfam, mtCo1 and mtNd1 mRNA levels in peripheral blood CD4+ T cells from young (2-month-old) Tfamfl/fl and Tfamfl/fl Cd4Cre mice, and old (22-month-old) wt mice (n = 6-9 mice per group). (B) Oxygen consumption rates (OCR) in activated CD4+ T cells from Tfamfl/fl, Tfamfl/fl Cd4Cre and old wt animals (left). Basal respiration (center) and maximal respiratory capacity (right) are shown (n = 3-4). (C) Lactate content in the supernatant of activated CD4+ T cells (n = 3-4). (D) Percentages of CD4+ (left) and CD8+ (right) T cells positive for the Th1 cell transcription factor T-bet (n = 5-14). (E) Percentages of CD4+CD44hi T cells staining positive for intracellular IFN-γ and TNF-α (n = 3-9). (F) Post-infection survival curves (left panel) for Tfamfl/fl, Tfamfl/fl Cd4Cre and old wt mice inoculated s.c. with ECTV (103 PFUs per mouse). ECTV-infected mice were monitored daily for clinical signs of illness (center) and change from initial body weight (right). Signs of illness are expressed as means ± SEM using an individual score ranging from 0 for healthy animals to 4 for severely diseased animals (n = 5-7). (G) Serum levels of inflammatory cytokines IL-6 and TNF-α detected by Multiplex in 7-month-old Tfamfl/fl and Tfamfl/fl Cd4Cre mice and 22-month-old wt mice (n = 10-19). (H) Representative photograph showing the deteriorated physical appearance of a Tfamfl/fl Cd4Cre mouse (right) compared with a control littermate (left), both aged 7 months. (I) Hematological parameters in Tfamfl/fl Cd4Cre and Tfamfl/fl mice (n = 8-11, 5 months old). (J) Quantification of spine curvature by computed tomography (CT) scans (left) and percentage of mice presenting lordokyphosis (right) in 5-month-old Tfamfl/fl Cd4Cre mice (n = 7-8). (K) Body weight evolution in Tfamfl/fl and Tfamfl/fl Cd4Cre female (left) and male (right) mice (n = 8-20). (L) Representative skin sections stained with Masson trichrome (left) and quantification of hypodermal fat thickness (right). At least 10 measurements were performed per animal. The graph shows mean values for n = 7, 7 months of age. Scale bar: 100 μm. (M) Activity time course over a 24-hour cycle (left) and mean dark period activity (center) and speed (right) assessed in metabolic cages (n = 6-9, 7-month-old mice). Bar graphs correspond to the dark (active) period. (N) Kaplan-Meier survival curves for Tfamfl/fl and Tfamfl/fl Cd4Cre mice (n = 36-38, including males and females). Dots in all panels represent individual sample data. Data are presented as means ± SEM. Statistical analysis was by one-way analysis of variance (ANOVA) with post hoc Tukey’s correction [A (mtCo1 and mtNd1), C, D and G (TNF-α)]; Kruskal–Wallis H test with post hoc Dunn’s correction [A (Tfam), B and G (IL-6)], unpaired Student’s t-test [I (MCV), J, K and M]; or unpaired Welch’s t-test [L and I (Hemoglobin)]. *p<0.05, **p<0.01, ***p<0.001, ****p<0.0001. Survival curve data were analyzed by log-rank (Mantel-Cox test) [F and N]. For the ECTV experiment, data correspond to one representative experiment of two.
Fig. 2
Fig. 2. Tfamfl/fl Cd4Cre mice develop age-associated multimorbidity.
(A) Representative haematoxylin and eosin (H&E)-stained sections of gastrocnemius muscle (left, scale bar: 50 μm) and quantification of myofiber cross-sectional area (right). At least 10 measurements were performed per animal. The graph shows mean fiber area for n = 6 animals per group (7-month-old mice). (B) In vivo positron emission tomography and computed tomography analysis of skeletal muscle glucose uptake. Data are mean ± SEM of 18F-FDG activity (n = 5, 4-month-old mice). SUV, standard uptake. (C) Forelimb grip strength analysis (n = 10-11, 7-month-old mice). (D) Relative mRNA levels of genes related to muscle proteolysis (MuRF-1 and Atrogin-1) and inflammation (Stat1 and IL-6) (n = 7-8, 7-month-old mice). (E) Representative H&E stained sections of gWAT from Tfamfl/fl Cd4Cre and Tfamfl/fl mice (left, scale bar: 50 μm). The graph (right) shows mean estimated adipocyte surface area. Ten measurements were performed per animal (n = 5-6 animals, 7-month-old mice). (F) Percentage of adipose tissue determined by quantitative magnetic resonance imaging in Tfamfl/fl Cd4Cre and Tfamfl/fl mice (n = 6, 7-month-old mice). (G) Immunoblot (left) and densitometry analysis (right) of ATGL protein expression in gWAT isolated from Tfamfl/fl CD4Cre mice and control littermates (n = 6, 7-month-old mice). (H) Plasma non-esterified fatty acids (NEFA) (n = 7, 4-month-old mice). (I) Representative H&E-stained heart sections from 15-month-old Tfamfl/fl Cd4Cre and Tfamfl/fl mice. Scale bar: 2.5 mm (J) Echocardiography measurements of left ventricular (LV) mass in 3- and 15-month-old Tfamfl/fl and Tfamfl/fl Cd4Cre mice (n = 5-12). (K) Heart rate in 3-month-old Tfamfl/fl Cd4Cre mice and control littermates (n = 9-10). (L) Cardiac output in 3- and 15-month-old Tfamfl/fl and Tfamfl/fl Cd4Cre mice (n = 5-11). (M) Lung weight normalized to tibia length in Tfamfl/fl and Tfamfl/fl Cd4Cre mice (n = 7-11, 7-month-old mice). (N) Mitral flow pattern on echocardiography in 3- and 15-month-old Tfamfl/fl and Tfamfl/fl Cd4Cre mice (n = 5-6). (O) Representative ultrasound images depicting maximal ascending aorta diameters in 15-month-old Tfamfl/fl and Tfamfl/fl Cd4Cre mice (left, scale bar: 1 mm) and quantification of maximal aortic diameter in 3- and 15-month-old Tfamfl/fl and Tfamfl/fl Cd4Cre mice (right) (n = 6-8). Maximal aortic diameter is presented in box-and-whisker plots showing maximal and minimal values and 75th and 25th percentiles. (P) RT-qPCR analysis of Nos2, Acta2, and Myh11 mRNA expression levels in aortic samples from 7-month-old Tfamfl/fl and Tfamfl/fl Cd4Cre mice (n = 4). (Q) Systolic and diastolic blood pressure in 3-month-old Tfamfl/fl and Tfamfl/fl Cd4Cre mice (n = 9-10). (R) Representative CD3-stained brain (fornix) sections from 15-month-old Tfamfl/fl and Tfamfl/fl Cd4Cre mice (scale bar: 25 μm) and quantification of CD3 positive cell density (n = 6-10). (S) Rotarod test performance by Tfamfl/fl and Tfamfl/fl Cd4Cre mice, expressed as the mean time spent on the rotating rod in each of three trials (left) and all trials combined (right) (n = 7-10, 12-month-old mice). (T) Maximum clasping score per 30 s test (n = 8-9, 12-month-old mice). Dots in all panels represent individual sample data. Data are presented as means ± SEM. Box plots represent the median and the 25th and 75th percentiles. Statistical analysis was by unpaired Student’s t-test [A to C, D (MuRF-1, Atrogin, IL-6), F to L, N and O (15mo), P, Q (Diastolic pressure) and S]; unpaired Welch’s t-test [D (Stat1), M and N and O (3mo)]; or nonparametric Mann–Whitney U test [Q (Systolic pressure), R and T]. *p<0.05, **p<0.01, ***p<0.001, ****p<0.0001.
Fig. 3
Fig. 3. Inflammaging induces senescence in distal tissues of Tfamfl/fl Cd4Cre mice.
(A) Heatmap of senescence gene expression changes comparing liver from Tfamfl/fl Cd4Cre mice and control littermates. (B) Representative immunoblot (left) and quantification (right) of p21 and p53 protein expression in liver, heart, gWAT, and pancreas from Tfamfl/fl Cd4Cre and Tfamfl/fl mice. Loading controls were β-actin, H3, Hsp90 or α-tubulin (n = 4-7, 7-month-old mice) (C) Quantitative measurements of β-galactosidase activity in gWAT lysates by colorimetric assay (n = 6-9, 9-month-old mice). (D) Quantitative measurements of β-galactosidase activity in kidney lysates by colorimetric assay (n = 6-9, 12-month-old mice). (E) Immunoblot (left) and densitometry analysis (right) of p21 expression in immortalized mouse hepatocytes and 3T3-L1 cells cultured for 7 days in the presence of Tfamfl/fl or Tfamfl/fl Cd4Cre serum from 7-month-old mice. β-actin was used as a loading control (n = 4-6). Blots are representative of three (3T3-L1) or four (hepatocytes) experiments using pooled sera from three animals. (F) Representative immunoblot analysis of senescence markers in liver from control Tfamfl/fl and Tfamfl/fl Cd4Cre mice with or without treatment with anti-TNF-α (etanercept) (n = 6, 10 weeks of treatment starting from 4 months of age). (G) β-galactosidase activity measured by a colorimetric assay in kidney lysates (n = 6, 10 weeks of treatment). (H) Time course of forelimb strength during anti-TNF-α treatment. (I) Systolic blood pressure after 7 weeks of anti-TNF-α treatment (n = 6). (J) Maximal ascending aorta diameter in response to anti-TNF-α treatment (n = 6, 8 weeks of treatment). Maximal aortic diameter is presented in a box-and-whisker plots showing maximal and minimal values and 75th and 25th percentiles. (K) Y-Maze analysis in Tfamfl/fl Cd4Cre mice treated with anti-TNF-α and corresponding controls (n = 6, 8 weeks of treatment). (L-N) Immunoblot (left) and densitometry analysis (right) of p21 or p53 expression in liver (L), gWAT (M), and tibialis muscle (N) from Cd3e-/- mice 16 weeks after reconstitution with bone marrow from Tfamfl/fl Cd4Cre or Tfamfl/fl mice (n = 4-6 per group). Dots in all panels represent individual sample data. Data are presented as mean ± SEM. Statistical analysis was by one-way analysis of variance (ANOVA) with post hoc Tukey’s correction [G, I and K]; Kruskal–Wallis test with post hoc Dunn’s correction [J]; two-way ANOVA with post hoc Tukey’s correction [H]; unpaired Student’s t-test [B, C, D, E, L and M] or nonparametric Mann–Whitney U test [N]. *p<0.05, **p<0.01, ***p<0.001, ****p<0.0001.
Fig. 4
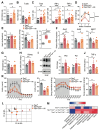
Fig. 4. Nicotinamide riboside (NR) treatment rescues the multimorbidity syndrome.
(A, B) NAD+/NADH ratio in liver (A) and in isolated CD4+ T cells (B) lysates from untreated Tfamfl/fl, Tfamfl/fl Cd4Cre, and NR-treated Tfamfl/fl Cd4Cre mice (n = 5-9 per group, 10-week treatment starting from 4 months of age). (C) FACS analysis of intracellular T-bet (left), IFN-γ (center) and TNF-α (right) in splenic CD4+ T cells (n = 8-17). (D) Effect of NR treatment on the evolution of forelimb strength (n = 5-11). (E) Heart rate (left), systolic blood pressure (center), and ascending aorta (AsAo) maximum diameter (right) obtained from ultrasound images after 8 weeks of NR treatment. Maximal aortic diameter is presented in a box-and-whisker plot showing the median and the 25th and 75th percentiles (n = 5-14). (F) RT-qPCR analysis of Nos2, Acta2, and Myh11 mRNA expression in aorta from untreated Tfamfl/fl, Tfamfl/fl Cd4Cre and, NR-treated Tfamfl/fl Cd4Cre mice (n = 4-6). (G) Blood hemoglobin levels (n = 4-7). (H) β-galactosidase activity measured by colorimetric assay in kidney lysates (n = 4-6). (I) Western blot (left) and densitometry analysis (right) of p21 and p53 expression in liver lysates from untreated Tfamfl/fl, Tfamfl/fl Cd4Cre and Tfamfl/fl Cd4Cre mice treated with NR for 10 weeks (n = 3-4). β-actin was used as a loading control. (J) Circulating TNF-α determined by Multiplex analysis in serum from untreated Tfamfl/fl, Tfamfl/fl Cd4Cre, and NR-treated Tfamfl/fl Cd4Cre mice (n = 5-8). (K) Activity (left) and energy expenditure (right) monitored over a 24-hour cycle in metabolic cages (n = 4-5). (L) Principal component (PC) analysis of transcriptomics in liver samples from untreated Tfamfl/fl, Tfamfl/fl Cd4Cre and Tfamfl/fl Cd4Cre mice treated with NR for 10 weeks (n = 3-4). (M) IPA heatmap showing transcriptionally altered cellular pathways. Dots in all panels represent individual sample data. Data are presented as mean ± SEM. Statistical analysis was by one-way analysis of variance (ANOVA) with post hoc Tuley’s correction [A to C, E (Maximal aortic diameter), G, H, I (p21), J and K (Energy expenditure)]; Kruskal-Wallis H test with post hoc Dunn’s correction [E (Heart rate and Systolic blood pressure), F, I (p53) and K (Activity)]; or two-way ANOVA with correction post hoc Tukey’s correction [D]. *p<0.05, **p<0.01, ***p<0.001, ****p<0.0001.

Comment in

References

    1. Tarasenko TN, et al. Cytochrome c Oxidase Activity Is a Metabolic Checkpoint that Regulates Cell Fate Decisions During T Cell Activation and Differentiation. Cell metabolism. 2017;25:1254–1268.:e1257. doi: 10.1016/j.cmet.2017.05.007. - DOI - PMC - PubMed
    1. Weinberg SE, et al. Mitochondrial complex III is essential for suppressive function of regulatory T cells. Nature. 2019 doi: 10.1038/s41586-018-0846-z. - DOI - PMC - PubMed
    1. Sena LA, et al. Mitochondria are required for antigen-specific T cell activation through reactive oxygen species signaling. Immunity. 2013;38:225–236. doi: 10.1016/j.immuni.2012.10.020. - DOI - PMC - PubMed
    1. Pearce EL, et al. Enhancing CD8 T-cell memory by modulating fatty acid metabolism. Nature. 2009;460:103–107. doi: 10.1038/nature08097. - DOI - PMC - PubMed
    1. Mills EL, Kelly B, O’Neill LAJ. Mitochondria are the powerhouses of immunity. Nat Immunol. 2017;18:488–498. - PubMed

Publication types

MeSH terms