

Prognostic Significance of Immune Cell Populations Identified by Machine Learning in Colorectal Cancer Using Routine Hematoxylin and Eosin-Stained Sections
- PMID: 32439699
- PMCID: PMC7442724
- DOI: 10.1158/1078-0432.CCR-20-0071
Prognostic Significance of Immune Cell Populations Identified by Machine Learning in Colorectal Cancer Using Routine Hematoxylin and Eosin-Stained Sections
Abstract
Purpose: Although high T-cell density is a well-established favorable prognostic factor in colorectal cancer, the prognostic significance of tumor-associated plasma cells, neutrophils, and eosinophils is less well-defined.
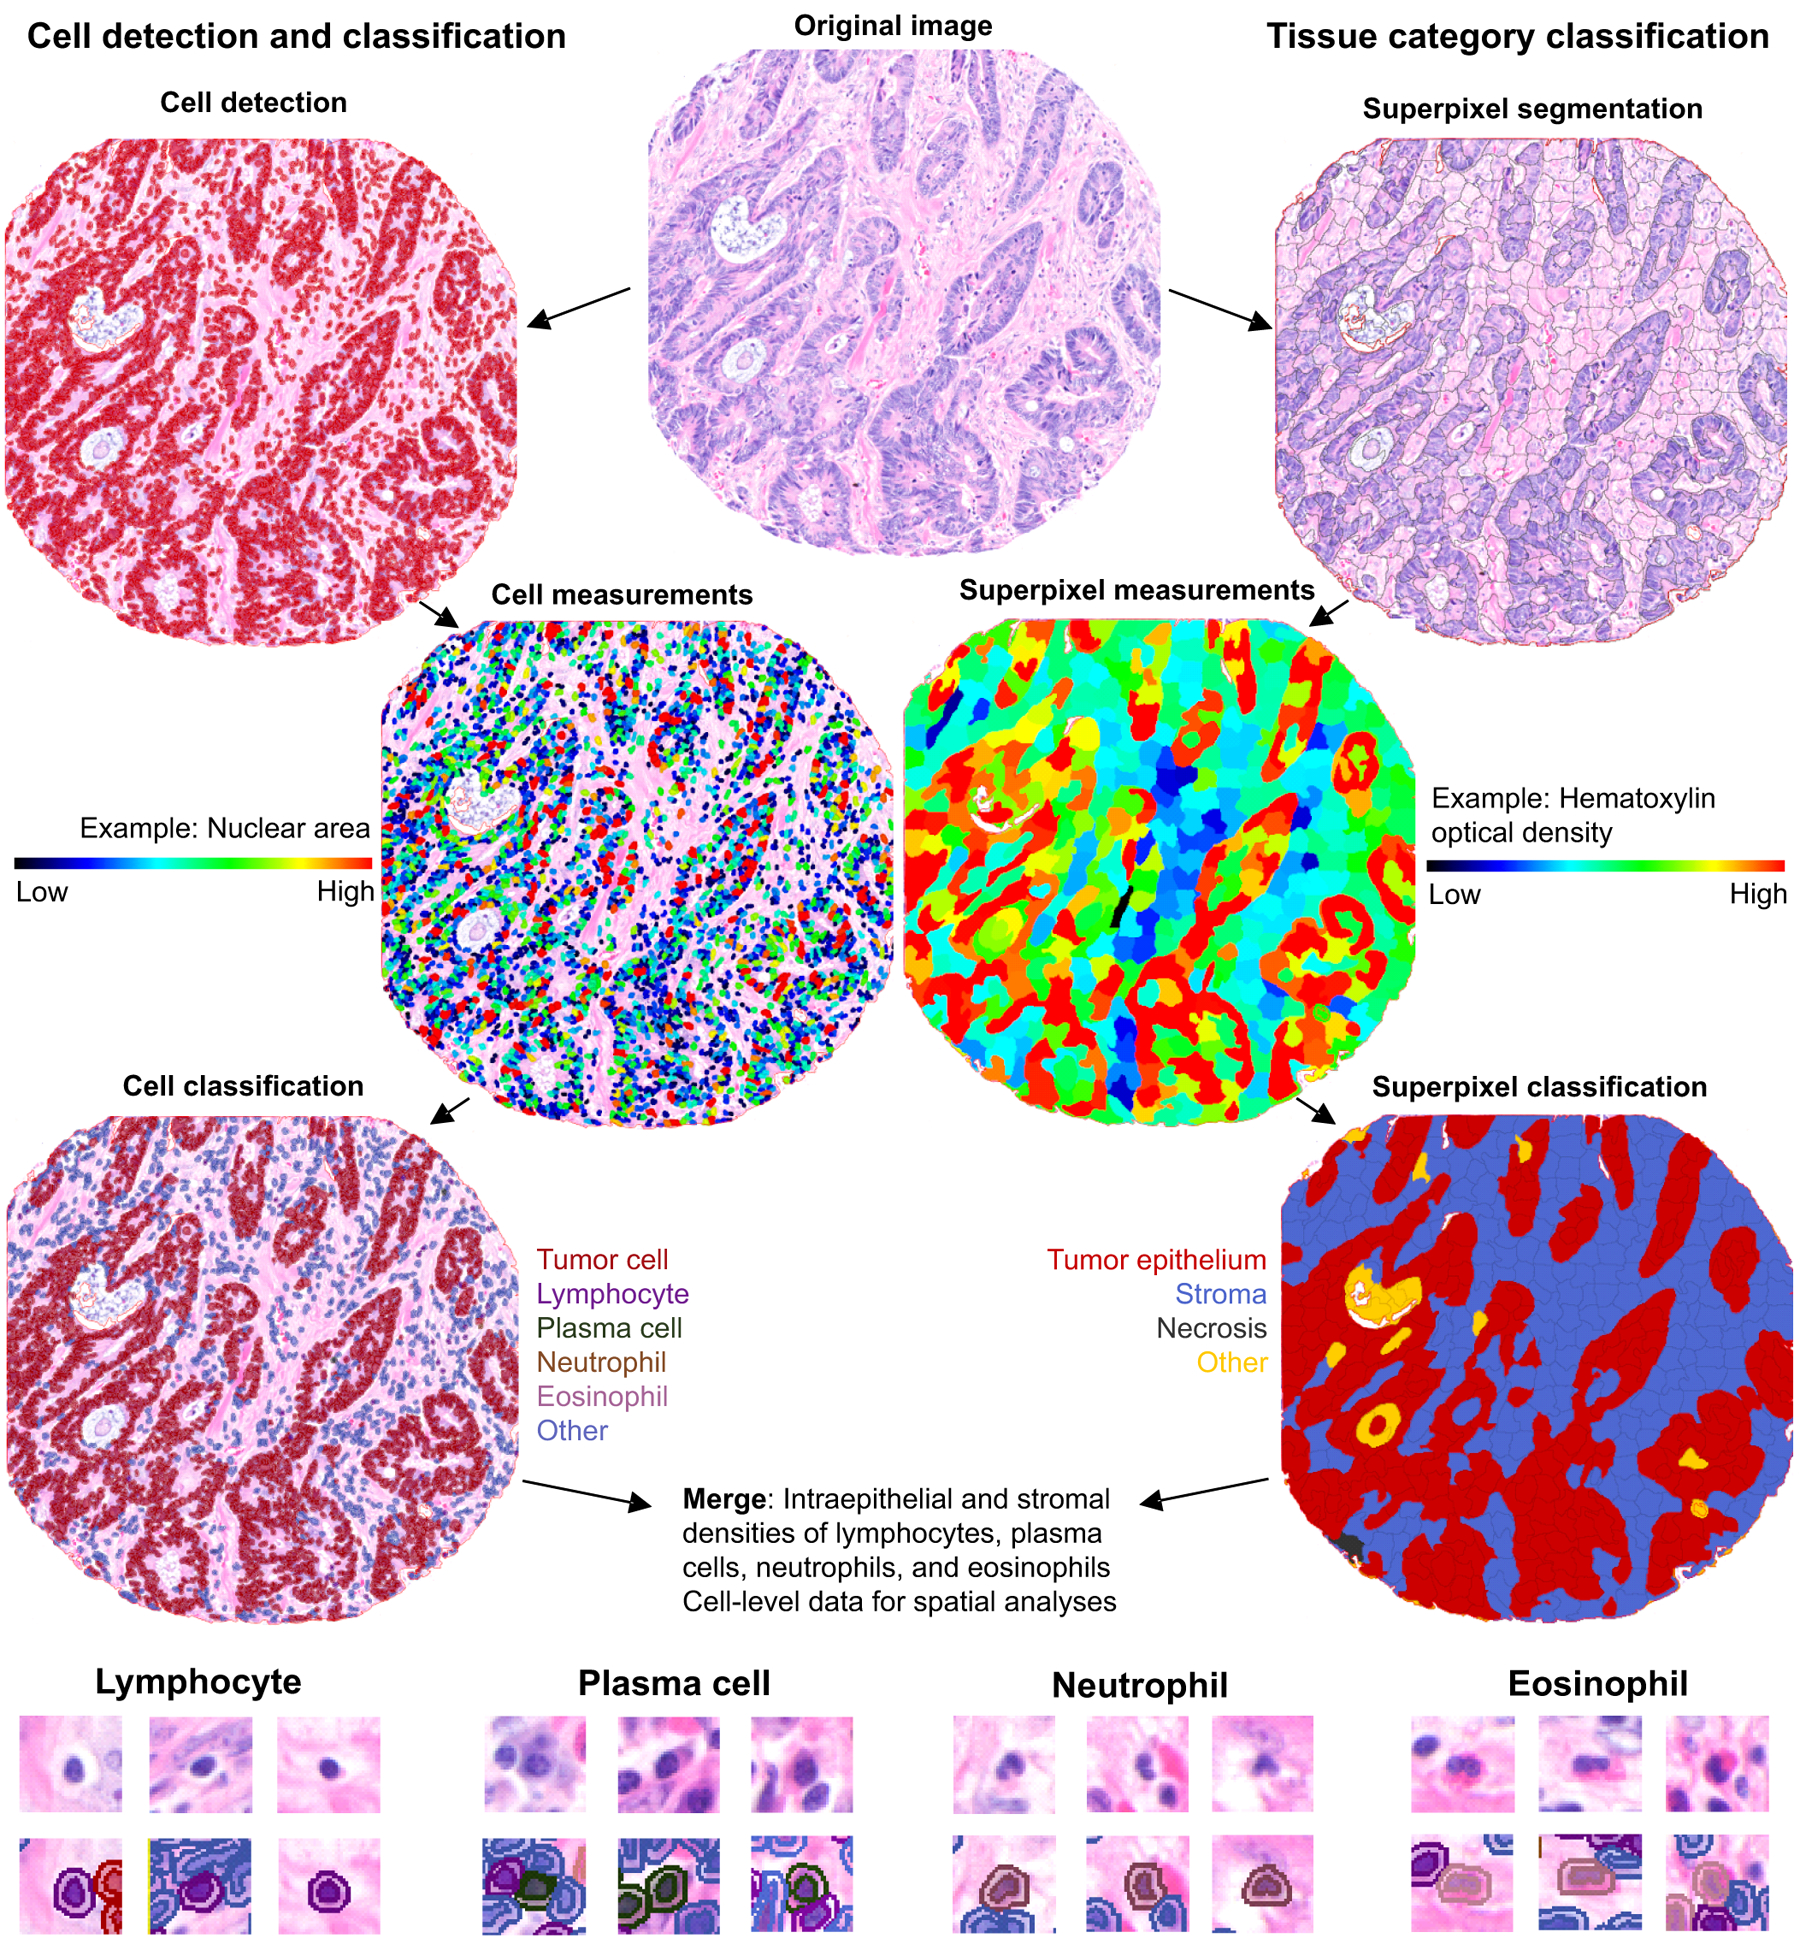
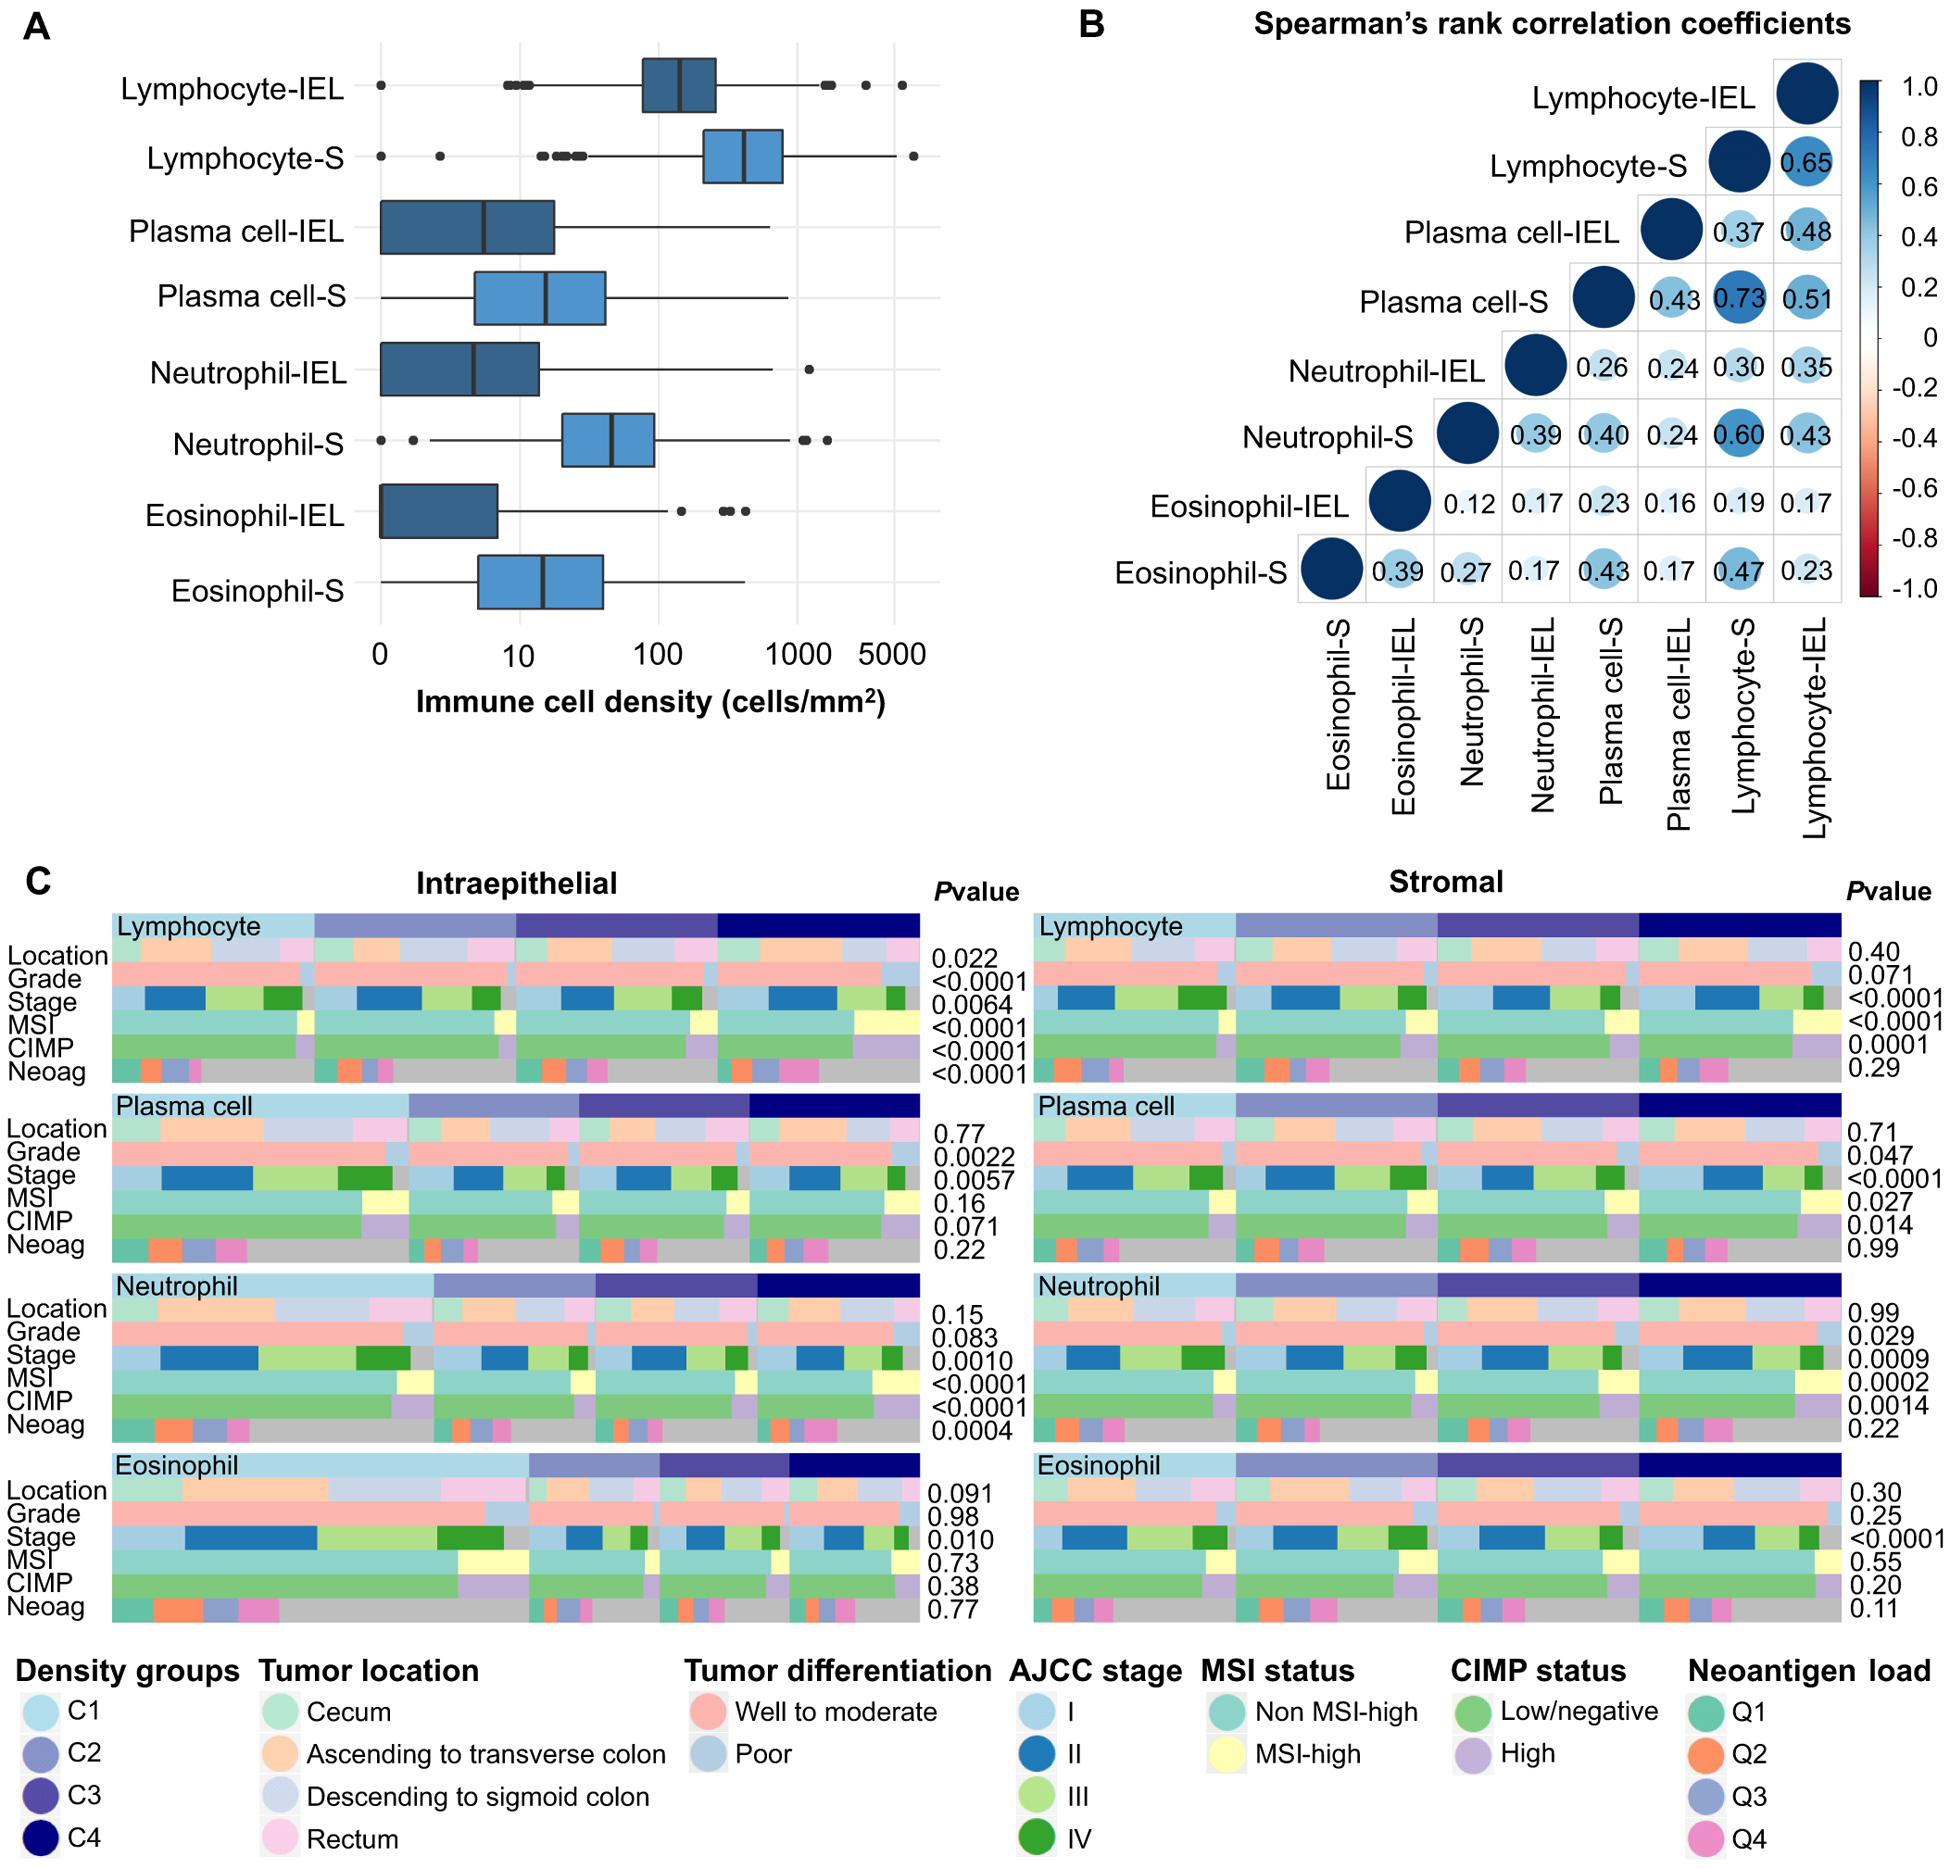
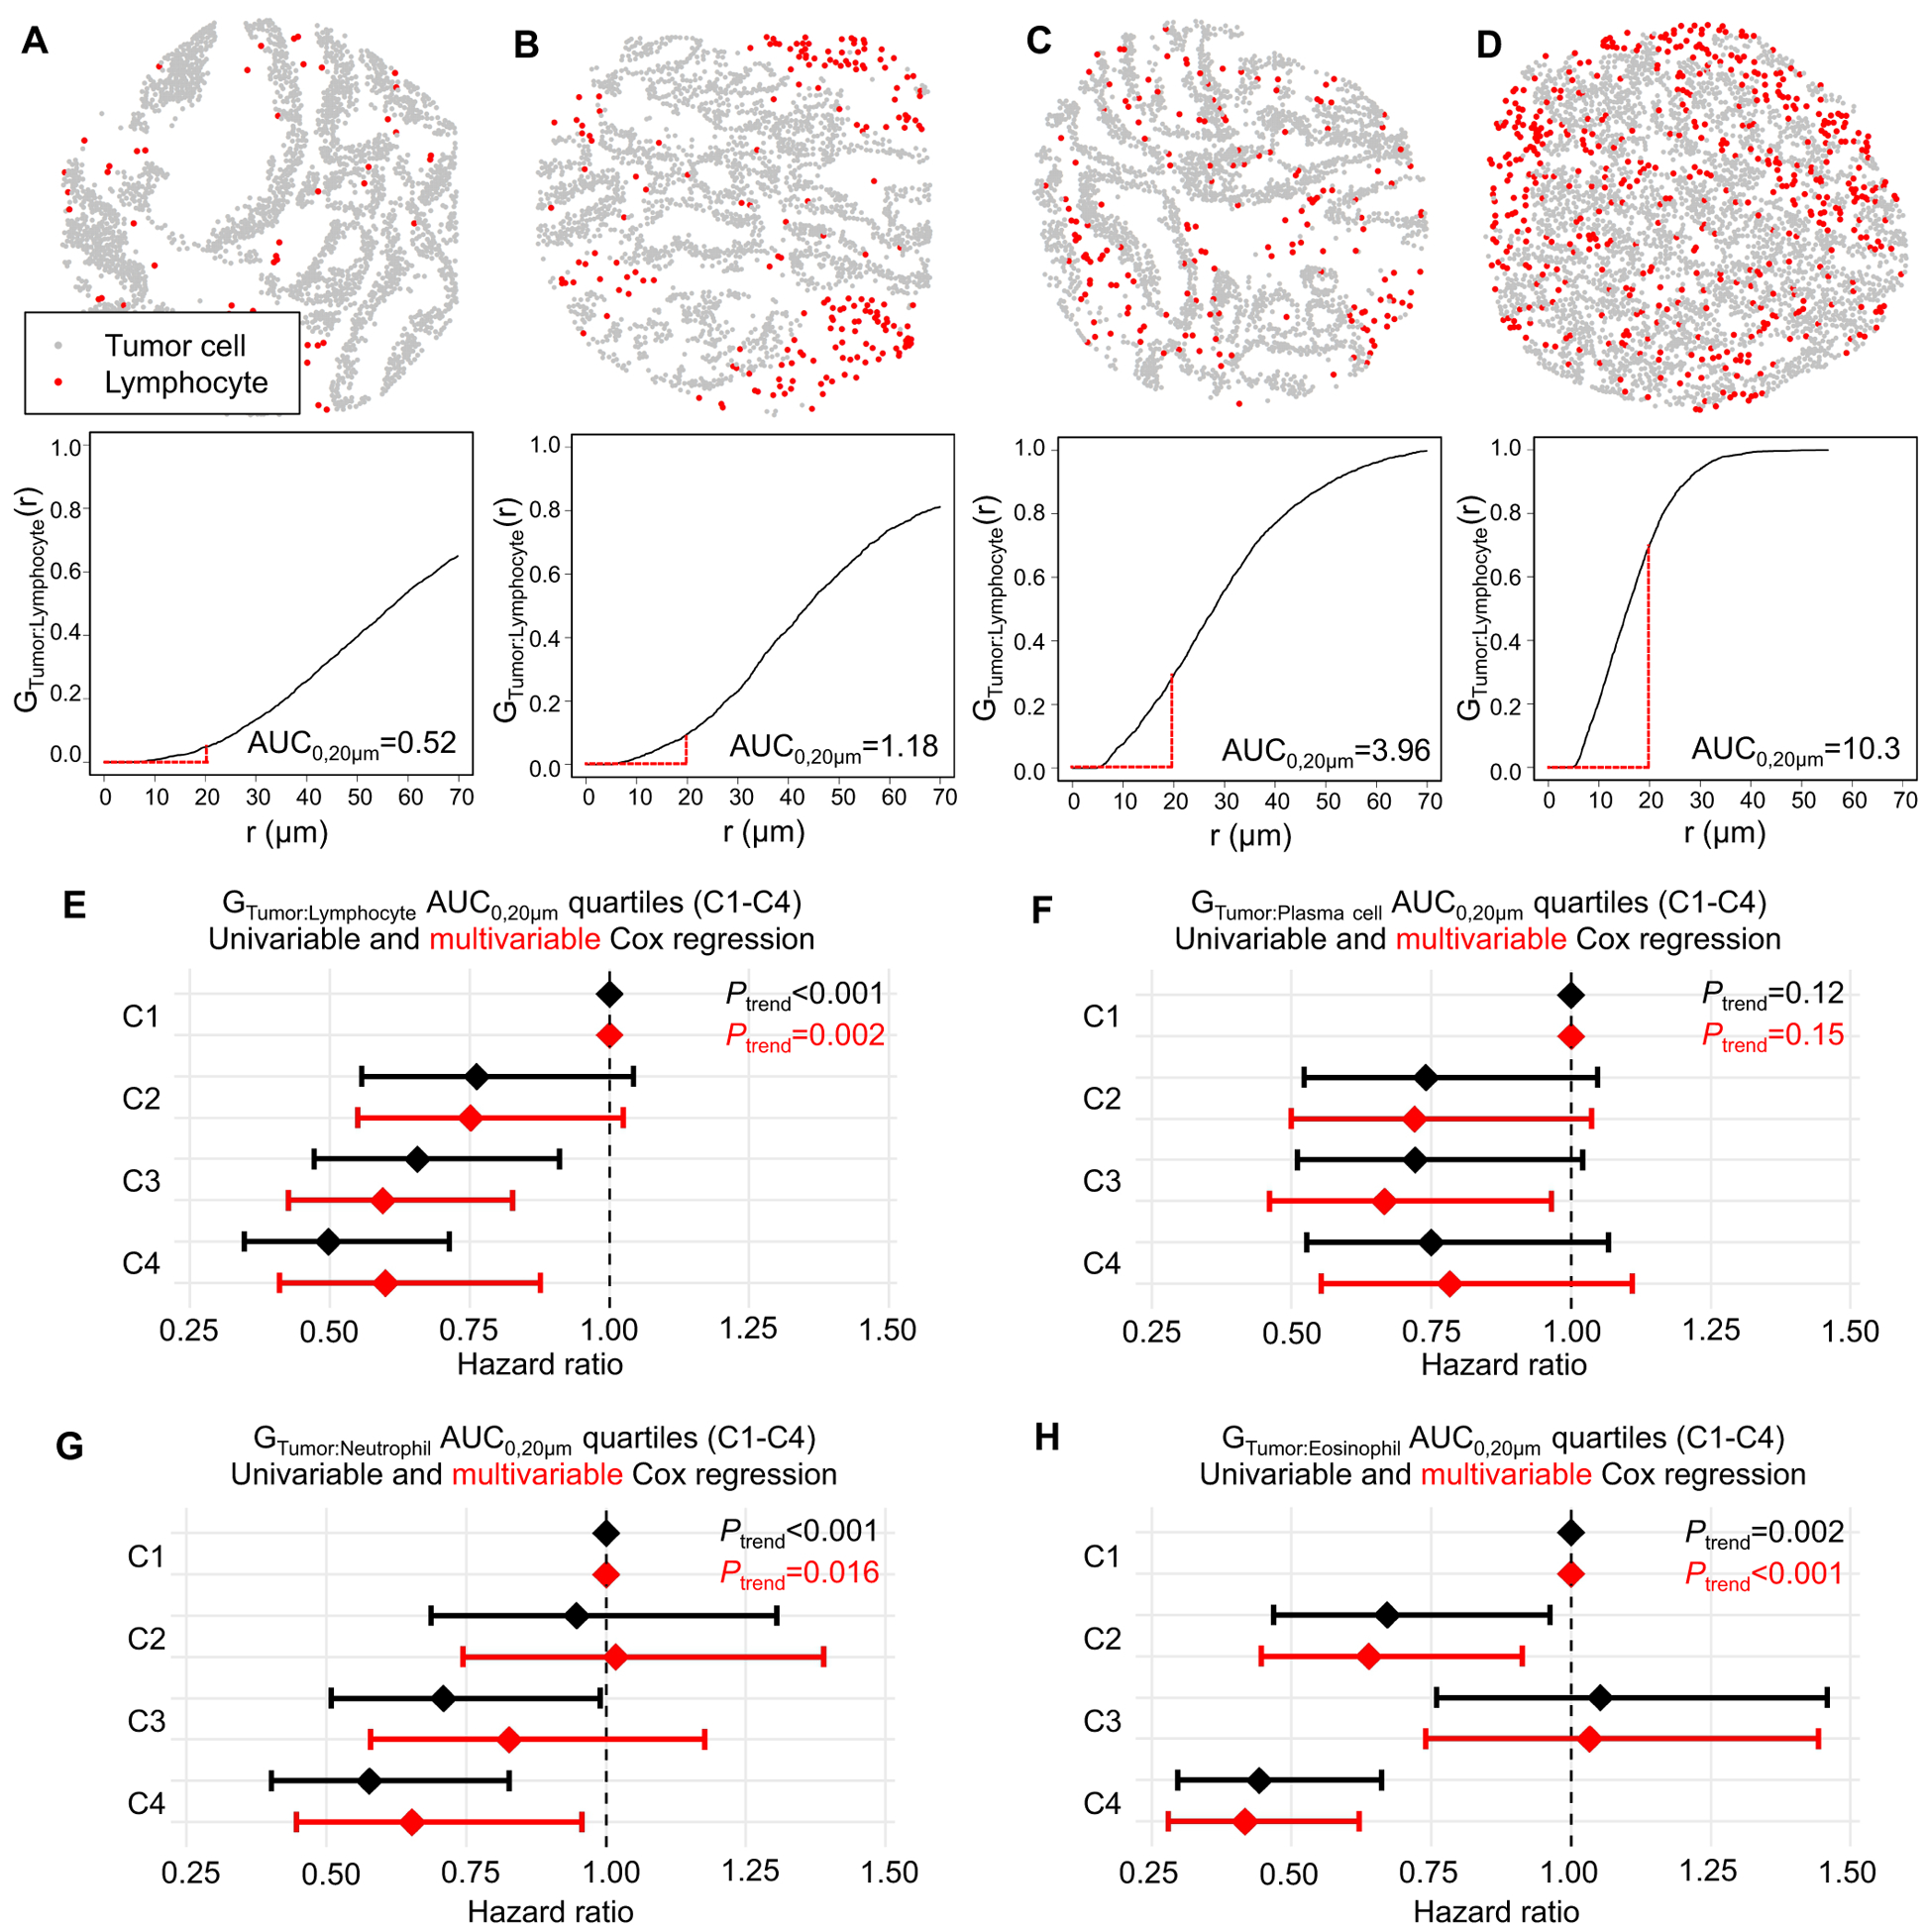
Experimental design: We computationally processed digital images of hematoxylin and eosin (H&E)-stained sections to identify lymphocytes, plasma cells, neutrophils, and eosinophils in tumor intraepithelial and stromal areas of 934 colorectal cancers in two prospective cohort studies. Multivariable Cox proportional hazards regression was used to compute mortality HR according to cell density quartiles. The spatial patterns of immune cell infiltration were studied using the GTumor:Immune cell function, which estimates the likelihood of any tumor cell in a sample having at least one neighboring immune cell of the specified type within a certain radius. Validation studies were performed on an independent cohort of 570 colorectal cancers.
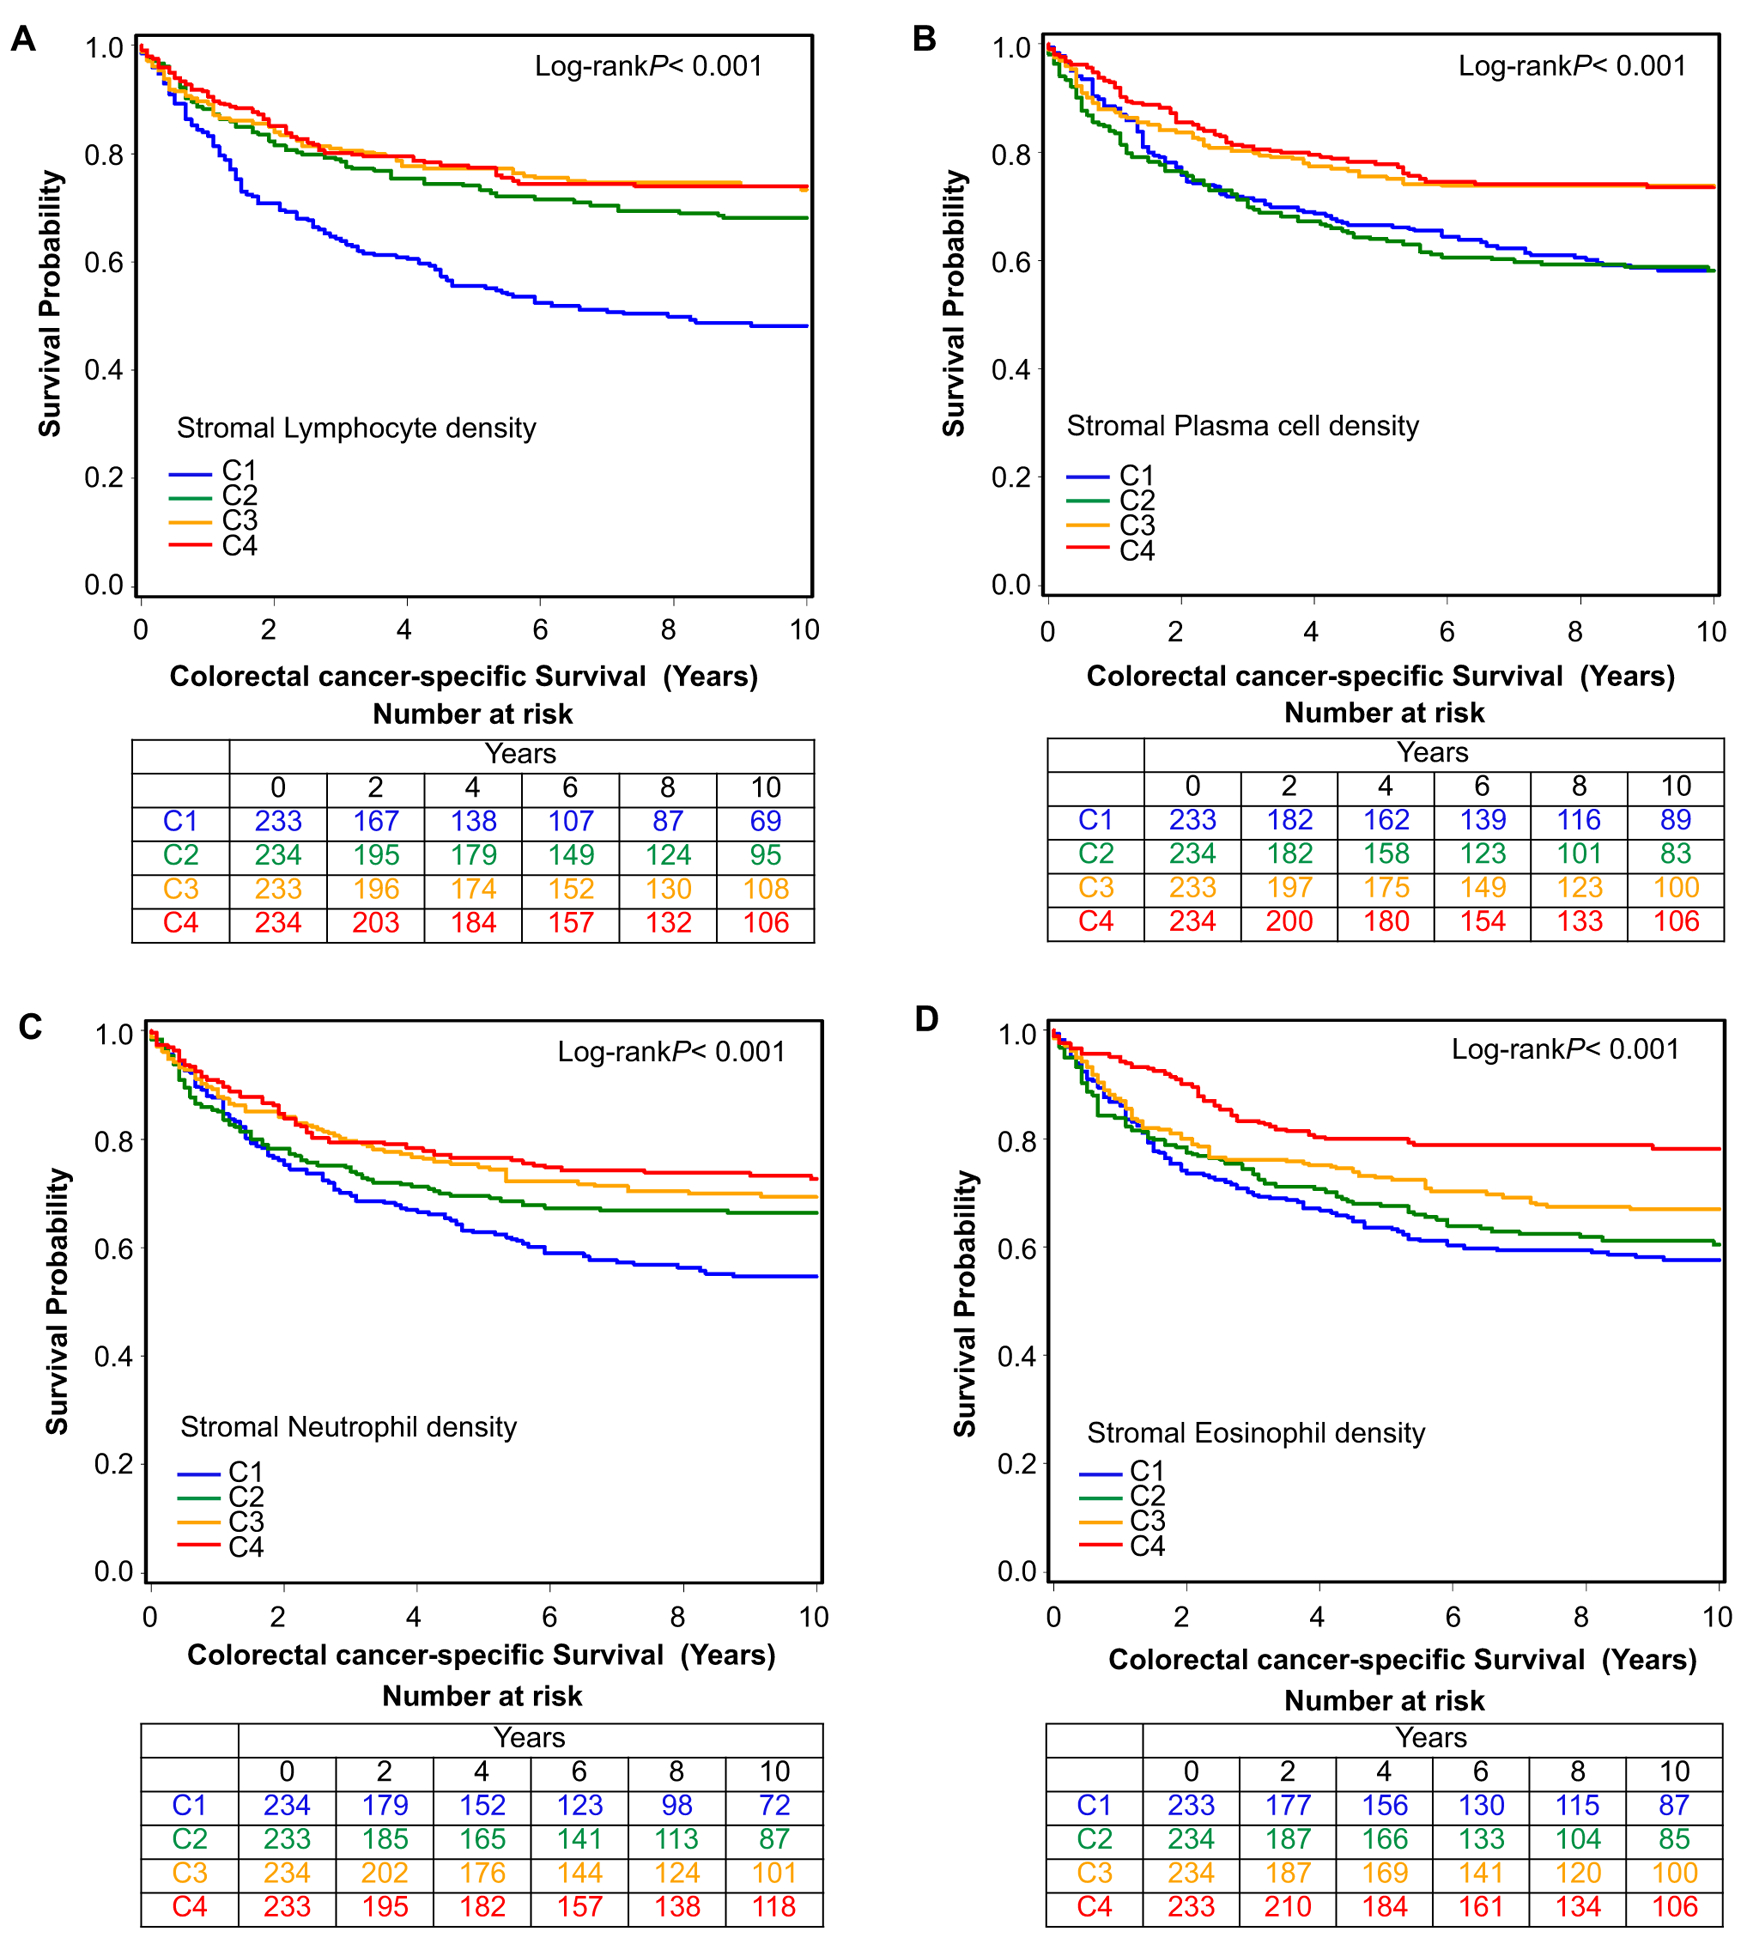
Results: Immune cell densities measured by the automated classifier demonstrated high correlation with densities both from manual counts and those obtained from an independently trained automated classifier (Spearman's ρ 0.71-0.96). High densities of stromal lymphocytes and eosinophils were associated with better cancer-specific survival [P trend < 0.001; multivariable HR (4th vs 1st quartile of eosinophils), 0.49; 95% confidence interval, 0.34-0.71]. High GTumor:Lymphocyte area under the curve (AUC0,20μm; P trend = 0.002) and high GTumor:Eosinophil AUC0,20μm (P trend < 0.001) also showed associations with better cancer-specific survival. High stromal eosinophil density was also associated with better cancer-specific survival in the validation cohort (P trend < 0.001).
Conclusions: These findings highlight the potential for machine learning assessment of H&E-stained sections to provide robust, quantitative tumor-immune biomarkers for precision medicine.
©2020 American Association for Cancer Research.
Conflict of interest statement
Disclosure of Potential Conflicts of Interest:
A.T.C. previously served as a consultant for Bayer Healthcare and Pfizer Inc. C.S.F. previously served as a consultant for Agios, Bain Capital, Bayer, Celgene, Dicerna, Five Prime Therapeutics, Gilead Sciences, Eli Lilly, Entrinsic Health, Genentech, KEW, Merck, Merrimack Pharmaceuticals, Pfizer Inc, Sanofi, Taiho, and Unum Therapeutics; C.S.F. also serves as a Director for CytomX Therapeutics and owns unexercised stock options for CytomX and Entrinsic Health. J.A.M. received institutional research funding from Boston Biomedical. J.A.M. has also served as an advisor/consultant to Ignyta, Array Pharmaceutical, and Cota. M.G. receives research funding from Bristol-Myers Squibb and Merck. R.N. is currently employed by Pfizer Inc. She contributed to this study before she was employed by Pfizer Inc. This study was not funded by any of these commercial entities. No other conflicts of interest exist. The other authors declare that they have no conflicts of interest.
Figures
References
-
- Bray F, Ferlay J, Soerjomataram I, Siegel RL, Torre LA, Jemal A. Global cancer statistics 2018: GLOBOCAN estimates of incidence and mortality worldwide for 36 cancers in 185 countries. CA Cancer J Clin. 2018;68:394–424. - PubMed
-
- Hanahan D, Weinberg RA. Hallmarks of cancer: the next generation. Cell. 2011;144:646–74. - PubMed
Publication types
MeSH terms
Substances
Grants and funding
- R35 CA197735/CA/NCI NIH HHS/United States
- R01 CA118553/CA/NCI NIH HHS/United States
- U01 CA167552/CA/NCI NIH HHS/United States
- R01 CA137178/CA/NCI NIH HHS/United States
- K24 DK098311/DK/NIDDK NIH HHS/United States
- R01 CA169141/CA/NCI NIH HHS/United States
- R03 CA197879/CA/NCI NIH HHS/United States
- UM1 CA167552/CA/NCI NIH HHS/United States
- UK C10674/A27140 /CRUK_/Cancer Research UK/United Kingdom
- P50 CA127003/CA/NCI NIH HHS/United States
- K07 CA190673/CA/NCI NIH HHS/United States
- R21 CA222940/CA/NCI NIH HHS/United States
- R21 CA230873/CA/NCI NIH HHS/United States
- P01 CA087969/CA/NCI NIH HHS/United States
- P01 CA055075/CA/NCI NIH HHS/United States
- R01 CA151993/CA/NCI NIH HHS/United States
- 27140/CRUK_/Cancer Research UK/United Kingdom
- UM1 CA186107/CA/NCI NIH HHS/United States
LinkOut - more resources
Full Text Sources
Medical
