Review
. 2020 May 22;368(6493):eaax9553.
doi: 10.1126/science.aax9553.

Social determinants of health and survival in humans and other animals

Affiliations
Review

Social determinants of health and survival in humans and other animals

Noah Snyder-Mackler et al. Science. .

Abstract

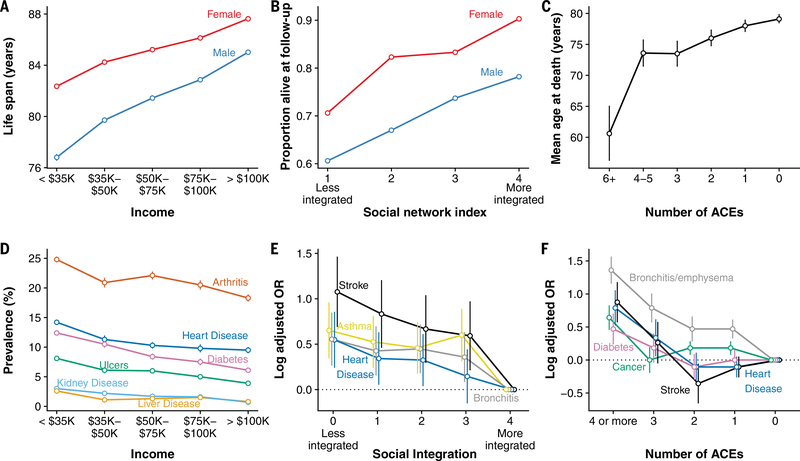
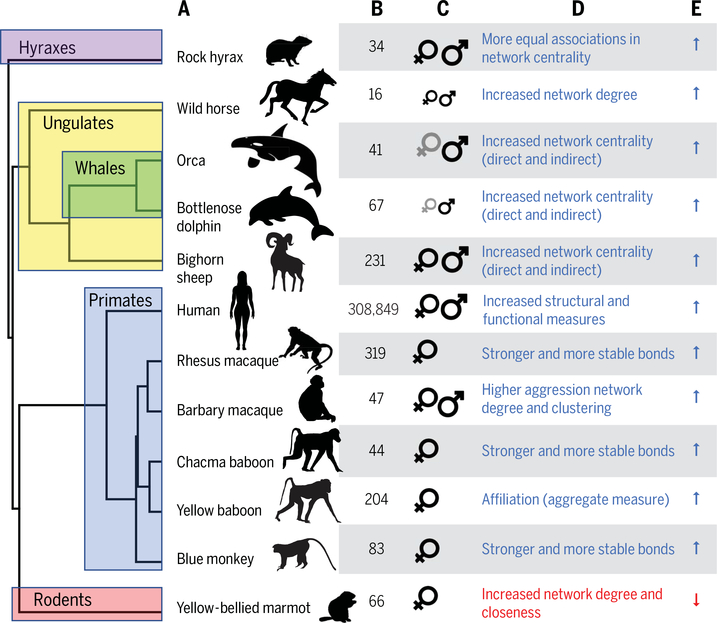
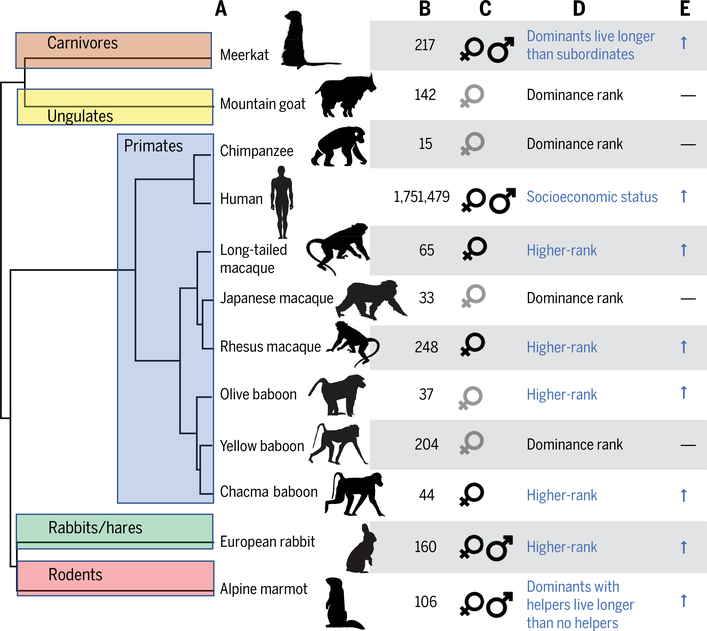
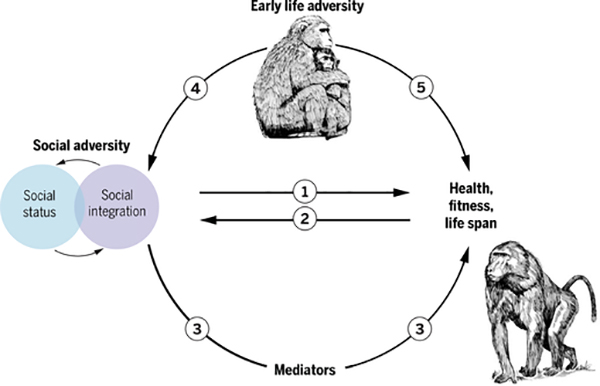
The social environment, both in early life and adulthood, is one of the strongest predictors of morbidity and mortality risk in humans. Evidence from long-term studies of other social mammals indicates that this relationship is similar across many species. In addition, experimental studies show that social interactions can causally alter animal physiology, disease risk, and life span itself. These findings highlight the importance of the social environment to health and mortality as well as Darwinian fitness-outcomes of interest to social scientists and biologists alike. They thus emphasize the utility of cross-species analysis for understanding the predictors of, and mechanisms underlying, social gradients in health.


Conflict of interest statement

Competing interests: Authors declare no competing interests.

Figures

Fig. 1.
Fig. 1.. Social adversity predicts morbidity and mortality in humans.
(A to F) The largest data sets on the health correlates of social adversity come from human populations. Together, they demonstrate that high social adversity is a major predictor of [(A) to (C)] life expectancy and [(D) to (F)] susceptibility to a broad range of diseases. (A) Expected life span at age 40 for men and women in the United States as a function of income at age 40 (n = 1.4 billion person-years) (2). (B) Proportion of study subjects alive after a 9-year follow up, for adult men and women in Alameda County, California, as a function of a composite index of social relationships (n = 6298 individuals) (46). (C) Mean age at death as a function of early adversity in the ACEs study on adult patients at the Kaiser Permanente San Diego Health Appraisal Clinic (n = 17,337 individuals, n = 1539 who had died by follow up) (173). (D) Disease prevalence among adult Americans by income based on the 2015 Centers for Disease Control National Health Interview Survey (n = 242,501 individuals) (174). (E) Disease risk (log odds ratios adjusted for age, sex, and race) as a function of a composite measure of social integration for adult men and women in the United States in the National Health and Nutrition Examination Survey III (n = 18,716 individuals) (31). (F) Disease risk (log odds ratios adjusted for age, sex, race, and educational attainment) by number of ACEs for patients visiting Kaiser Permanente’s San Diego Health Appraisal Clinic (n = 9508 individuals) (9).
Fig. 2.
Fig. 2.. Social integration and survival in wild social mammals.
All cases shown are based on data from natural populations, with the exception of rhesus macaques (65), for which data are from a provisioned free-ranging population. (A) The social integration-survival relationship has been evaluated in at least 12 species, including humans, which together represent multiple independent transitions to social group living (55). The mammal supertree is from (175). (B) Sample sizes and (C) sex studied. Large symbols indicate adults; small symbols indicate juveniles. Sample size for humans is based on a meta-analysis of 148 studies. Where both sexes were investigated, significant results are shown in black and nonsignificant results in gray. (D) Measure of social integration tested. (E) Direction of the observed effect. Blue arrows correspond to improved survival with greater integration and support; red arrow corresponds to reduced survival with greater integration and support. For Barbary macaques, affiliative networks were unrelated to survival; for orca, social integration predicted survival in males only in limited resource years. We excluded several studies of wild mammals that focused on social group size as the measure of social support and integration [cheetahs (176), wolves (177), voles (178), and bats (179)] because the effects of social factors cannot be disentangled from the effects of other density-dependent factors (such as degree of resource competition and between-group competition). Data are from the following sources: rock hyrax, (180); wild horse, (50); orca, (61); bottlenose dolphin, (49); bighorn sheep, (60); human, (4); rhesus macaque, (65); Barbary macaque, (181); chacma baboon, (47); yellow baboon, (48); blue monkey, (54); yellow-bellied marmot, (53).
Fig. 3.
Fig. 3.. Social status and survival in wild social mammals.
All cases shown are based on data from natural populations. (A) The social status-survival relationship has been evaluated in at least 12 species, including humans, which together represent multiple transitions from solitary to social living (in carnivores, even-toed ungulates, primates, rabbits and hares, and rodents) (55). The mammal supertree is from (175), with modifications based on (182). (B) Sample sizes and (C) sex studied. Sample size for humans is based on a meta-analysis of 48 studies. Where both sexes were investigated, significant results are shown in black and nonsignificant results in gray. (D) Measure of social status tested. (E) Direction of the observed effect. Blue arrows correspond to improved survival with higher social status or rank; dashes correspond to no relationship between survival and social status or rank, as reported based on the authors’ threshold for statistical significance. Data are from the following sources: meerkat, (79); mountain goat, (183); chimpanzee, (184); human, (3); long-tailed macaque, (82); Japanese macaque, (185); rhesus macaque, (81); olive baboon, (186); yellow baboon, (47); chacma baboon, (80); European rabbit, (78); alpine marmot, (187).
Fig. 4.
Fig. 4.
Pathways linking social factors to health in nonhuman primates.

Similar articles

Cited by

References

    1. Sapolsky RM, Social status and health in humans and other animals. Annu. Rev. Anthropol. 33, 393–418 (2004). doi: 10.1146/annurev.anthro.33.070203.144000 - DOI
    1. Chetty R et al., The association between income and life expectancy in the United States, 2001–2014. JAMA 315, 1750–1766 (2016). doi: 10.1001/jama.2016.4226; - DOI - PMC - PubMed
    1. Stringhini S et al., Socioeconomic status and the 25 * 25 risk factors as determinants of premature mortality: A multicohort study and meta-analysis of 1–7 million men and women. Lancet 389, 1229–1237 (2017). doi: 10.1016/S0140-6736(16)32380-7; - DOI - PMC - PubMed
    1. Holt-Lunstad J, Smith TB, Layton JB, Social relationships and mortality risk: A meta-analytic review. PLOS Med 7, e1000316 (2010). doi: 10.1371/journal.pmed.1000316; - DOI - PMC - PubMed
    1. Marmot M, Health equity in England: The Marmot review 10 years on. BMJ 368, m693 (2020). doi: 10.1136/bmj.m693; - DOI - PubMed

Publication types