. 2021 Mar;58(3):155-167.
doi: 10.1136/jmedgenet-2020-106861. Epub 2020 May 21.

Mutation in the MICOS subunit gene APOO (MIC26) associated with an X-linked recessive mitochondrial myopathy, lactic acidosis, cognitive impairment and autistic features

Affiliations

Mutation in the MICOS subunit gene APOO (MIC26) associated with an X-linked recessive mitochondrial myopathy, lactic acidosis, cognitive impairment and autistic features

Cristiane Benincá et al. J Med Genet. 2021 Mar.

Abstract

Background: Mitochondria provide ATP through the process of oxidative phosphorylation, physically located in the inner mitochondrial membrane (IMM). The mitochondrial contact site and organising system (MICOS) complex is known as the 'mitoskeleton' due to its role in maintaining IMM architecture. APOO encodes MIC26, a component of MICOS, whose exact function in its maintenance or assembly has still not been completely elucidated.

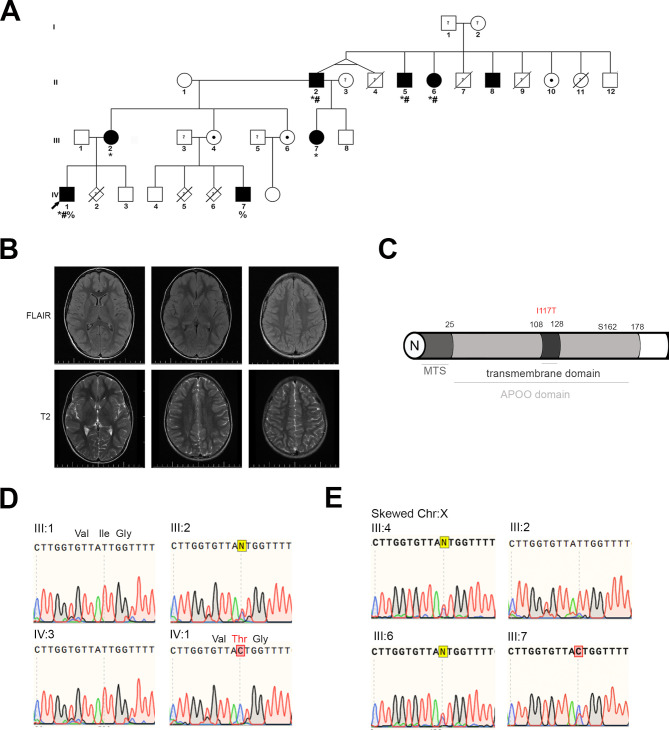
Methods: We have studied a family in which the most affected subject presented progressive developmental delay, lactic acidosis, muscle weakness, hypotonia, weight loss, gastrointestinal and body temperature dysautonomia, repetitive infections, cognitive impairment and autistic behaviour. Other family members showed variable phenotype presentation. Whole exome sequencing was used to screen for pathological variants. Patient-derived skin fibroblasts were used to confirm the pathogenicity of the variant found in APOO. Knockout models in Drosophila melanogaster and Saccharomyces cerevisiae were employed to validate MIC26 involvement in MICOS assembly and mitochondrial function.

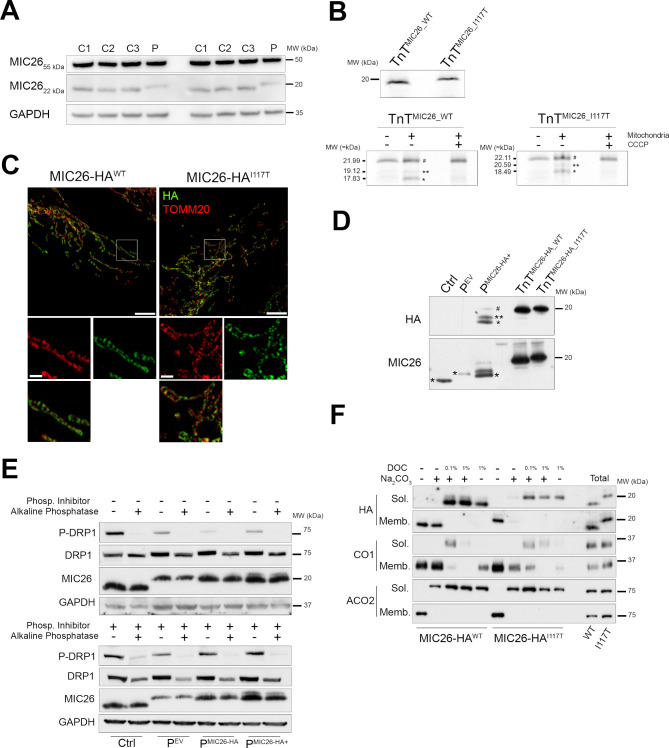
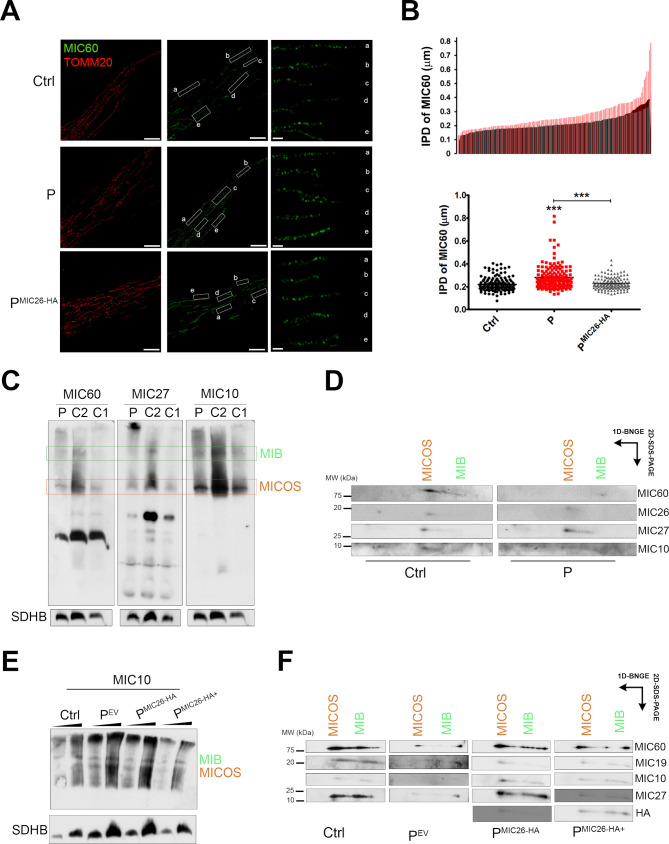
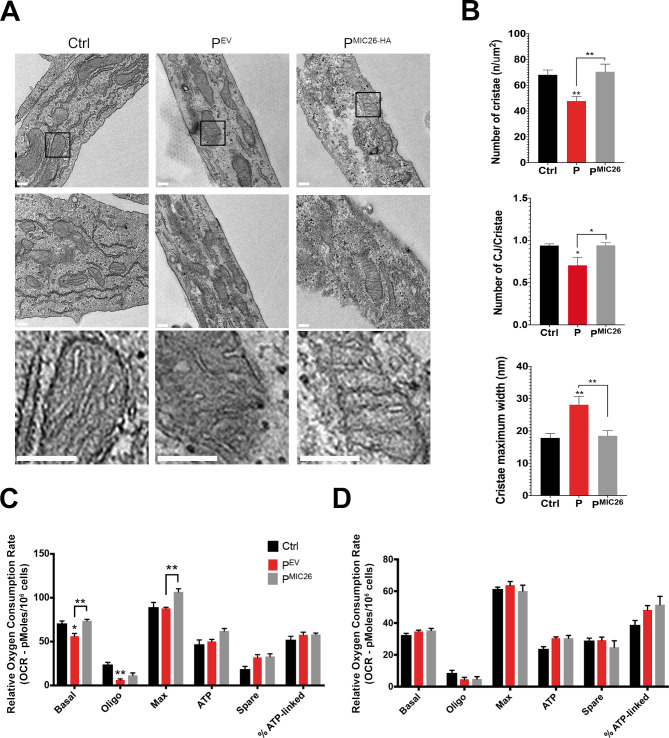
Results: A likely pathogenic c.350T>C transition was found in APOO predicting an I117T substitution in MIC26. The mutation caused impaired processing of the protein during import and faulty insertion into the IMM. This was associated with altered MICOS assembly and cristae junction disruption. The corresponding mutation in MIC26 or complete loss was associated with mitochondrial structural and functional deficiencies in yeast and D. melanogaster models.

Conclusion: This is the first case of pathogenic mutation in APOO, causing altered MICOS assembly and neuromuscular impairment. MIC26 is involved in the assembly or stability of MICOS in humans, yeast and flies.

Keywords: clinical genetics; genetics; metabolic disorders; neuromuscular disease.


Conflict of interest statement

Competing interests: None declared.

Figures

Figure 1
Figure 1
APOO mutation c.350T>C (p.I117T) shows an X-linked recessive inheritance pattern causing a range of phenotypes with affected females, depending on X-chromosome skewing. (A) Pedigree showing segregation of the c.350T>C mutation in APOO of the proband (indicated by arrow) family. Phenotypes are shown as *, # and %. (B) Brain MRI of proband showing hyperintense signal in the white matter. (C) Schematic domains of MIC26 protein showing the position of possible MTS in N, APOO domain (light grey) including the transmembrane domain where the mutation (I117T) is found. Residue S162 is shown for O-glycosylation position of the non-mitochondrial form. (D) Sequence chromatograms showing direct family members of proband with the mutation c.350T>C in heterozygosity in the mother (III:2) and hemizygosity in the proband (IV:1). (E) Sequence chromatograms showing the presence of the mutation in the skewed X-chromosome in the females (III:4, III:6, III:7) and the complete inactivation of the normal allele in the proband mother (III:2). *, muscle weakness; #, neurological problems; %, increased blood lactate; FLAIR, fluid-attenuated inversion recovery; MTS, mitochondrial targeting sequence; N, N-terminus.
Figure 2
Figure 2
MIC26I117T binds weakly to the inner membrane due to incorrect precursor processing. (A) SDS-PAGE for MIC26 and GAPDH showing the cytosolic (55 kDa) and mitochondrial (22 kDa) MIC26 isoforms in Ctrls (C1, C2 and C3) and P. Representative image of five biological replicates. (B) TnT and in vitro organelle import of MIC26 WT and mutant showing # and two imported processed forms (* and **). Representative image of two biological replicates. (C) Representative N-SIM micrographs of HeLa cells expressing MIC26WT-HA or MIC26I117T-HA labelled with anti-HA and anti-TOMM20 antibodies. Maximum intensity projection is shown. Scale bars: 5 µm, inset: 1 µm. Representative image of three biological replicates. (D) SDS-PAGE blotted for HA and MIC26 showing Ctrl, PEV, overexpressing MIC26 WT (PMIC26-HA+) and rabbit reticulocytes lysates after in vitro transcription/translation of MIC26 WT (TnTMIC26-HA_WT) and mutant (TnTMIC26-HA_I117T). Cytoplasmic #, ** and *. (E) SDS-PAGE for P-DRP1 (S616), DRP1, MIC26 and GAPDH in total lysates treated with (+) or without (−) phosphatase inhibitors and akaline phosphatase from fibroblasts: Ctrl, PEV (expressing empty vector), PMIC26-HA (MIC26-HA WT – low levels), PMIC26-HA+ (MIC26-HA WT high levels), representative image of two biological replicates. (F) SDS-PAGE for HA, CO1 and ACO2 from different mitochondrial fractions (sol and memb) of HeLa cells overexpressing MIC26-HAWT and MIC26-HAI117T. Representative image of two biological replicates. GAPDH, glyceraldehyde-3-phosphate dehydrogenase; MW, molecular weight; #, non-imported precursor; *, intermediate form; **, mature form; CCCP, Carbonyl cyanide 3-chlorophenylhydrazone; HA, human influenza hemagglutinin; N-SIM, Nikon structured illumination microscope; Memb, membrane bound; Sol. soluble; Ctrl, control; P, proband fibroblast; PEV, P fibroblasts expressing empty vector; SDS-PAGE, sodium dodecyl sulfate–polyacrylamide gel electrophoresis.
Figure 3
Figure 3
Distribution of MIB and MICOS components is altered in patient fibroblasts. (A) N-SIM super-resolution micrographs showing Ctrl, P and PMIC26-HA fibroblasts labelled with anti-MIC60 and anti-TOMM20 antibodies. maximum intensity projection for TOMM20 and a single Z-stack (0.1 µm) for MIC60 are shown. Scale bars: 5 µm, inset: 1 µm. Representative image of two biological replicates. (B) Charts show histogram for IPD of MIC60 and mean±SEM (n=150 from five different cells); one-way analysis of variance followed by Tukey’s multiple comparison, p<0.001***. (C) BN-PAGE showing the distribution of MIB and MICOS complex immunoblotted for MIC60, MIC27 and MIC10 antibodies in Ctrls (C1 and C2) and P fibroblasts. Representative image of three biological replicates. (D) Second-dimension PAGE from BN of fibroblasts (Ctrl and P) immunoblotted for MIC60, MIC27, MIC10 and MIC26 antibodies. Representative image of two biological replicates. (E) BN-PAGE showing the distribution of MIB and MICOS complex immunoblotted for MIC10 antibody in Ctrl and proband (PEV, PMIC26-HA and PMIC26-HA+) fibroblasts. Representative image of two biological replicates. (F) Second-dimension PAGE from BN immunoblotted for MIC60, MIC27, MIC19, MIC10 and HA antibodies. Representative image of two biological replicates. N-SIM, Nikon structured illumination microscope; BN-PAGE, blue native polyacrylamide gel electrophoresis; Ctrl, control; HA, human influenza hemagglutinin; SDHB, succinate dehydrogenase iron-sulfur subunit; IPD, interpuncta distance; MIB, mitochondrial intermembrane bridging MICOS, mitochondrial contact site and organising system; P, proband fibroblast; PEV, P fibroblasts expressing empty vector.
Figure 4
Figure 4
TEM analysis of patient samples showing altered number of cristae and CJs, and width of cristae. (A) Representative TEM micrographs from Ctrl and Ps (PEV and PMIC26-HA) showing mitochondria ultrastructure. Scale bars: 0.2 µm. Representative images of two biological replicates. (B) Charts show mean±SEM (n=20) of number of cristae per mitochondrial area, cristae maximum width and number of CJs per cristae. One-way ANOVA followed by Tukey’s multiple comparison shows significant differences (cristae number: Ctrl vs P: **p=0.0065, P vs PMIC26: **p=0.0022; cristae width: Ctrl vs P: **p=0.0011, P vs PMIC26: **p=0.0024; CJs per cristae: Ctrl vs P: *p=0.0177, P vs PMIC26: *p=0.0166). (C) Charts show mean±SEM (n=4 biological replicates) OCR of cells grown in galactose and (D) glucose. Two-way ANOVA followed by Sidak’s multiple comparison shows significant differences in basal OCR (Ctrl vs PEV: *p=0.032, PEV vs PMIC26: p=0.0042), oligomycin OCR (Ctrl vs PEV: **p=0.0037), maximum OCR (PEV vs PMIC26: **p=0.0015) for cells grown in galactose. ANOVA, analysis of variance; CJ, cristae junction; Ctrl, control; P, proband fibroblast; PEV, P fibroblasts expressing empty vector; TEM, transmission electron microscopy; OCR, oxygen consumption rate.
Figure 5
Figure 5
Yeast ∆mic26 strain and dApoO KO in Drosophila melanogaster showing growth and survival deficiencies, respectively. (A) Cells grown for 3 days on SC supplemented with 5% ethanol (×100 magnification). Chart shows the mean±SEM (n=100) of the colonies’ diameter (one-way analysis of variance followed by Bonferroni’s test, ***p<0.001). Representative images of three biological replicates. (B) Representative confocal micrographs of Drosophila S2R+ cells transiently expressing CG5903-HA. Cells have been labelled with anti-Atp5a (red) and anti-HA (green) antibodies. (C) Climbing assay performed in w1118 (control) and dApoO KO flies. Chart shows mean±95% CI, n=60 animals (Kruskal-Wallis with Dunn’s multiple comparisons test, ****p<0.0001). (D) Survival curves of w1118 and dApoO KO flies. Statistical analysis was performed with log-rank (Mantel-Cox) test (****p<0.0001). (E) OCR measured in fly homogenates from w1118 and dApoO KO strains. State 3 mitochondrial respiration was stimulated, in the presence of ADP, by the addition of Proline, Malate and Glutamate (PMG, complex I-linked substrates) and pMg+succinate (PMG+S, complex I-linked plus complex II-linked substrates). LEAK-respiration was measured through the enzymatic inhibition of ATP synthase with oligomycin. Maximal respiration was achieved adding the uncoupler CCCP. Non-mitochondrial respiration was measured by inhibiting complex I (with rotenone) and complex III (with antimycin A). Data plotted represent mean±SD of four biological replicates, normalised by the protein concentration of the homogenates (unpaired t-test; *p<0.05, **p<0.01, ***p<0.001). dApoO, Drosophila melanogaster APOO ortholog; CCCP, carbonyl cyanide 3-chlorophenylhydrazone; OCR, oxygen consumption rate; SC, synthetic complete.
Figure 6
Figure 6
dMic26 participate in the formation of cristae architecture via MICOS complex. (A) Representative TEM micrographs from Drosophila control (w1118) and dApoO KO brain and thorax muscles. Scale bars: 0.2 µm. (B) Charts show mean±SEM of the number of CJs per mitochondria and cristae maximum width in the brain and muscle (n=34 for w1118, n=40 for KG05433b from two biological replicates). Unpaired t-test shows significant differences for CJs/mitochondria: brain: **p=0.0039, muscle: ****p<0.0001; cristae max width: brain: ****p<0.0001, muscle: ****p<0.0001). (C) BN-PAGE showing the distribution of MIB and MICOS complex immunoblotted for dMic60 antibody in control (w1118) and dApoO KO (KG05433b) flies. Representative image of two biological replicates. (D) Second-dimension PAGE from BN immunoblotted for dMic60 antibody. Representative image of two biological replicates. (E) BN-PAGE and (F) IGA analysis of MRC complexes in control (w1118) and dApoO KO (KG05433b) flies densitometric quantification of the (G) BN-PAGE and (H) IGA bands normalised to the intensity of the mitochondrial outer membrane marker porin. Charts show mean±SD of three biological replicates (unpaired t-test; *p<0.05, **p<0.01). BN-PAGE, blue native polyacrylamide gel electrophoresis; CJ, cristae junction; IGA, in-gel activity; MIB, mitochondrial intermembrane bridging MICOS, mitochondrial contact site and organising system; TEM, transmission electron microscopy; MRC, mitochondrial respiratory chain; VDAC, voltage-dependent anion-selective channel protein.

References

    1. Frey TG, Mannella CA. The internal structure of mitochondria. Trends Biochem Sci 2000;25:319–24. 10.1016/S0968-0004(00)01609-1 - DOI - PubMed
    1. Harner M, Körner C, Walther D, Mokranjac D, Kaesmacher J, Welsch U, Griffith J, Mann M, Reggiori F, Neupert W. The mitochondrial contact site complex, a determinant of mitochondrial architecture. Embo J 2011;30:4356–70. 10.1038/emboj.2011.379 - DOI - PMC - PubMed
    1. von der Malsburg K, Müller JM, Bohnert M, Oeljeklaus S, Kwiatkowska P, Becker T, Loniewska-Lwowska A, Wiese S, Rao S, Milenkovic D, Hutu DP, Zerbes RM, Schulze-Specking A, Meyer HE, Martinou J-C, Rospert S, Rehling P, Meisinger C, Veenhuis M, Warscheid B, van der Klei IJ, Pfanner N, Chacinska A, van der Laan M. Dual role of mitofilin in mitochondrial membrane organization and protein biogenesis. Dev Cell 2011;21:694–707. 10.1016/j.devcel.2011.08.026 - DOI - PubMed
    1. Callegari S, Müller T, Schulz C, Lenz C, Jans DC, Wissel M, Opazo F, Rizzoli SO, Jakobs S, Urlaub H, Rehling P, Deckers M. A MICOS-TIM22 association promotes carrier import into human mitochondria. J Mol Biol 2019;431:2835–51. 10.1016/j.jmb.2019.05.015 - DOI - PubMed
    1. Huynen MA, Mühlmeister M, Gotthardt K, Guerrero-Castillo S, Brandt U. Evolution and structural organization of the mitochondrial contact site (MICOS) complex and the mitochondrial intermembrane space bridging (MIB) complex. Biochim Biophys Acta 2016;1863:91–101. 10.1016/j.bbamcr.2015.10.009 - DOI - PubMed

Publication types

MeSH terms