Randomized Controlled Trial
. 2020 May 21;11(1):2533.
doi: 10.1038/s41467-020-16308-3.

A randomized trial evaluating virus-specific effects of a combination probiotic in children with acute gastroenteritis

Collaborators, Affiliations
Randomized Controlled Trial

A randomized trial evaluating virus-specific effects of a combination probiotic in children with acute gastroenteritis

Stephen B Freedman et al. Nat Commun. .

Abstract

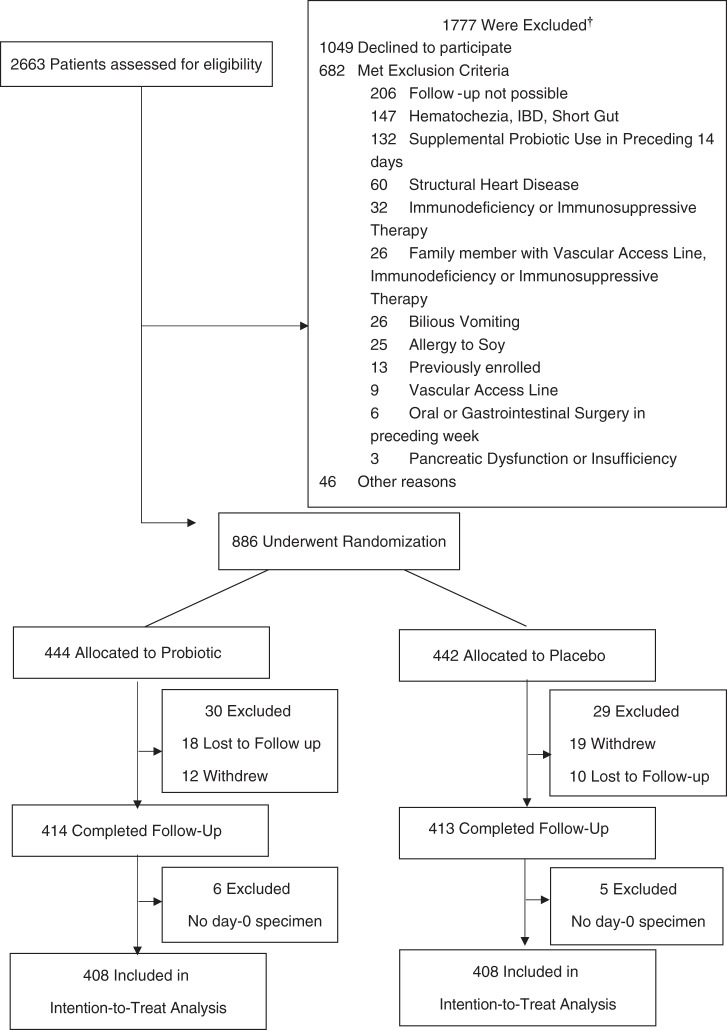
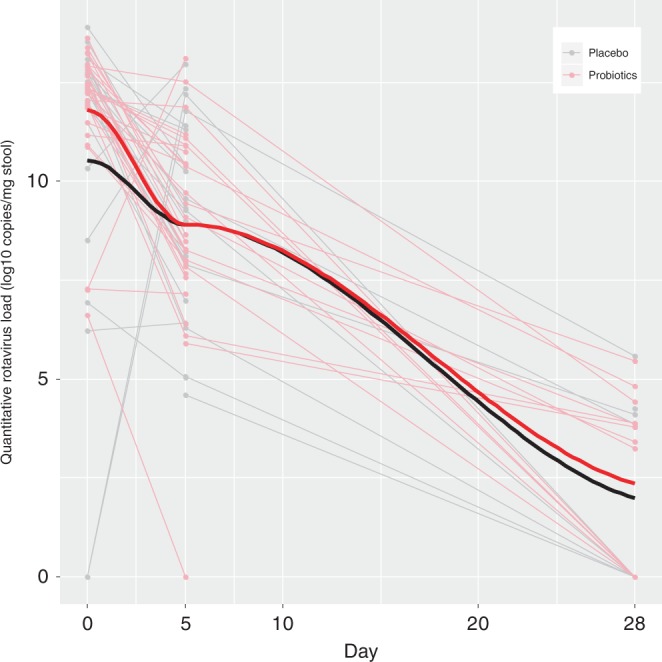
Gastroenteritis accounts for nearly 500,000 deaths in children younger than 5 years annually. Although probiotics have been touted as having the potential to expedite diarrhea resolution, recent clinical trials question their effectiveness. A potential explanation is a shift in pathogens following the introduction of a rotavirus vaccine. Here, we report the results of a multi-center, double-blind trial of 816 children with acute gastroenteritis who completed follow-up and provided multiple stool specimens. Participants were randomized to receive a probiotic containing Lactobacillus rhamnosus and Lactobacillus helveticus or placebo. We report no virus-specific beneficial effects attributable to the probiotic, either in reducing clinical symptoms or viral nucleic acid clearance from stool specimens collected up to 28 days following enrollment. We provide pathophysiological and microbiologic evidence to support the clinical findings and conclude that our data do not support routine probiotic administration to children with acute gastroenteritis, regardless of the infecting virus.


Conflict of interest statement

None of the authors have any potential or perceived conflicts of interest to declare. The study sponsors played no role in study design, conduct, data acquisition, analysis, manuscript preparation or the decision to submit the manuscript for publication. Dr. Stephen Freedman provides consulting services to Takeda Pharmaceuticals Inc. and was an invited speaker at the 10th Probiotics, Prebiotics and New Foods, Nutraceuticals and Botanicals for Nutrition and Human and Microbiota Health. PMS serves on advisory boards for Antibe Therapeutics, Cargill and Nestle-Gerber. He has received honoraria from Abbott Nutrition for speaking at continuing medical education activities and received research support from Lallemand Human Nutrition for a postdoctoral fellow award through a Mitacs Accelerates Internship.

Figures

Fig. 1
Fig. 1. Flow diagram of patient cohort.
IBD inflammatory bowel disease; Patients may have met more than one criterion.
Fig. 2
Fig. 2. Post randomization disease severity (Modified Vesikari Scale scores) based on pathogen identified, compared between probiotic and placebo groups.
Boxplots of post-randomization modified Vesikari scale cores by treatment and pathogen groups (Tested negative: placebo n = 160, probiotics n = 139; virus only: placebo n = 219, probiotics n = 232; bacteria only: placebo n = 20, probiotics n = 17; virus/bacteria co-detection: placebo n = 6; probiotics n = 13; Other type detected including parasite only and virus/parasite co-detection: placebo n = 3, probiotics n = 7). In the box plot, the line that divides the box into two parts represents the median of the data; the upper and lower bounds of the box represent the 25% and 75 percentiles, respectively. The lower whiskers represent the 25%ile-(1.5× IQR) and the upper whiskers represent the 75%ile-(1.5× IQR). The dots beyond the whisker represents outliers of values within the dataset. Source data are provided as a Source Data file.
Fig. 3
Fig. 3. Change in adenovirus viral load quantity in stool over time, compared between probiotic and placebo groups.
Stool Log10 transformed copies of adenovirus by treatment group [probiotic (N = 25) vs. placebo (N = 20)] across time (in days) following randomization on the x-axis. Thin light gray lines refer to patients provided placebo, this red lines refer to those provided probiotic; thick black and red lines to locally weighted smoothing lines respectively. The two-sided P-value represents the result of a linear mixed effect model with random intercepts (subjects random effect) comparing placebo (reference group) vs. probiotic on viral load including time and treatment group variables, and an interaction term for the latter two. Source data are provided as a Source Data file. Adenovirus (mean difference: −0.12; 95% CI: −1.94, 1.70; P = 0.90).
Fig. 4
Fig. 4. Change in norovirus viral load quantity in stool over time, compared between probiotic and placebo groups.
Stool Log10 transformed copies of norovirus by treatment group [probiotic (N = 34) vs. placebo (N = 47)] across time (in days) following randomization on the x-axis. Thin light gray lines refer to patients provided placebo, this red lines refer to those provided probiotic; thick black and red lines to locally weighted smoothing lines respectively The two-sided P-value represents the result of a linear mixed effect model with random intercepts (subjects random effect) comparing placebo (reference group) vs. probiotic on viral load, including time and treatment group variables, and an interaction term for the latter two. Source data are provided as a Source Data file. Norovirus (mean difference: 0.16; 95% CI: −0.81, 1.14; P = 0.74).
Fig. 5
Fig. 5. Change in rotavirus viral load quantity in stool over time, compared between probiotic and placebo groups.
Stool Log10 transformed copies of rotavirus by treatment group [probiotic (N = 30) vs. placebo (N = 24)] across time (in days) following randomization on the x-axis. Thin light gray lines refer to patients provided placebo, this red lines refer to those provided probiotic; thick black and red lines to locally weighted smoothing lines respectively. The two-sided P-value represents the result of a linear mixed effect model with random intercepts (subjects random effect) comparing placebo (reference group) vs. probiotic on viral load, including time and treatment group variables, and an interaction term for the latter two. Source data are provided as a Source Data file. Rotavirus (mean difference: 0.74; 95% CI: −0.45, 1.93; P = 0.22).

References

    1. Thomas MK, Murray R, Nesbitt A, Pollari F. The incidence of acute gastrointestinal illness in Canada, foodbook survey 2014-2015. Can. J. Infect. Dis. Med. Microbiol. 2017;2017:5956148. doi: 10.1155/2017/5956148. - DOI - PMC - PubMed
    1. Scallan E, et al. Foodborne illness acquired in the United States-major pathogens. Emerg. Infect. Dis. 2011;17:7–15. - PMC - PubMed
    1. Scallan E, Griffin PM, Angulo FJ, Tauxe RV, Hoekstra RM. Foodborne illness acquired in the United States-unspecified agents. Emerg. Infect. Dis. 2011;17:16–22. - PMC - PubMed
    1. Aliabadi N, et al. Global impact of rotavirus vaccine introduction on rotavirus hospitalisations among children under 5 years of age, 2008-16: findings from the Global Rotavirus Surveillance Network. Lancet Glob. Health. 2019;7:e893–e903. - PMC - PubMed
    1. Shah MP, Dahl RM, Parashar UD, Lopman BA. Annual changes in rotavirus hospitalization rates before and after rotavirus vaccine implementation in the United States. PLoS ONE. 2018;13:e0191429. doi: 10.1371/journal.pone.0191429. - DOI - PMC - PubMed

Publication types