. 2020 Aug;34(8):2087-2101.
doi: 10.1038/s41375-020-0866-1. Epub 2020 May 21.

Specific, targetable interactions with the microenvironment influence imatinib-resistant chronic myeloid leukemia

Affiliations

Specific, targetable interactions with the microenvironment influence imatinib-resistant chronic myeloid leukemia

Rahul Kumar et al. Leukemia. 2020 Aug.

Abstract

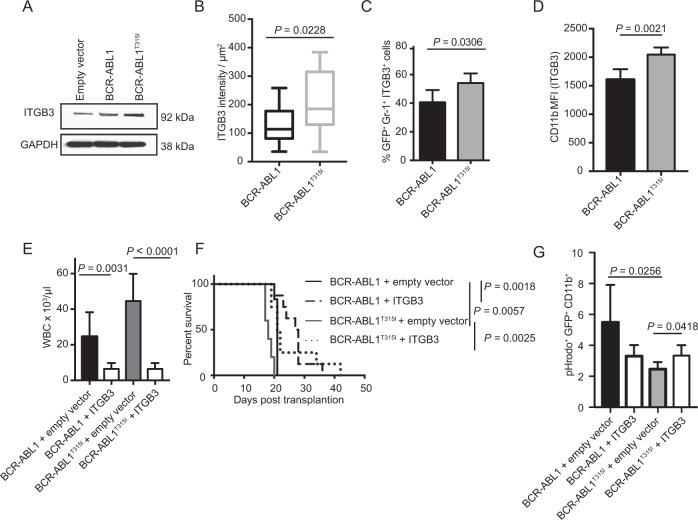
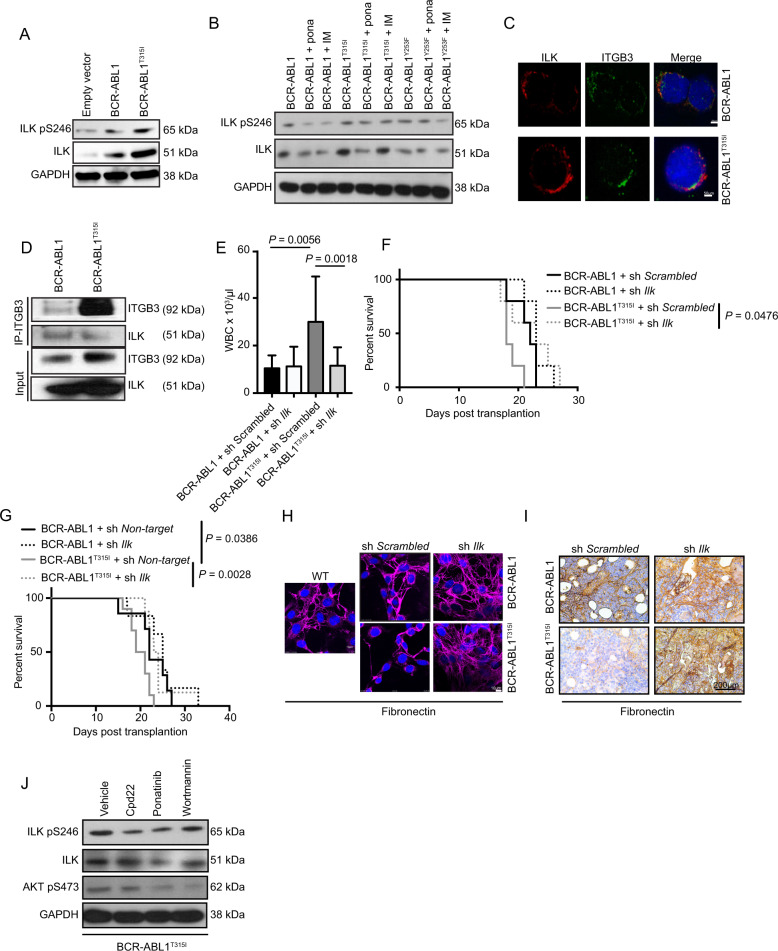
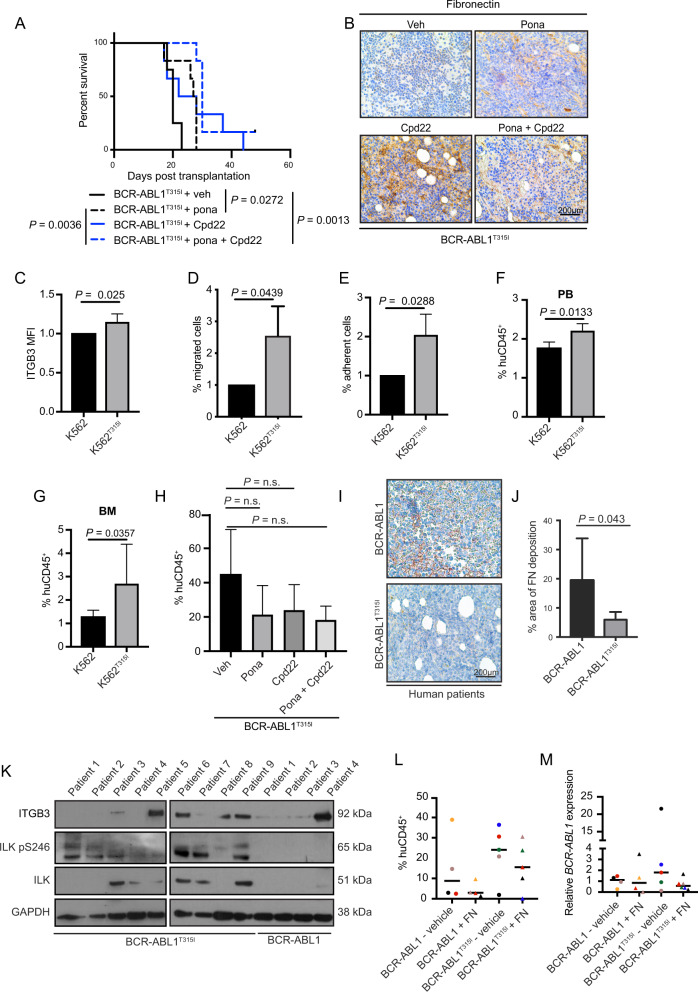
Therapy resistance in leukemia may be due to cancer cell-intrinsic and/or -extrinsic mechanisms. Mutations within BCR-ABL1, the oncogene giving rise to chronic myeloid leukemia (CML), lead to resistance to tyrosine kinase inhibitors (TKI), and some are associated with clinically more aggressive disease and worse outcome. Using the retroviral transduction/transplantation model of CML and human cell lines we faithfully recapitulate accelerated disease course in TKI resistance. We show in various models, that murine and human imatinib-resistant leukemia cells positive for the oncogene BCR-ABL1T315I differ from BCR-ABL1 native (BCR-ABL1) cells with regards to niche location and specific niche interactions. We implicate a pathway via integrin β3, integrin-linked kinase (ILK) and its role in deposition of the extracellular matrix (ECM) protein fibronectin as causative of these differences. We demonstrate a trend towards a reduced BCR-ABL1T315I+ tumor burden and significantly prolonged survival of mice with BCR-ABL1T315I+ CML treated with fibronectin or an ILK inhibitor in xenogeneic and syngeneic murine transplantation models, respectively. These data suggest that interactions with ECM proteins via the integrin β3/ILK-mediated signaling pathway in BCR-ABL1T315I+ cells differentially and specifically influence leukemia progression. Niche targeting via modulation of the ECM may be a feasible therapeutic approach to consider in this setting.


Conflict of interest statement

RK, MeMe, and DSK hold patent no. WO2018/046666 for the use of fibronectin and ILK-inhibitors in leukemia.

Figures

Fig. 1
Fig. 1. BCR-ABL1T315I+ differ from BCR-ABL1+ cells with regards to diverse biological functions.
ac Measurement of the shortest three-dimensional distance of (a) normal (black circles) or BCR-ABL1+ LKS (open circles) (P = 0.0029, t-test) or LKS CD150+ CD48 (LKS SLAM) (black (normal) or open (BCR-ABL1+) squares) (P = 0.0035, t-test) cells or (b) BCR-ABL1+ LKS in vitro treated with vehicle (black circles) or 10 μM imatinib [56] for 4 h (open circles) (P = 0.003, t-test) to bone and (c) BCR-ABL1+ (black circles) versus BCR-ABL1T315I+ (open circles) LKS cells to osteoblasts (P < 0.0001, t-test) in μm. Hematopoietic cells were labeled with the lipophilic dye DiD and injected into unirradiated Col2.3 kb GFP mice. Imaging was performed 2 h after injection. The horizontal black line represents the mean. Each symbol represents a distinct cell from three separate experiments. d Kaplan–Meier-style survival curve of untreated BALB/c recipient mice transplanted with 2.5 × 105 BCR-ABL1-(blue), BCR-ABL1Y253F-(red), BCR-ABL1T315I-(gray), BCR-ABL1E255K-(brown), or BCR-ABL1M351T-(black) transduced bone marrow. The difference in survival between BCR-ABL1+ and BCR-ABL1T315I+ (P = 0.002, Log-rank test) or BCR-ABL1Y253F+ (P = 0.001, Log-rank test) CML is significant (n = 8-9). e, f Southern blot showing distinct proviral integration events (e) and disease clonality (f) in spleens of BALB/c recipients of BCR-ABL1-(lanes 1–5) or BCR-ABL1T315I-(lanes 6–10) transduced bone marrow at the time of death (P = 0.035, t-test). g Leukocyte counts (WBC) × 103 per μl in the peripheral blood of BALB/c recipient mice transplanted with BCR-ABL1-(black) or BCR-ABL1T315I-(gray) transduced bone marrow on days 8, 12, and 15 after transplantation (P = 0.0335; ANOVA, Tukey test, n = 4–5). h Hematoxylin and eosin stain of bone sections of mice with BCR-ABL1+ (top) or BCR-ABL1T315I+ (bottom) CML. The open arrows are pointing toward mature myeloid cells, while the closed arrows are pointing toward blasts. The scale bar depicts 200 μm (n = 5). i Giemsa stain of the cytospins of total bone marrow of representative BALB/c recipient mice transplanted with BCR-ABL1- or BCR-ABL1T315I-transduced bone marrow on day 15 after transplantation. A total of 50,000 bone marrow cells had been plated. The open arrows are pointing towards mature myeloid cells, while the closed arrows are pointing towards blasts. The scale bar depicts 100 μm (n = 5). j Percentage of GFP+ (BCR-ABL1+) Gr-1+ myeloid cells in peripheral blood of mice with BCR-ABL1+ (black) or BCR-ABL1T315I+ (gray) CML on day 15 after transplantation (P = 0.0387; t-test, n = 4–6). k Percentage of GFP+ (BCR-ABL1+) CD11bmedium+ myeloid cells in peripheral blood of mice with BCR-ABL1+ (black) or BCR-ABL1T315I+ (gray) CML 15 days after transplantation (P = 0.0011; t-test, n = 4–6). l Giemsa stain of the cytospins of sorted CD11b medium+ bone marrow cells from representative BALB/c recipient mice transplanted with BCR-ABL1- or BCR-ABL1T315I-transduced bone marrow on day 15 after transplantation. A total of 10,000 CD11b medium+ bone marrow cells had been plated. The open arrows are pointing toward mature myeloid cells, while the closed arrows are pointing towards blasts. The scale bar depicts 100 μm (n = 3). m Percentage of GFP+ (BCR-ABL1+) c-Kit+ cells in the bone marrow of mice with BCR-ABL1+ (black) or BCR-ABL1T315I+ (gray) CML (P = 0.0095; t-test, n = 4–6) on day 15 after transplantation. n Relative expression of Cebpa in total bone marrow of murine recipients of empty vector (white)-, BCR-ABL1+ (black)-, or BCR-ABL1T315I+ (dark gray)-donor bone marrow 15 days after transplantation (P = 0.03; ANOVA, Tukey test, n = 5). o Percentage of empty vector (white)-, BCR-ABL1+ (black)-, BCR-ABL1T315I+ (dark gray)- or BCR-ABL1Y253F+ (light gray)-BA/F3 cells which migrated to the bottom chamber containing MS-5 stroma cells in medium containing 10% serum in a transwell migration assay after 8 h (P = 0.0267; ANOVA, Tukey test, n = 3). 105 cells had been plated. p Percentage of BCR-ABL1+ (black) or BCR-ABL1T315I+ (gray) (GFP+) myeloid CD11b+ cells adhering to MS-5 stroma cells in vitro (P = 0.0063; t-test, n = 3). 1.5 × 105 cells had been plated and allowed to adhere for 72 h. The data are representative of three independent experiments.
Fig. 2
Fig. 2. The actin cytoskeleton and expression of focal adhesion kinase differ between BCR-ABL1T315I+ and BCR-ABL1+ cells.
Immunofluorescence studies on 3T3 fibroblasts transduced with empty vector, BCR-ABL1 or BCR-ABL1T315I grown on coverslips and stained with phalloidin (a) or an antibody to FAK (b). c Quantification of the focal adhesions (FA) per 3T3 fibroblast transduced with empty vector (white), BCR-ABL1 (black), or BCR-ABL1T315I (gray) from (b) (P < 0.0001; ANOVA, Tukey test, n = 3). The data in (a–c) are from three independent experiments. d Immunoblot showing the expression of FAKpY397 (130 kDa), FAKpY925 (130 kDa), FAK (125 kDa), or glyceraldehyde 3-phosphate dehydrogenase (GAPDH) (38 kDa) in lysates of BA/F3 cells transduced with empty vector, BCR-ABL1 or BCR-ABL1T315I. The immunoblot is representative of three experiments. e Immunofluorescence studies of BA/F3 cells transduced with empty vector-, BCR-ABL1-, BCR-ABL1T315I-, or BCR-ABL1Y253F-expressing retrovirus, stained with an antibody to FAKpY397 and 4′,6-diamidino-2-phenylindole (DAPI). The data are representative of two experiments.
Fig. 3
Fig. 3. Integrin β3 is involved in progression of BCR-ABL1T315I+ CML.
a Immunoblot showing the expression of integrin β3 (ITGB3) (92 kDa) or GAPDH (38 kDa) in lysates of BA/F3 cells transduced with empty vector, BCR-ABL1 or BCR-ABL1T315I. The immunoblot is representative of three experiments. b Results of super-resolution microscopy (dSTORM) for immunolabeled integrin β3 showing enhanced expression of the epitope on the surface of BA/F3 cells transduced with BCR-ABL1T315I versus BCR-ABL1 (P = 0.0228; t-test, n = 3). The data are representative of three experiments. c Percentage of GFP+ (BCR-ABL1+) Gr-1+ integrin β3+ myeloid cells in peripheral blood of mice with BCR-ABL1+ (black) or BCR-ABL1T315I+ (gray) CML on day 15 after transplantation (P = 0.0306; t-test, n = 4–6). d Mean fluorescence intensity (MFI) of integrin β3 on CD11b+ cells from bone marrow of mice with BCR-ABL1+ (black) or BCR-ABL1T315I+ (gray) CML on day 15 after transplantation (n = 5). e, f Leukocyte counts (WBC) × 103 per μl in peripheral blood (P < 0.0001 for BCR-ABL1T315I+; t-test, n = 7-8) (e) and Kaplan–Meier-style survival curve (f) of BALB/c recipient mice transplanted with bone marrow cotransduced with BCR-ABL1- or BCR-ABL1T315I-expressing retrovirus and integrin β3 (ITGB3)-overexpressing retrovirus (P = 0.0025 for BCR-ABL1T315I, Log-rank test). g Percentage of BCR-ABL1+ or BCR-ABL1T315I+ CD11b+ myeloid cells cotransduced with empty vector or integrin β3 (GFP+) from mice with established disease after incubation for 90 min with pHrodo-phycoerythrin (PE)-labeled Escherichia coli particles (P = 0.0256; t-test, n = 5).
Fig. 4
Fig. 4. Fibronectin is decreased in the BMM of mice with BCR-ABL1T315I+ CML.
a Optical density read at 570 nm after adhesion of sorted empty vector+, BCR-ABL1+, or BCR-ABL1T315I+ (GFP+) CD11b+ splenocytes to fibronectin (FN) in vitro (P < 0.0001 for BCR-ABL1 versus BCR-ABL1T315I; ANOVA, Tukey test, n = 3). 105 cells had been plated and allowed to adhere for 72 h. The data are representative of three independent experiments. b Immunofluorescence of 3T3 fibroblasts transduced with BCR-ABL1-, BCR-ABL1T315I-, or BCR-ABL1Y253F-expressing retrovirus, treated with vehicle, 750 nM imatinib or 60 nM ponatinib for 6 h, stained with an antibody to fibronectin (pink). The nuclei are counterstained with DAPI. c Immunohistochemistry for fibronectin (detected by immunoperoxidase using yellow–brown horseradish-peroxidase chromogen) on bones of BALB/c recipient mice transplanted with empty vector-, BCR-ABL1-, or BCR-ABL1T315I-transduced bone marrow at time of death. The scale bar depicts 200 μm (n = 3). Leukocyte counts (WBC) × 103 per μl in peripheral blood (P = 0.0403 for BCR-ABL1; t-test, n = 5–6) on day 12 after transplantation (d) and Kaplan–Meier-style survival curve (e) of C57BL/6 recipient mice transplanted with FN fl/fl Mx1-Cre or FN fl/fl Mx1-Cre+ bone marrow transduced with BCR-ABL1 (P = 0.0162, Log-rank test) (e) or BCR-ABL1T315I (d). 10 mg/kg polyinosinic:polycytidylic acid (poly I:C) per dose was administered on days 1, 2, 3, and 5 after transplantation. f, g Leukocyte counts (WBC) × 103 per μl in peripheral blood on day 12 after transplantation (P = 0.009 for BCR-ABL1+; t-test, n = 5–6) (f) and Kaplan–Meier-style survival curve (g) of C57BL/6 recipient mice transplanted with FN fl/fl Mx1-Cre or FN fl/fl Mx1-Cre+ bone marrow transduced with BCR-ABL1 (P = 0.0003, Log-rank test) or BCR-ABL1T315I (g). Ten milligram per kilogram polyinosinic:polycytidylic acid (poly I:C) per dose was administered on days 8, 9, and 10 after transplantation.
Fig. 5
Fig. 5. Integrin-linked kinase influences fibronectin deposition and survival in BCR-ABL1T315I+ CML.
a Immunoblot showing the expression of ILK pS246 (65 kDa), ILK (51 kDa), or glycerinaldehyde-3-phosphate dehydrogenase (GAPDH) (38 kDa) in lysates of BA/F3 cells transduced with empty vector, BCR-ABL1 or BCR-ABL1T315I. The immunoblot is representative of three independent experiments. b Immunoblot showing the expression of ILK pS246 (65 kDa), ILK (51 kDa), or GAPDH (38 kDa) in lysates of BA/F3 cells transduced with BCR-ABL1- or BCR-ABL1T315I-expressing retrovirus treated with vehicle, 60 nM ponatinib or 750 nM imatinib for 4 h. The immunoblot is representative of three independent experiments. c Immunofluorescence of BA/F3 cells transduced with BCR-ABL1- or BCR-ABL1T315I-expressing retrovirus, stained with an antibody to ILK (red) or integrin β3 (green). The nuclei are counterstained with DAPI. The images are representative of three experiments. The scale bar represents 50 μm. d Coimmunoprecipitation (IP) of lysates of BA/F3 cells transduced with BCR-ABL1 or BCR-ABL1T315I with an anti-integrin β3 (ITGB3) antibody. The immunoblot was performed with an antibody to integrin β3 (92 kDa) and ILK (51 kDa). e, f Leukocyte counts (WBC) × 103 per μl in peripheral blood (P = 0.0018 for BCR-ABL1T315I+; t-test, n = 8–10) (e) and Kaplan–Meier-style survival curve (f) of BALB/c recipient mice transplanted with bone marrow cotransduced with BCR-ABL1- or BCR-ABL1T315I-expressing retrovirus and Scrambled or Ilk shRNA-expressing lentivirus (P = 0.0476 for BCR-ABL1T315I+, Log-rank test, n = 10). g Kaplan–Meier-style survival curve of BALB/c recipient mice transplanted with bone marrow cotransduced with BCR-ABL1- or BCR-ABL1T315I-expressing retrovirus and a lentivirus expressing inducible nontarget control or Ilk shRNA (P = 0.0028 for BCR-ABL1T315I+ and P = 0.0386 for BCR-ABL1, Log-rank test, n = 10). 50 mg/kg of doxcyclin to induce shRNA-expression was administered intraperitoneally to recipient mice on days 8, 9, 10, and 12 after transplantation. h Immunofluorescence of normal wildtype (WT) 3T3 fibroblasts or 3T3 fibroblasts transduced with BCR-ABL1- or BCR-ABL1T315I-expressing retrovirus and Scrambled or Ilk shRNA-expressing lentivirus. The nuclei are counterstained with DAPI. The images are representative of four independent experiments. i Immunohistochemistry for fibronectin (detected by immunoperoxidase using yellow–brown horseradish-peroxidase chromogen) on bones of representative BALB/c recipient mice transplanted with BCR-ABL1- or BCR-ABL1T315I- and sh Scrambled or sh Ilk-cotransduced bone marrow. j Western blot showing the expression of ILK pS246 (65 kDa), ILK (51 kDa), AKT pS473 (62 kDa), or GAPDH (38 kDa) as loading control in lysates of BA/F3 cells transduced with BCR-ABL1T315I and treated with vehicle, 50 nM Cpd22, 60 nM ponatinib, or 40 nM wortmannin for 6 h.
Fig. 6
Fig. 6. Treatment with fibronectin prolongs survival in BCR-ABL1T315I+ CML.
ab Leukocyte counts (WBC) × 103 per μl in peripheral blood (P = 0.0096 for BCR-ABL1T315I+; t-test, n = 3) (a) and Kaplan–Meier-style survival curve (b) of BALB/c recipient mice transplanted with bone marrow transduced with BCR-ABL1 (black)- or BCR-ABL1T315I (blue)-expressing retrovirus and treated with intrafemoral (i.f.) administrations of vehicle (solid line) or 50 μg fibronectin resuspended in 50 μl PBS (dashed line) per mouse per injection on days 0, 1, and 2 (P = 0.0246 for BCR-ABL1T315I+, Log-rank test). At the time of transplant (day 0), the leukemia-initiating cells had been resuspended in vehicle or fibronectin. c Kaplan–Meier-style survival curve of BALB/c recipient mice transplanted with bone marrow transduced with BCR-ABL1 (black)- or BCR-ABL1T315I (blue)-expressing retrovirus and treated with intravenous (i.v.) administrations of vehicle (solid line) or 200 μg fibronectin per mouse per injection (dashed line) on days 9, 10, and 12 (P = 0.017 for BCR-ABL1T315I+, Log-rank test, n = 3–5).
Fig. 7
Fig. 7. Levels of fibronectin are decreased and levels of integrin β3 and ILK are increased in human BCR-ABL1T315I+ CML cells.
a Kaplan–Meier-style survival curve of BALB/c recipient mice transplanted with bone marrow transduced with BCR-ABL1T315I-expressing retrovirus and treated with vehicle (solid black line), 20 mg/kg ponatinib (dashed black line), 15 mg/kg Cpd22 (solid blue line), or ponatinib and Cpd22 (blue dashed line) (doses as above) (P = 0.0036 for ponatinib versus ponatinib plus Cpd22, Log-rank test, n = 5–6). Ponatinib was given daily on days 9–22, while Cpd22 was given daily on days 9–14 and every other day on days 14–22 after transplantation. b Immunohistochemistry for fibronectin (detected by immunoperoxidase using yellow–brown horseradish-peroxidase chromogen) on bones of BALB/c recipient mice transplanted with BCR-ABL1T315I-transduced bone marrow treated with vehicle, ponatinib, Cpd22, or the combination of ponatinib and Cpd22 as in (a). c Relative mean fluorescence intensity (MFI) of integrin β3 (ITGB3) on K562 (black) or K562T315I (gray) cells (P = 0.025; t-test, n = 3). d Percentage of K562 (black) or K562T315I (gray) cells which migrated to the bottom chamber containing MS-5 stroma cells in medium containing 10% serum in a transwell migration assay after 8 h (P = 0.0439; t-test, n = 4). In total, 105 K562 cells and 30,000 MS-5 cells had been plated. e Percentage of K562 (black) or K562T315I (gray) cells adhering to MS-5 stroma cells in vitro (P = 0.0288; t-test, n = 4). In total, 105 K562 cells were plated on top of 30,000 MS-5 stroma cells. Cells had been allowed to adhere for 12 h. Percentage of human CD45+ leukocytes in the peripheral blood (PB) (f) or bone marrow (BM) (g) of NOD SCID interleukin-2 receptor γ knockout (NSG) mice transplanted with 3 × 106 K562 (black) or K562T315I (gray) cells on day 38 after transplantation. The mice had not been irradiated (P = 0.0133 for PB and P = 0.0357 for BM; t-test, n = 3–5). h Percentage of human CD45+ leukocytes in the bone marrow of NOD SCID interleukin-2 receptor γ knockout (NSG) mice transplanted with 3 × 106 K562T315I cells treated with vehicle, ponatinib, Cpd22 or ponatinib plus Cpd22 as in (a) at the time of death. The results are not significant (n = 4–7). Immunohistochemistry for fibronectin (detected by immunoperoxidase using yellow–brown horseradish-peroxidase chromogen) (i) and quantification of the area of fibronectin (FN) staining (j) in bone sections of patients with BCR-ABL1+ (black) or BCR-ABL1T315I+ (gray) CML (n = 4–11). k Immunoblot showing the expression of ILK pS246 (65 kDa), ILK (51 kDa), integrin β3 (92 kDa), or GAPDH (38 kDa) as loading control in lysates of leukocytes from the bone marrow or peripheral blood of patients with BCR-ABL1+ or BCR-ABL1T315I+ CML. Percentage of engraftment of human CD45+ (hCD45+) leukocytes (l), or relative levels of BCR-ABL1+ or BCR-ABL1T315I+ engraftment in BM aspirates from individual NSG recipients of primary human CML samples (peripheral blood or BM) on day 28 after transplantation (n = 4–5) (m). The recipient mice were treated with either saline or 200 μg/dose fibronectin on days 9, 10, 11, 13, and 15 after transplantation. Recipients of peripheral blood or BM grafts from the same human CML sample are indicated by the same individual symbols. Each human patient sample was transplanted into one vehicle- and two to three fibronectin-treated recipient mice.

References

    1. Dean M, Fojo T, Bates S. Tumour stem cells and drug resistance. Nat Rev Cancer. 2005;5:275–84. - PubMed
    1. Zheng HC. The molecular mechanisms of chemoresistance in cancers. Oncotarget. 2017;8:59950–64. - PMC - PubMed
    1. Krause DS, Van Etten RA. Tyrosine kinases as targets for cancer therapy. N Engl J Med. 2005;353:172–87. - PubMed
    1. Junttila MR, de Sauvage FJ. Influence of tumour micro-environment heterogeneity on therapeutic response. Nature. 2013;501:346–54. - PubMed
    1. Krause DS, Scadden DT. A hostel for the hostile: the bone marrow niche in hematologic neoplasms. Haematologica. 2015;100:1376–87. - PMC - PubMed

Publication types

MeSH terms