. 2020 May 21;10(1):8477.
doi: 10.1038/s41598-020-65414-1.

The aryl hydrocarbon receptor pathway controls matrix metalloproteinase-1 and collagen levels in human orbital fibroblasts

Affiliations

The aryl hydrocarbon receptor pathway controls matrix metalloproteinase-1 and collagen levels in human orbital fibroblasts

Elisa Roztocil et al. Sci Rep. .

Abstract

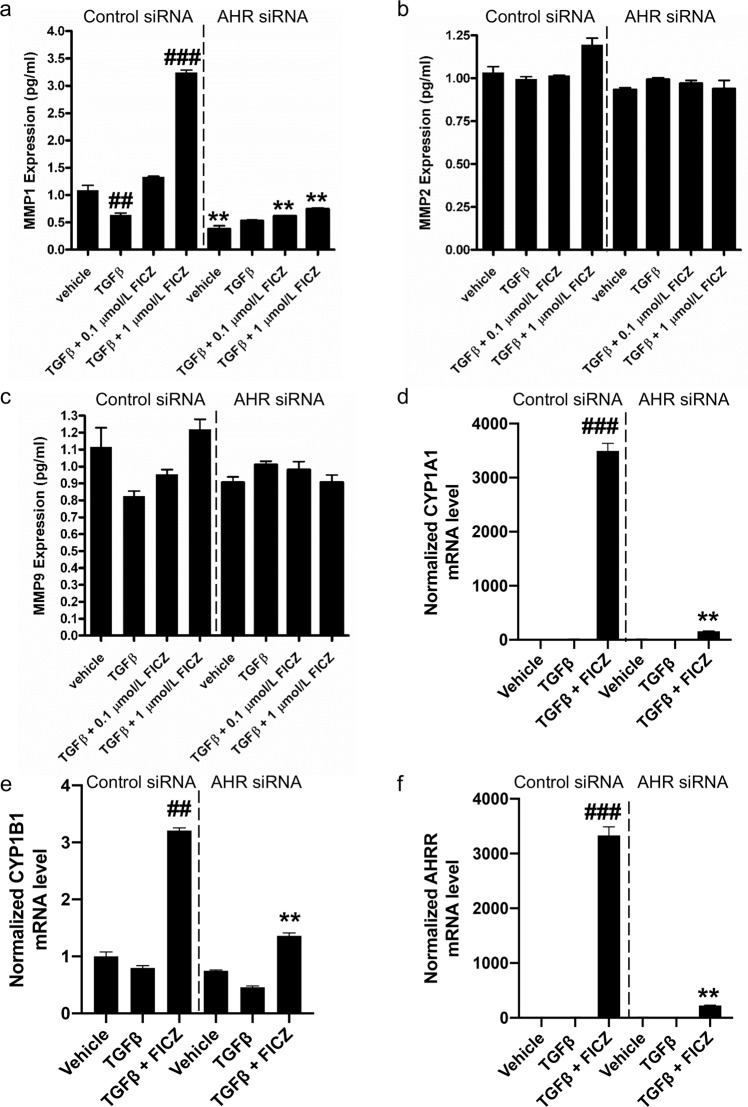
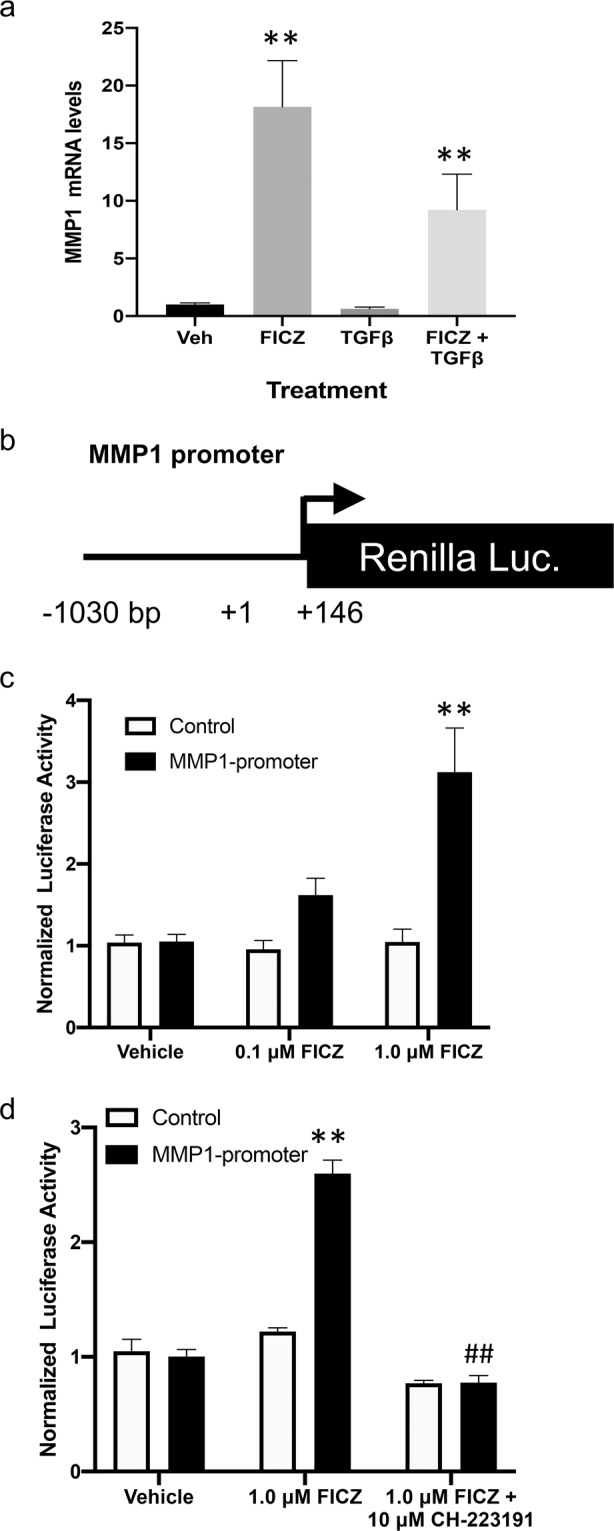
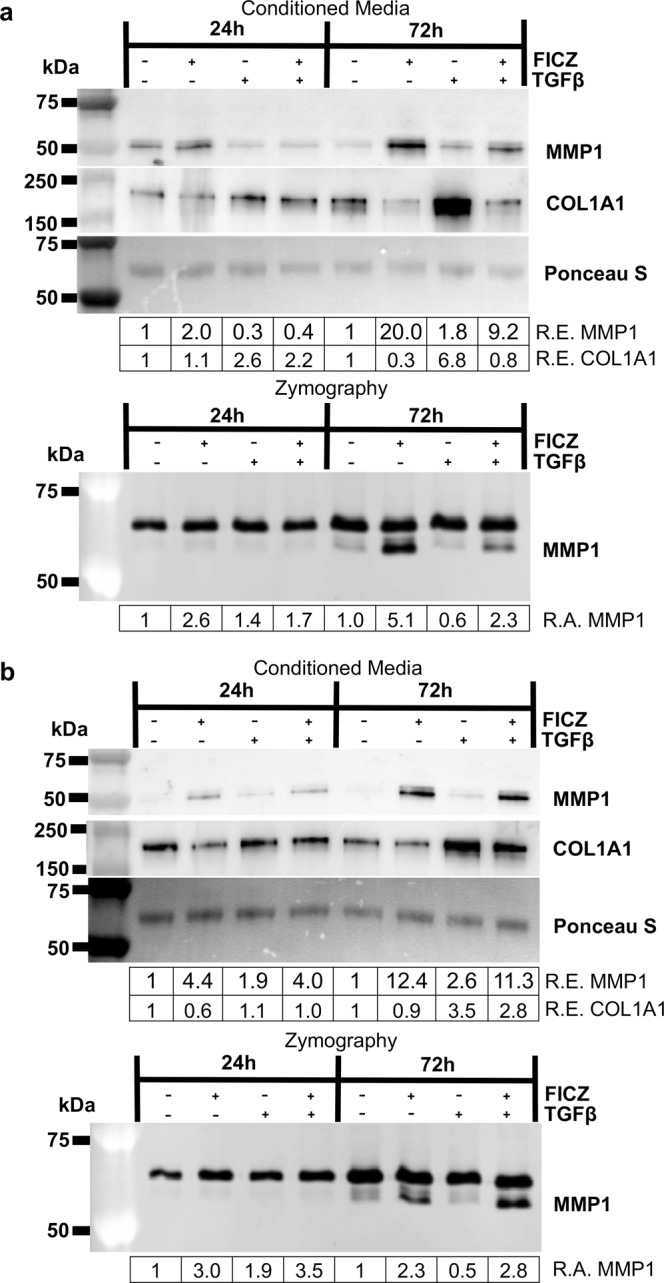
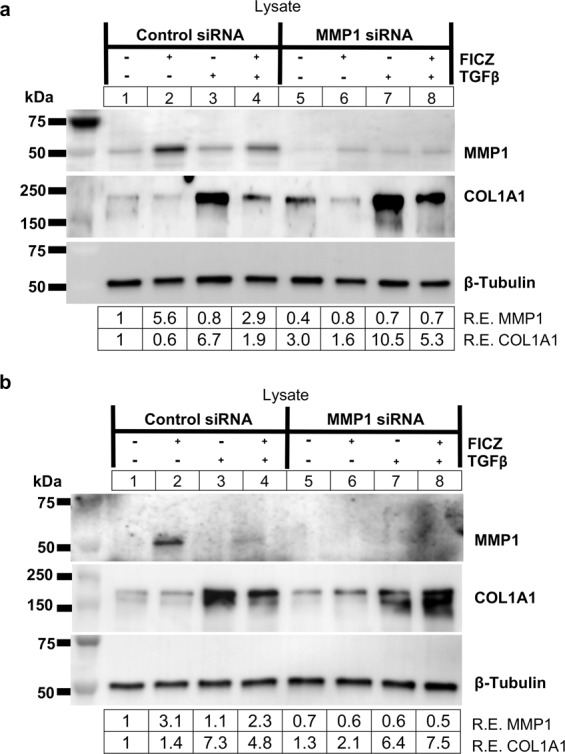
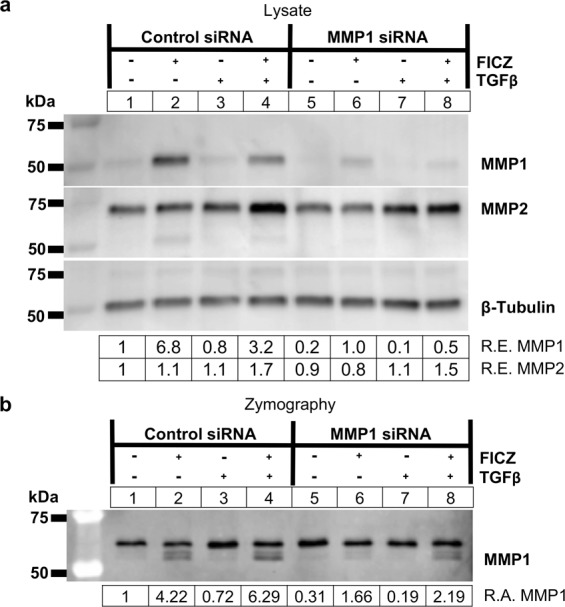
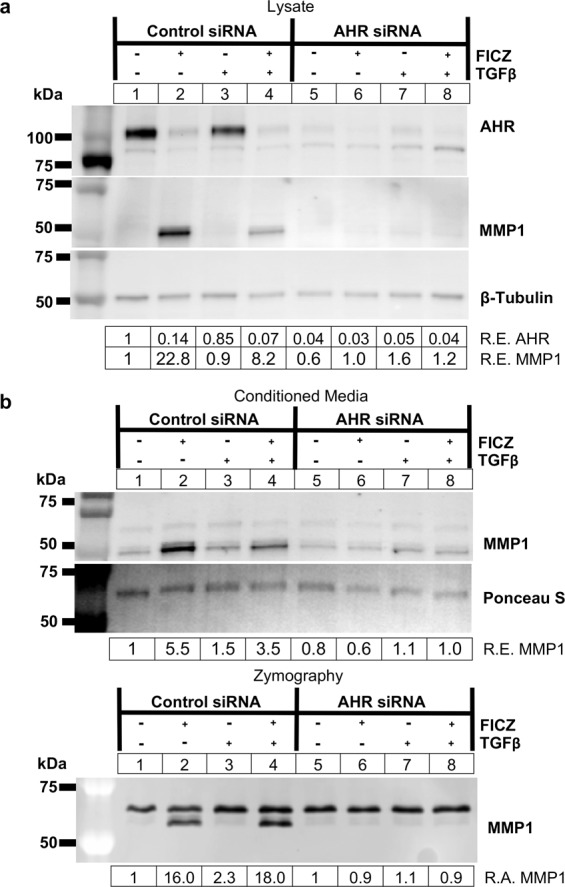
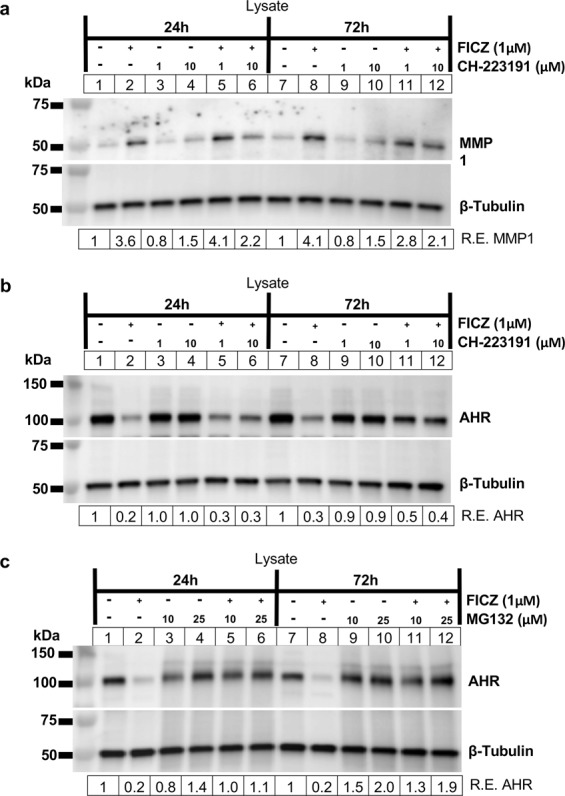
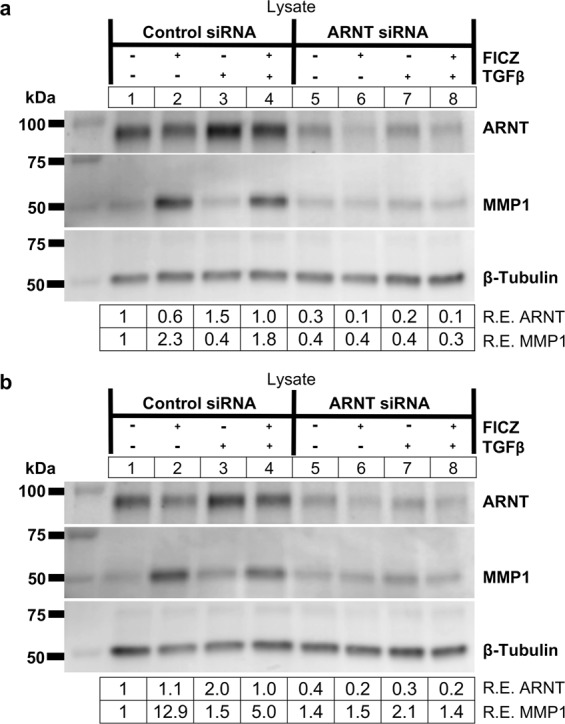
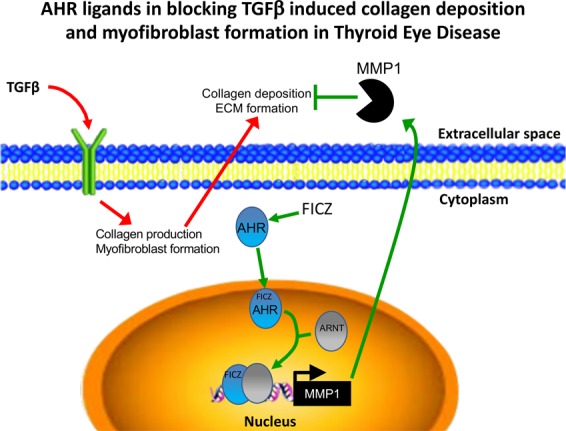
Thyroid eye disease (TED) affects 25-50% of patients with Graves' Disease. In TED, collagen accumulation leads to an expansion of the extracellular matrix (ECM) which causes destructive tissue remodeling. The purpose of this study was to investigate the therapeutic potential of activating the aryl hydrocarbon receptor (AHR) to limit ECM accumulation in vitro. The ability of AHR to control expression of matrix metalloproteinase-1 (MMP1) was analyzed. MMP1 degrades collagen to prevent excessive ECM. Human orbital fibroblasts (OFs) were treated with the pro-scarring cytokine, transforming growth factor beta (TGFβ) to induce collagen production. The AHR ligand, 6-formylindolo[3,2b]carbazole (FICZ) was used to activate the AHR pathway in OFs. MMP1 protein and mRNA levels were analyzed by immunosorbent assay, Western blotting and quantitative PCR. MMP1 activity was detected using collagen zymography. AHR and its transcriptional binding partner, ARNT were depleted using siRNA to determine their role in activating expression of MMP1. FICZ induced MMP1 mRNA, protein expression and activity. MMP1 expression led to a reduction in collagen 1A1 levels. Furthermore, FICZ-induced MMP1 expression required both AHR and ARNT, demonstrating that the AHR-ARNT transcriptional complex is necessary for expression of MMP1 in OFs. These data show that activation of the AHR by FICZ increases MMP1 expression while leading to a decrease in collagen levels. Taken together, these studies suggest that AHR activation could be a promising target to block excessive collagen accumulation and destructive tissue remodeling that occurs in fibrotic diseases such as TED.


Conflict of interest statement

The authors declare no competing interests.

Figures

Figure 1
Figure 1
MMP1 levels, but not MMP2 or MMP9 levels are regulated by the AHR in Graves’ orbital fibroblasts (GOFs). GOFs were treated with non-specific siRNA (control) or AHR siRNA for 48 hours. Afterwards, cells were incubated with 0.1% FBS DMEM medium containing either vehicle (DMSO), TGFβ, TGFβ + 0.1 μM FICZ or TGFβ + 1 μM FICZ for 24 hours. Cell culture supernatants were then collected and analyzed by fluorescent based immunoassay (Luminex) for MMP1 (a), MMP2 (b) or MMP9 (c). MMP1 levels were reduced by TGFβ and increased by FICZ. AHR siRNA attenuated MMP1 induction by FICZ. MMP2 and MMP9 levels were not significantly altered by any treatments or by AHR siRNA. To confirm that FICZ activated AHR dependent gene expression and AHR siRNA successfully blocked AHR dependent gene expression, canonical AHR dependent genes were analyzed by qPCR in samples treated with vehicle, TGFβ or TGFβ + 1 μM FICZ for 24 hours. Total RNA was isolated and analyzed by RT-qPCR. Normalized levels of CYP1A1 mRNA (d), CYP1B1 mRNA (e) and AHRR mRNA (f) are shown. FICZ significantly induced expression of all three canonical AHR dependent genes in GOFs while AHR siRNA dramatically attenuated the effect of FICZ on gene expression. The experiment was performed in 3 different strains of GOFs. ##p < 0.01, ###p < 0.001 versus vehicle treatment. **p < 0.01 in AHR vs control siRNA samples with the same treatment.
Figure 2
Figure 2
MMP1 expression is induced by the AHR ligand FICZ in GOFs. (a) Three different GOF strains were grown under normal culture conditions then serum starved for 48 hours. Cells were then pre-treated with 1 μM FICZ for 1–2 hours followed by the addition of 5 ng/ml TGFβ to promote myofibroblast differentiation. After 24 hours, cells were collected and RNA was isolated for qPCR analysis of MMP1 mRNA and 18 S rRNA (control) levels. (b) Diagram of the MMP1 promoter reporter construct. The human MMP1 promoter region (−1030 to +146) is inserted upstream of the Renilla luciferase open reading frame. (c) Reporter constructs with the MMP1 promoter or without the promoter were introduced into three different GOFs strains and then treated with DMSO (vehicle), or FICZ (0.1 or 1.0 μM) for 16 hours after transfection. Then cells were lysed and Renilla activity was measured. (d) To determine if the ability of FICZ to induce MMP1-promoter activity is dependent upon AHR, the potent AHR inhibitor, CH-233191 (10 μM) was added 30 minutes prior to FICZ (1 μM). After 16 hours, cells were lysed and Renilla activity measured. Renilla activity levels were normalized to total protein and vehicle samples for both MMP1 and control promoters were set to 1.0. **p < 0.01 versus vehicle treatment, ##p < 0.01 vs FICZ alone treatment.
Figure 3
Figure 3
The AHR ligand FICZ increases MMP1 production and activity and decreases collagen 1 levels. GOFs were treated with the AHR ligand FICZ, 1 μM, for 1–2 hours before additional treatment with or without 5 ng/ml TGFβ to promote myofibroblast differentiation. At both 24 and 72-hour timepoints, media was collected and analyzed by Western blotting and Collagen I zymography. (a) Upper panel, equal amounts of protein from culture supernatant were loaded. Ponceau S staining, which shows a predominant band around 50 kDa, was used to confirm equal loading. MMP1 and collagen 1 (COL1A1) protein levels were determined by using specific antibodies as stated in the Methods section. Relative protein expression (R.E.) based on densitometry is shown below each blot. FICZ increases MMP1 levels while simultaneously decreasing COL1A1 levels particularly after 72 hours. Lower panel, the same culture supernatants were analyzed by zymography with collagen I as substrate. Relative MMP1 activity (R.A.) based on densitometry of the inverted zymography gels is shown below each image. Importantly, only the lower band represents MMP1 activity. (b) An additional GOF strain showing similar changes in MMP1 and collagen levels (upper panel) and MMP1 activity (lower panel). These experiments were performed in six different GOF strains and three different NOF strains with similar responses seen in all strains. Additional strain data is presented in Supplemental Figs. 1–3. Full length blots for Fig. (3a,b) can be seen in Supplemental Figs. 14 and 15, with full length blots from additional the strains in Supplemental Figs. 21–23.
Figure 4
Figure 4
MMP1 knockdown increases collagen I levels in GOFs. (a) GOFs were treated with control or MMP1 specific siRNA for 48 hours and then treated with either vehicle (DMSO) or the AHR ligand FICZ (1 µM) for 1 hour before addition of TGFβ (5 ng/mL) as indicated. (upper panel) After 72 hours of TGFβ treatment, cell extracts were isolated and analyzed by Western blot for MMP1, Collagen 1 (COL1A1) and β-tubulin (loading control). Relative protein expression (R.E.) based on densitometry are listed below the images. MMP1 siRNA reduced MMP1 protein expression and increased COL1A1 compared to control siRNA levels. (b) shows an additional strain with increased COL1A1 expression in the presence of MMP1 siRNA. Full length blots for (a,b) can be found in Supplemental Fig. 16. An additional strain was used for this experiment in Supplemental Fig. 4 with its corresponding full-length blots in Supplemental Fig. 24.
Figure 5
Figure 5
MMP1 knockdown attenuates FICZ mediated MMP1 production and activity. (a) GOFs were treated with control or MMP1 specific siRNA for 48 hours and then treated with either vehicle (DMSO) or the AHR ligand FICZ (1 µM), and TGFβ (5 ng/mL) as indicated. (upper panel) After 72 hours of TGFβ treatment, cell extracts were isolated and analyzed by Western blot for MMP1, MMP2, and β-tubulin (loading control). Relative protein expression (R.E.) based on densitometry are listed below the images. MMP1 siRNA reduced MMP1 protein expression to less than 15% of control siRNA levels. (b) Corresponding supernatants were also collected and analyzed using collagen I zymography. Relative MMP1 activity (R.A.) based on densitometry of the inverted zymography gel is shown below the image. The lower band, which represents MMP1 activity, is reduced more than 2-fold by MMP1 siRNA. The top band, which corresponds to the molecular weight of MMP2, is not altered by MMP1 siRNA. The experiment was also performed in additional GOF and NOF strains for comparison and these are shown in Supplemental Figs. 5 and 6. Full length blots for a,b are included in Supplemental Fig. 17. Full length blots for Supplemental Figs. 5 and 6 can be seen in Supplemental Figs. 25 and 26.
Figure 6
Figure 6
FICZ-induced MMP1 expression and activity occurs in an AHR-dependent manner. GOFs were treated with control or AHR specific siRNA for 48 hours and then treated with either vehicle (DMSO) or the AHR ligand FICZ (1 µM), and TGFβ (5 ng/mL) as indicated. (a) After 72 hours of TGFβ treatment, cell extracts were isolated and analyzed by Western blot for AHR, MMP1, and β-tubulin (loading control). Relative protein expression (R.E.) based on densitometry are listed below the images. AHR siRNA reduced AHR protein expression to less than 5% of control siRNA levels for all treatments tested. (b) Corresponding supernatants were also collected and analyzed using Western blotting (upper panel) and collagen I zymography (lower panel). Relative MMP1 levels (R.E.) based on densitometry are shown below the blot images. In the bottom panel, relative MMP1 activity (R.A.) based on densitometry of the inverted zymography gel is shown. The lower band, which represents MMP1 activity, is reduced in FICZ treated samples by more than 10-fold by AHR siRNA. The top band, which corresponds to the molecular weight of MMP2, is not altered by AHR siRNA. The experiment was also performed in additional GOF and NOF strains for comparison and data are shown in Supplemental Figs. 8–12. Full length blots for Fig. 6 can be seen in Supplemental Fig. 18 while full length blots for the additional strains are included in Supplemental Figs. 27–31.
Figure 7
Figure 7
FICZ-induced MMP1 expression is blocked by CH-223191 and AHR ligand-induced AHR protein degradation is blocked by CH-223191 and proteasome inhibitor MG132. (a) GOFs were plated and treated with vehicle or CH-223191 (at 1 or 10 μM) for 1 hour before treatment with vehicle or 1 μM FICZ for an additional 24 or 72 hours. CH-223191 was added every 24 hours in the 72-hour samples. Cell lysates were collected and analyzed by Western blotting for MMP1 and β-tubulin (loading control) (b). Cells treated as in (a) were analyzed for AHR and β-tubulin (loading control) by Western blot. (c) GOFs were plated and treated with vehicle or proteasome inhibitor MG132 (at 10 or 25 μM) for 1 hour before treatment with vehicle or 1 μM FICZ for an additional 24 or 72 hours. MG132 was added every 24 hours in the 72-hour samples. Cell lysates were collected and analyzed by Western blotting for AHR and β-tubulin (loading control). Full length blots are shown in Supplemental Fig. 19).
Figure 8
Figure 8
FICZ-induced MMP1 expression occurs in an ARNT-dependent manner. GOFs were treated with control or ARNT specific siRNA for 48 hours and then treated with either vehicle (DMSO) or the AHR ligand FICZ (1 µM), and TGFβ (5 ng/mL) as indicated. (a) After 72 hours of TGFβ treatment, cell extracts were isolated and analyzed by Western blot for ARNT, MMP1, and β-tubulin (loading control). Relative protein expression (R.E.) based on densitometry are listed below the images. ARNT siRNA reduced ARNT protein expression to 30 - 40% of control siRNA levels. Depletion of ARNT by ARNT siRNA blocks FICZ mediated induction of MMP1 expression. (b) An additional GOF strain is shown with the same setup as in (a). The experiment was also performed in a NOF strain and is presented in Supplemental Fig. 13. Full length blots for this figure are located in Supplemental Fig. 20. Full length blots for Supplemental Fig. 13 are found in Supplemental Fig. 32.
Figure 9
Figure 9
Summary of the role of AHR ligands in blocking TGFβ induced collagen deposition and myofibroblast formation in Thyroid eye disease. TGFβ signaling induces collagen 1 expression and myofibroblast formation in orbital fibroblasts. However, in the presence of an AHR ligand like FICZ, AHR binds to its ligand and then translocates to the nucleus. There, it heterodimerizes with its binding partner, ARNT. This complex activates transcription of the interstitial collagenase, MMP1. MMP1 is secreted into the extracellular matrix and degrades fibrous collagen in the extracellular space of the orbit.

Similar articles

Cited by

References

    1. Smith TJ, Hegedus L. Graves’ Disease. N Engl J Med. 2016;375:1552–1565. doi: 10.1056/NEJMra1510030. - DOI - PubMed
    1. Lehmann GM, Feldon SE, Smith TJ, Phipps RP. Immune mechanisms in thyroid eye disease. Thyroid. 2008;18:959–965. doi: 10.1089/thy.2007.0407. - DOI - PMC - PubMed
    1. Guo N, Woeller CF, Feldon SE, Phipps RP. Peroxisome proliferator-activated receptor gamma ligands inhibit transforming growth factor-beta-induced, hyaluronan-dependent, T cell adhesion to orbital fibroblasts. J Biol Chem. 2011;286:18856–18867. doi: 10.1074/jbc.M110.179317. - DOI - PMC - PubMed
    1. Bartalena L, et al. Does early response to intravenous glucocorticoids predict the final outcome in patients with moderate-to-severe and active Graves’ orbitopathy? J Endocrinol Invest. 2017;40:547–553. doi: 10.1007/s40618-017-0608-z. - DOI - PubMed
    1. Giannandrea M, Parks WC. Diverse functions of matrix metalloproteinases during fibrosis. Dis Model Mech. 2014;7:193–203. doi: 10.1242/dmm.012062. - DOI - PMC - PubMed

Publication types

MeSH terms