. 2020 May 21;10(1):8442.
doi: 10.1038/s41598-020-65606-9.

Bioinformatic analysis reveals the importance of epithelial-mesenchymal transition in the development of endometriosis

Affiliations

Bioinformatic analysis reveals the importance of epithelial-mesenchymal transition in the development of endometriosis

Meihong Chen et al. Sci Rep. .

Abstract

Background: Endometriosis is a frequently occurring disease in women, which seriously affects their quality of life. However, its etiology and pathogenesis are still unclear.

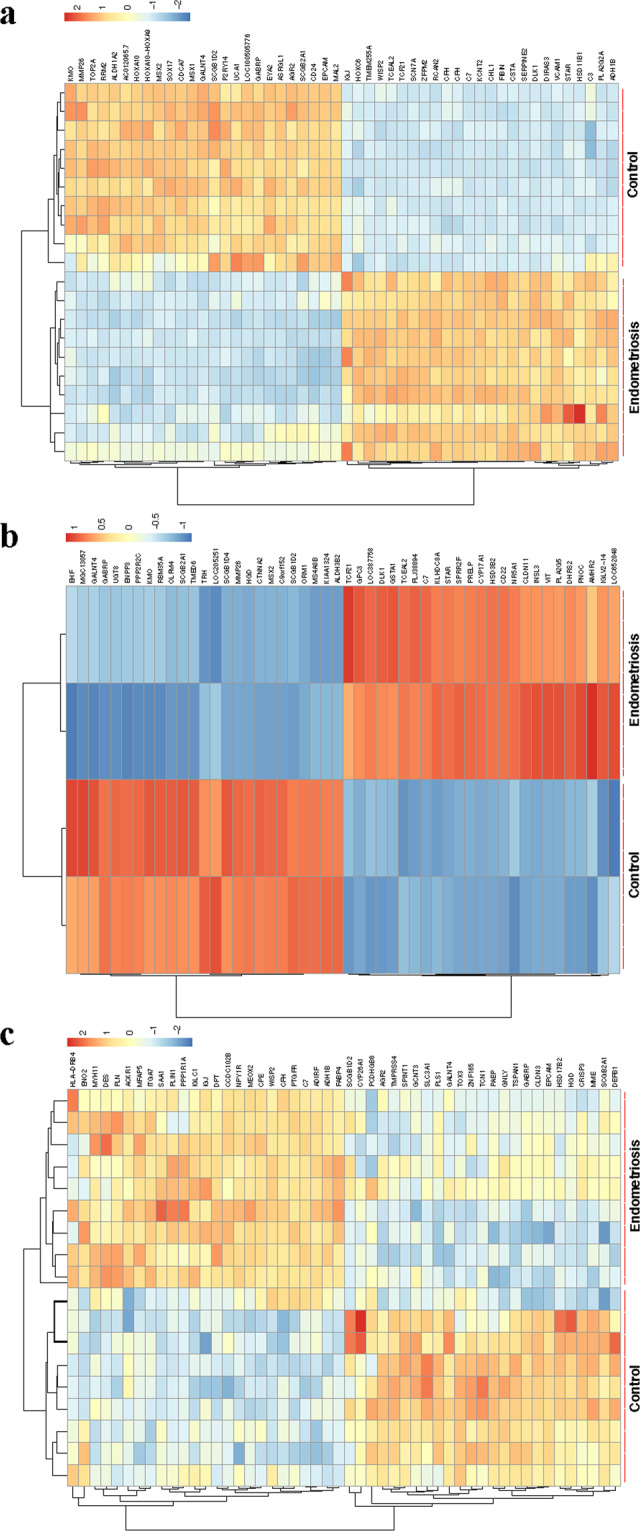
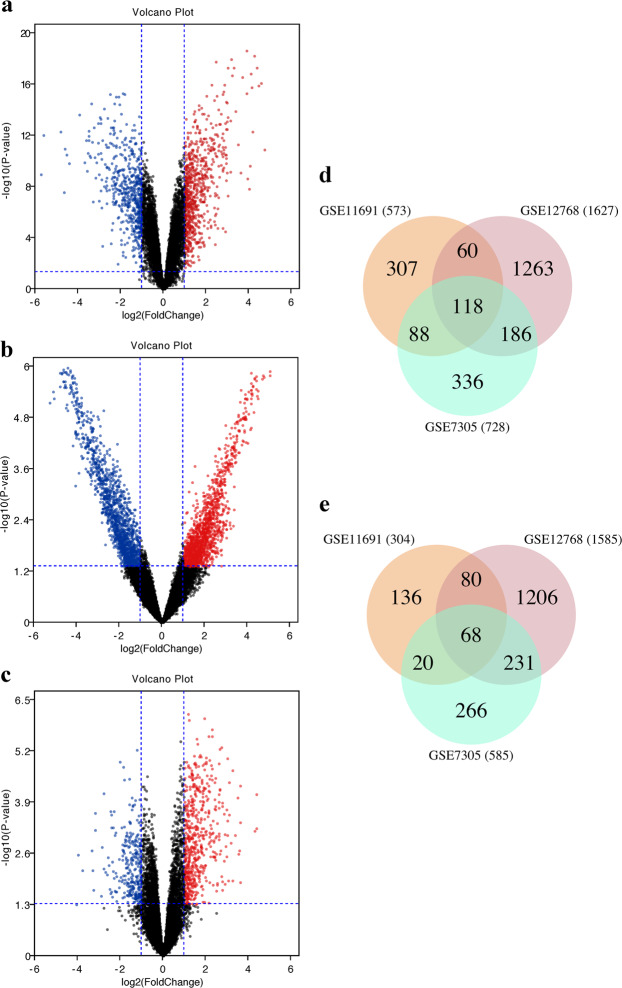
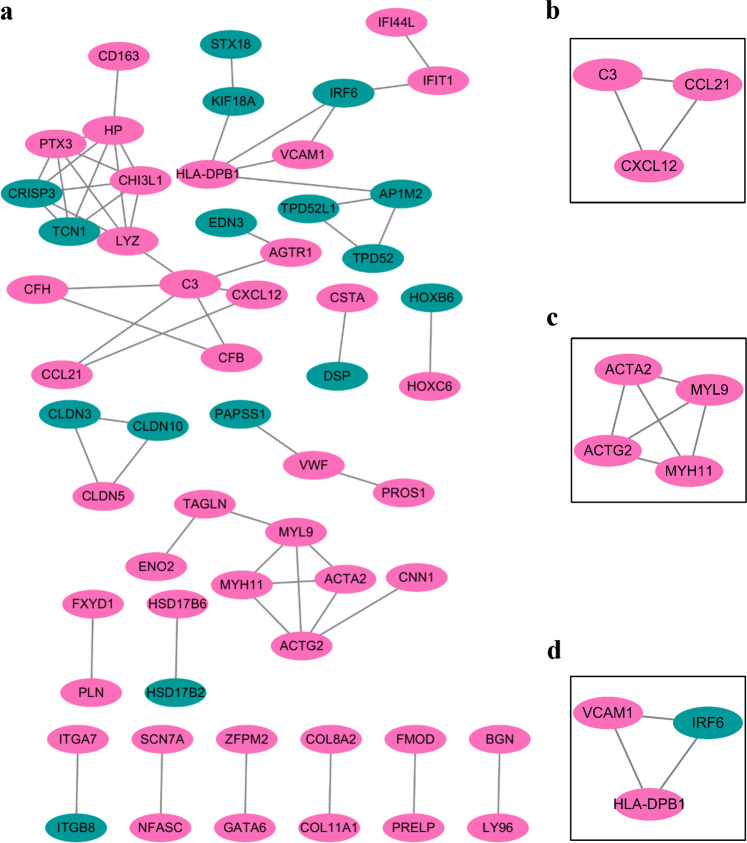
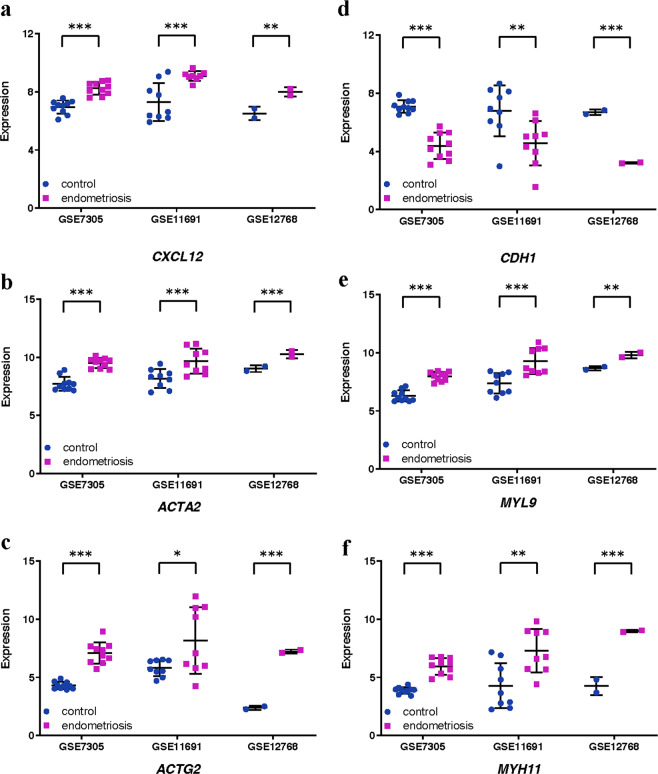
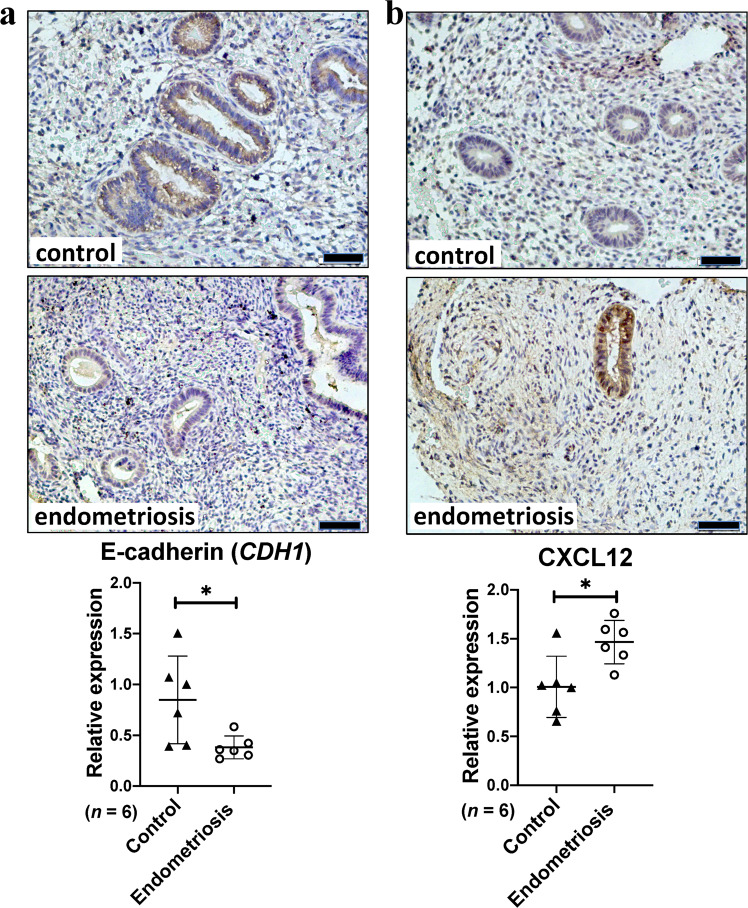
Methods: To identify key genes/pathways involved in the pathogenesis of endometriosis, we recruited 3 raw microarray datasets (GSE11691, GSE7305, and GSE12768) from Gene Expression Omnibus database (GEO), which contain endometriosis tissues and normal endometrial tissues. We then performed in-depth bioinformatic analysis to determine differentially expressed genes (DEGs), followed by gene ontology (GO), Hallmark pathway enrichment and protein-protein interaction (PPI) network analysis. The findings were further validated by immunohistochemistry (IHC) staining in endometrial tissues from endometriosis or control patients.

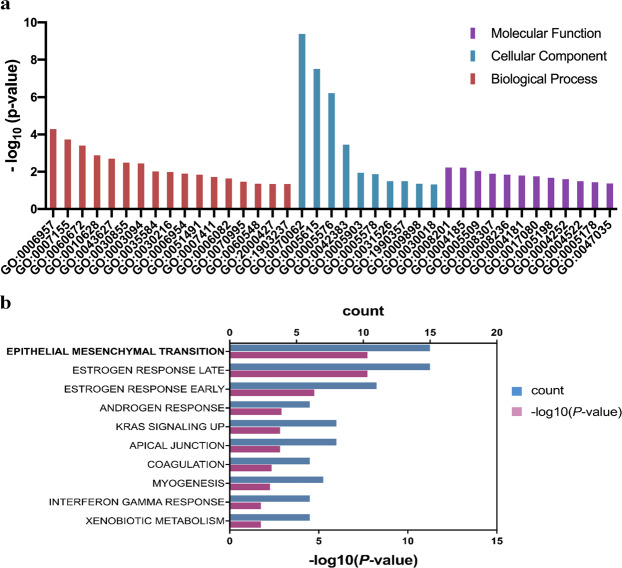
Results: We identified 186 DEGs, of which 118 were up-regulated and 68 were down-regulated. The most enriched DEGs in GO functional analysis were mainly associated with cell adhesion, inflammatory response, and extracellular exosome. We found that epithelial-mesenchymal transition (EMT) ranked first in the Hallmark pathway enrichment. EMT may potentially be induced by inflammatory cytokines such as CXCL12. IHC confirmed the down-regulation of E-cadherin (CDH1) and up-regulation of CXCL12 in endometriosis tissues.

Conclusions: Utilizing bioinformatics and patient samples, we provide evidence of EMT in endometriosis. Elucidating the role of EMT will improve the understanding of the molecular mechanisms involved in the development of endometriosis.


Conflict of interest statement

The authors declare no competing interests.

Figures

Figure 1
Figure 1
Heat maps and hierarchical clustering of the top 50 DEGs in endometriosis microarray datasets. Heat maps and hierarchal clustering analysis of top 50 DEGs in microarray datasets GSE7305 (a), GSE12768 (b), and GSE11691 (c). DEGs are those genes with P value <0.05 and Log[FC] > 1. Red indicates up-regulation and blue down-regulation.
Figure 2
Figure 2
Volcano plots and Venn diagrams of DEGs in endometriosis microarray datasets. Volcano plots showing DEGs in GSE7305 (a), GSE12768 (b) and GSE11691 (c). DEGs are those genes with P value <0.05 and [logFC]> 1. Red indicates relative up-regulated genes and blue indicates down-regulated genes. Venn diagrams of up-regulated (d) or down-regulated (e) DEGs from these three datasets, as indicated.
Figure 3
Figure 3
GO analysis and Hallmark pathway enrichment of DEGs in endometriosis. (a) GO analysis of DEGs in endometritis visualised on a bar chart clustered by molecular functions, cellular component and biological process. (b) Hallmark pathway enrichment of DEGs in endometriosis visualised on a bar chart, showing number of shared genes (count) and -Log10 (P value).
Figure 4
Figure 4
PPI network analysis of DEGs in endometriosis. Protein-Protein Interaction Network of DEGs from all datasets generated in String.db (v. 11) and visualised in Cytoscape (v. 3.7.1). (a) PPI network analysis of DEGs. (b–d) Representative local association graphs in PPI network analysis. Nodes indicate proteins/genes and lines indicate protein-protein interaction. Pink indicates up-regulation and green indicates down-regulation.
Figure 5
Figure 5
Expression levels of 6 genes in endometriosis microarray datasets. Graphs showing expression levels of CXCL12 (a), ACTA2 (b), ACTG2 (c), CDH1 (d), MYL9 (e) and MYH11 (f) in endometrial tissues from control (blue) or endometriosis (purple) patients in three endometriosis microarray datasets, as indicated. Data are mean ± s.d. *P value <0.05.** P value <0.01. *** P value <0.001.
Figure 6
Figure 6
Expression levels of E-cadherin (CDH1) and CXCL12 in endometriosis. Representative E-cadherin (a) or CXCL12 (b) expression in endometrial tissues from control or endometriosis patients. Scale bars: 50 μm. Graphs showing comparisons of E-cadherin (a, P = 0.028) or CXCL12 (b, P = 0.015) expression in endometrial tissues from 6 control or endometriosis patients. Data are mean ± s.d.

References

    1. Zannoni L, Forno SD, Paradisi R, Seracchioli R. Endometriosis in Adolescence: Practical Rules for an Earlier Diagnosis. Pediatric annals. 2016;45:e332–335. doi: 10.3928/19382359-20160727-03. - DOI - PubMed
    1. Johnson NP, et al. World Endometriosis Society consensus on the classification of endometriosis. Human reproduction. 2017;32:315–324. doi: 10.1093/humrep/dew293. - DOI - PubMed
    1. Liang Y, Yao S. Potential role of estrogen in maintaining the imbalanced sympathetic and sensory innervation in endometriosis. Molecular and cellular endocrinology. 2016;424:42–49. doi: 10.1016/j.mce.2016.01.012. - DOI - PubMed
    1. Sourial S, Tempest N, Hapangama DK. Theories on the pathogenesis of endometriosis. International journal of reproductive medicine. 2014;2014:179515. doi: 10.1155/2014/179515. - DOI - PMC - PubMed
    1. Sofo V, et al. Correlation between dioxin and endometriosis: an epigenetic route to unravel the pathogenesis of the disease. Archives of gynecology and obstetrics. 2015;292:973–986. doi: 10.1007/s00404-015-3739-5. - DOI - PubMed

Publication types