. 2020 May 21;11(1):2550.
doi: 10.1038/s41467-020-16319-0.

Glycopeptide epitope facilitates HIV-1 envelope specific humoral immune responses by eliciting T cell help

Affiliations

Glycopeptide epitope facilitates HIV-1 envelope specific humoral immune responses by eliciting T cell help

Lina Sun et al. Nat Commun. .

Abstract

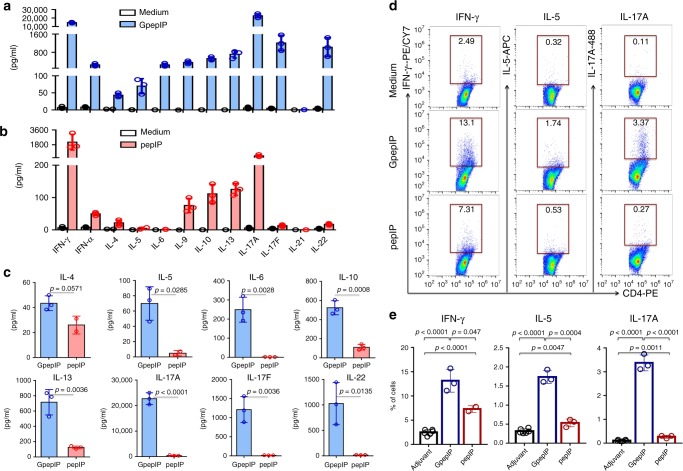
The inherent molecular complexity of human pathogens requires that mammals evolved an adaptive immune system equipped to handle presentation of non-conventional MHC ligands derived from disease-causing agents, such as HIV-1 envelope (Env) glycoprotein. Here, we report that a CD4+ T cell repertoire recognizes a glycopeptide epitope on gp120 presented by MHCII pathway. This glycopeptide is strongly immunogenic in eliciting glycan-dependent cellular and humoral immune responses. The glycopeptide specific CD4+ T cells display a prominent feature of Th2 and Th17 differentiation and exert high efficacy and potency to help Env trimer humoral immune responses. Glycopeptide-induced CD4+ T cell response prior to Env trimer immunization elicits neutralizing antibody development and production of antibodies facilitating uptake of immunogens by antigen-presenting cells. Our identification of gp120 glycopeptide-induced, T cell-specific immune responses offers a foundation for developing future knowledge-based vaccines that elicit strong and long-lasting protective immune responses against HIV-1 infection.


Conflict of interest statement

The authors declare no competing interests.

Figures

Fig. 1
Fig. 1. gp120 glycopeptide epitopes are recognized by CD4+ T cells.
BALB/c mice were immunized with pooled gp120 glycopeptides (prepared by protease digestion of gp120). After booster immunization, CD4+ T cells were isolated and stimulated in vitro with either intact gp120 or PNGase F–treated, deglycosylated gp120 (DG-gp120) in the presence of mitomycin C-treated APCs for 5 days. a, b Flow cytometric analysis of T cell proliferation by CFSE division among CD4+ T cells. c, d Production of IL-4 c and IFN-γ d in the culture supernatant after T cell stimulation was measured by ELISA. e Recognition of coated gp120 by antiserum from mice immunized with gp120 glycopeptides in the presence of the indicated inhibitors was examined by competition ELISA using a serum dilution 1:1600. Serum titers are reported as OD at 405 nm. fh Serum from mice immunized with pooled gp120 glycopeptides were collected 7 days after booster immunization. Titers of IgG1 f, IgG2a g, and IgG3 h for recognition of glycosylated gp120 or deglycosylated gp120 were measured by ELISA. Representative results are shown from one of three independent experiments performed. (mean ± s.d.). b n = 6 independent experiments. c n = 5 for medium and DG-gp120; n = 4 for gp120. n = 4, 3, 2, 2, 2 independent experiments for dh, respectively. P-values were determined using Student’s two-sided t-tests. Source data are provided as a Source Data file.
Fig. 2
Fig. 2. Characterization of a gp120 glycotope presented by MHCII.
a–c MS/MS spectra of a gp120 variable-region (V2) glycopeptide (designated GpepIP) identified from MHCII-bound epitopes shows b- and y-ions defining peptide sequence KLDVVPIDNNN187TSY in the non-protease group a, peptide sequence LDVVPIDNNN187TSYR in the trypsin-treated group b, peptide sequence LDVVPIDNNN187TSYR in the chymotrypsin-treated group c, and the N-glycosylation site at N187 in all three groups. The @ symbol denotes that the conversion of an Asn residue to Asp with a heavy oxygen was detected at the indicated position. d, e Binding of the GpepIP epitope to MHCII molecule was verified. d Purified MHCII monomers (mouse allele I-Ad) were loaded with an equal amount of the indicated peptides. Peptide-loaded MHCII heterodimers were detected by running of complexes in IEF gel and immunoblotting with mouse MHCII antibody. Representative results are shown from one of three independent experiments performed. e Bands corresponding to GpepIP/MHCII, pepIP/MHCII, and OVA peptide/MHCII complexes were excised from IEF gels and subjected to LC–MS/MS analysis. Extracted ion chromatograms demonstrate the binding of three GpepIP glycoforms (M5N2 being the most abundant). PepIP and the positive control (OVA peptide) also bound and stabilized MHCII heterodimers. Source data are provided as a Source Data file.
Fig. 3
Fig. 3. The glycopeptide epitope GpepIP elicits a glycan-dependent cellular and humoral immune response.
a, b CD4+ T cells obtained from mice immunized with gp120 were stimulated in vitro in the presence of mitomycin C-treated APCs pulsed with either GpepIP or pepIP, and T cell proliferation was examined by flow cytometry with use of CFSE fluorescence dilution through cell division. c, d CD4+ T cells obtained from mice immunized with GpepIP expressed in GnT1−/− cells c or with pepIP d were stimulated with GpepIP expressed in GnTI−/− or 293F cells or with pepIP in the presence of mitomycin C-treated APCs, and T cell proliferation was examined by CFSE flow cytometry. e, f Antisera from mice immunized with GpepIP or pepIP were titrated for IgG binding to immobilized GpepIP e or pepIP f by ELISA. g Antisera from GpepIP and pepIP immunization groups recognize gp120 expressed in 293-F and GnTI−/− cells differentially as measured by ELISA using a serum dilution 1:400. hj Serum from mice immunized with GpepIP expressed in GnT1−/− cells were collected 7 days after booster immunization. As a control, serum from naïve mice was used as background. Titers of IgG1 h, IgG2a i, and IgG3 j for recognition of glycosylated gp120 or deglycosylated gp120 were measured by ELISA. Data was presented after subtracting background. Representative results are shown from one of three independent experiments performed. (mean ± s.d.). b medium n = 4; GpepIP and pepIP n = 6 independent experiments. c medium and GpepIP (GnTI) n = 4; GpepIP (293-F) and pepIP n = 5 independent experiments. n = 4 for e and f; n = 8 for g; n = 2 independent experiments for h, i, and j. P-values were determined using Student’s two-sided t-tests. Source data are provided as a Source Data file.
Fig. 4
Fig. 4. Transcriptomic analysis of GpepIP-stimulated and pepIP-stimulated CD4+ T cell populations.
a Gating strategy of sorting antigen-specific CD4+ T cell populations by flow cytometry is shown. Three weeks after the third immunization with GpepIP or pepIP, splenic and lymph node cells were isolated and stimulated in vitro with GpepIP or pepIP, respectively, for 3 days. CD4+CD69+ and CD4+CD69 T cell populations were then sorted by flow cytometry. b Dendrogram and hierarchical clustering heat map of genes from control, GpepIP, and pepIP populations. The blue and red bands indicate low and high gene expression quantity, respectively. The vertical distances between branches of the dendrogram represent the similarity of gene expression profiles between samples. Biological replicates showed the highest degree of correlation followed by GpepIP or pepIP stimulated populations. c The number of upregulated, downregulated, and unchanged genes in GpepIP and pepIP stimulated CD4+ T cells compared to control or to each other is shown. d KEGG pathway enrichment analysis of DEGs from each comparison. Point size indicates DEG number (the bigger dots refer to larger amount). Rich factor refers to the value of enrichment factor which is the quotient of the number of DEGs and total gene amount in that pathway. Pathways associated with Th cell differentiation were highlighted by red rectangles. e Heat map depicts the DEGs associated with Th1 and Th2 cell differentiation, IL-17-signaling pathway, and Th17 cell differentiation between GpepIP and pepIP specific CD4+ T cells with normalization to control. Heatmap colors represent the log2-fold change values relative to the control. f Volcano plot showing the gene signature of GpepIP compared to pepIP-specific CD4+ T cells. X-axis represents log2-transformed fold change. Y-axis represents −log10 transformed significance. Red points represent up-regulated DEGs. Blue points represent down-regulated DEGs. Gray points represent non-DEGs. Genes associated with Th cell differentiation were labeled and highlighted.
Fig. 5
Fig. 5. Cytokine profile of GpepIP and pepIP stimulation.
Splenic and lymph node cells isolated from GpepIP or pepIP immunized mice were stimulated with GpepIP or pepIP, respectively, for 5 days. Th-cell-related cytokines in the supernatants from GpepIP a or pepIP b stimulation compared to no stimulation (medium) were analyzed by a multiplex-based assay. c Production of cytokines associated with Th2 (IL4, IL-5, IL-6, IL-10, and IL-13) and Th17 (IL-17A, IL-17F, and IL-22) was examined in GpepIP-stimulated and pepIP-stimulated groups. d, e Cells in a and b were stimulated with GpepIP or pepIP or in medium for 3 days. Cytokines IFN-γ, IL-5, and IL-17A on CD4+ T cells were assessed by intracellular cytokine staining and flow cytometry. Representative results are shown from one of two independent experiments performed. (mean ± s.d.). ac n = 3 independent experiments. e n = 6 for medium; n = 3 independent experiments for GpepIP and pepIP. P-values were determined using Student’s two-sided t-tests. Source data are provided as a Source Data file.
Fig. 6
Fig. 6. GpepIP-specific CD4+ T cells exhibit high potency on helping humoral immune responses to HIV-1 trimer.
a Immunization scheme. BALB/c mice were primed twice by subcutaneous injection of GpepIP or pepIP emulsified in Freund’s adjuvant or of adjuvant alone. Three weeks later, all groups were immunized with the clade A BG505 gp140 NFL trimer emulsified in incomplete Freund’s adjuvant. Sera were collected at the indicated time points. Mice were euthanized 10 days after trimer immunization. b Splenic and lymph node cells were isolated and stimulated with GpepIP or pepIP in vitro for 5 days. T cell proliferation by CFSE dilution was measured by flow cytometry. c BG505-specific IgG production was examined in all three groups across the indicated time points by ELISA using a serum dilution 1:100. d GC response, defined by the percentage of GL7+Fas+ B cells among B220+ B cells, was evaluated in all three groups on day 10 after trimer immunization by flow cytometry. eg Expression levels of activation marker CD69 e, CD80 f, and MHCII g were detected on splenic B cells after in vitro stimulation with the BG505 trimer for 3 days. MFI mean fluorescence intensity. Representative results are shown from one of three independent experiments performed. (mean ± s.d.). b medium n = 2; GpepIP or pepIP n = 3 independent experiments. d n = 4 independent experiments. eg medium n = 2; BG505 n = 3 independent experiments. P-values were determined using Student’s two-sided t-tests. Source data are provided as a Source Data file.
Fig. 7
Fig. 7. GpepIP primary immunization prior to trimer immunization elicits functional antibody production.
a Immunization scheme. BALB/c mice were primed three times (with a 3-week interval) by subcutaneous injection of GpepIP or pepIP emulsified in Freund’s adjuvant or of adjuvant alone. Subsequently, all groups were immunized with the clade A BG505 gp140 NFL trimer adjuvanted with Alum for three times (with a 3-week interval). Sera were collected 7 days after each trimer immunization (post 1–3). b BG505-specific IgG production was examined in all three groups post each trimer immunization by ELISA using a serum dilution 1:400. c Antisera from all three groups after the third trimer immunizations were analyzed for IgG subclass switching by ELISA using a serum dilution 1:1600. d The neutralizing activity (neutralization 50% inhibitory dilution (ID50)) of antisera from adjuvant, GpepIP, and pepIP primary followed by three BG505 booster immunizations were tested against tier 1 and tier 2 HIV-1 viruses via a TZM-bl cell-based neutralization assays. MLV-pseudotyped virus was used as negative control for non-HIV-1-specific inhibitory activity in the assay. Antibody CH01-31 was used as positive control (shown as antibody concentration). e BG505 was chemically labeled with fluorescein isothiocyanate (FITC) and incubated with BMDCs at 37 °C for 2 h. Cells were then collected and antigen uptake was measured by flow cytometry. To evaluate antisera for their function, fluorophore-labeled BG505 was pre-incubated with antisera used in e at different dilutions before adding into BMDCs. The uptake rate is defined as FITC-positive cells compared to no BG505 (medium) group. Representative results are shown from one of three independent experiments performed. (mean ± s.d.). b n = 6 for pre-bleed; n = 2 independent experiments for post 1–3. n = 4 and 3 independent experiments for c and e, respectively. P-values were determined using Student’s two-sided t-tests. Source data are provided as a Source Data file.

Similar articles

Cited by

References

    1. Kibret GD, et al. Trends and spatial distributions of HIV prevalence in Ethiopia. Infect. Dis. Poverty. 2019;8:90. - PMC - PubMed
    1. Klein F, et al. Antibodies in HIV-1 vaccine development and therapy. Science. 2013;341:1199–1204. - PMC - PubMed
    1. Kwong PD, Mascola JR, Nabel GJ. Broadly neutralizing antibodies and the search for an HIV-1 vaccine: the end of the beginning. Nat. Rev. Immunol. 2013;13:693–701. - PubMed
    1. Koff, W. C. et al. Accelerating next-generation vaccine development for global disease prevention. Science340, 1232910 10.1126/science.1232910 (2013). - PMC - PubMed
    1. Raska M, et al. Glycosylation patterns of HIV-1 gp120 depend on the type of expressing cells and affect antibody recognition. J. Biol. Chem. 2010;285:20860–20869. - PMC - PubMed

Publication types

MeSH terms