. 2020 May 21;10(1):8461.
doi: 10.1038/s41598-020-65354-w.

The use of spectrograms improves the classification of wheezes and crackles in an educational setting

Affiliations

The use of spectrograms improves the classification of wheezes and crackles in an educational setting

J C Aviles-Solis et al. Sci Rep. .

Abstract

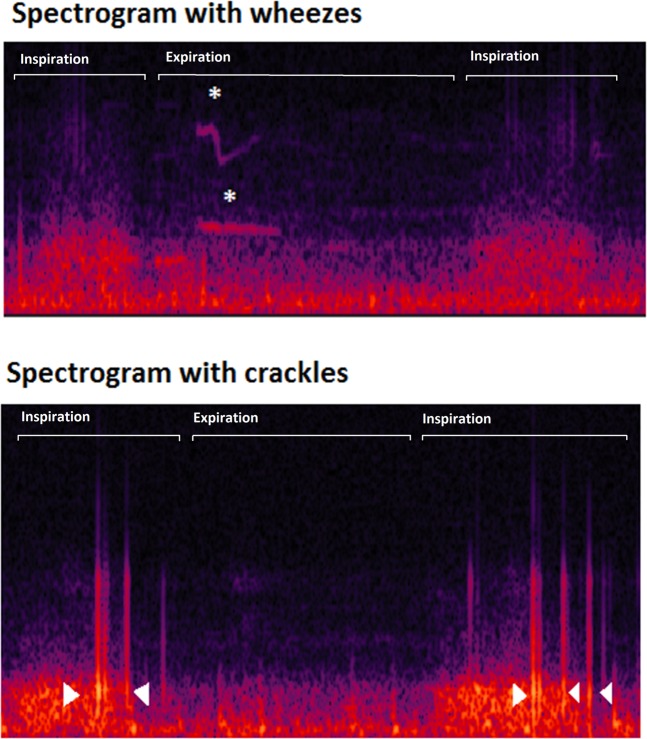
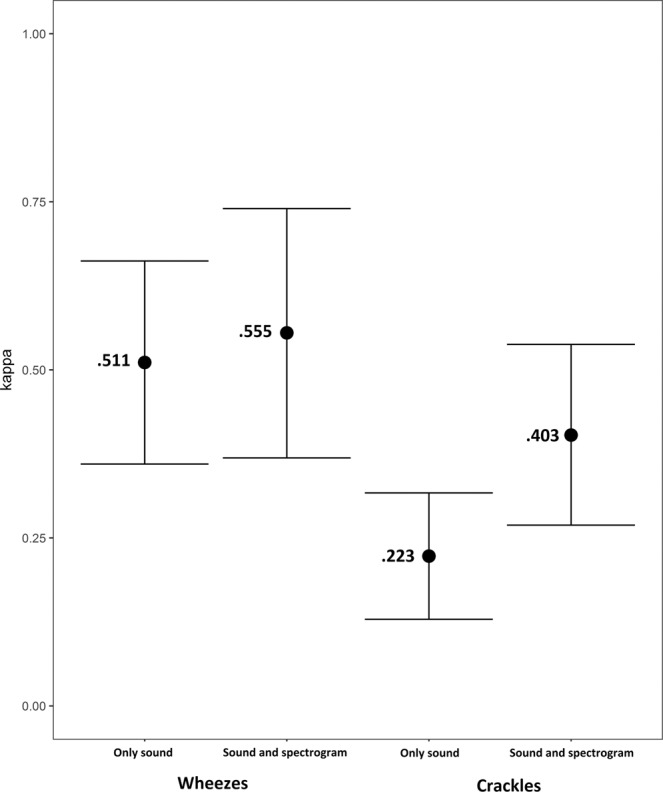
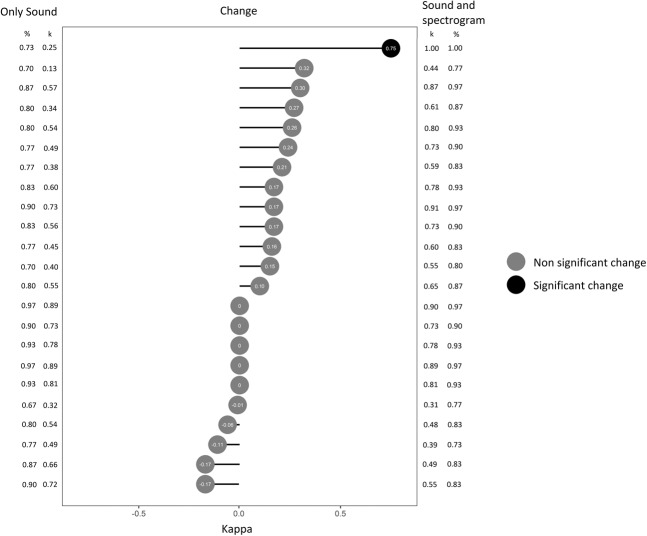
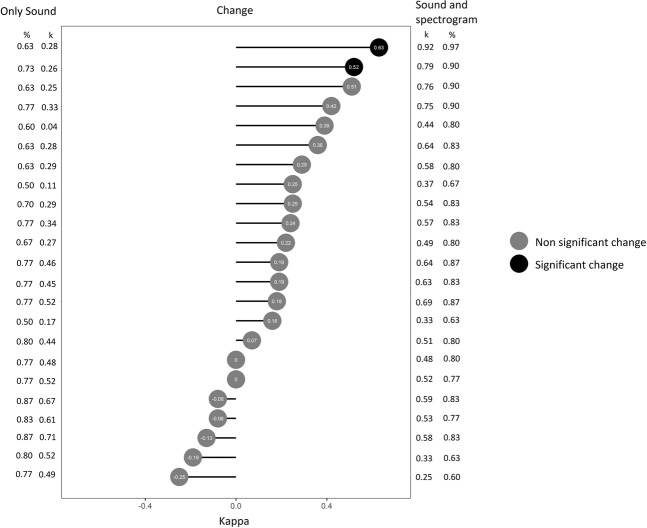
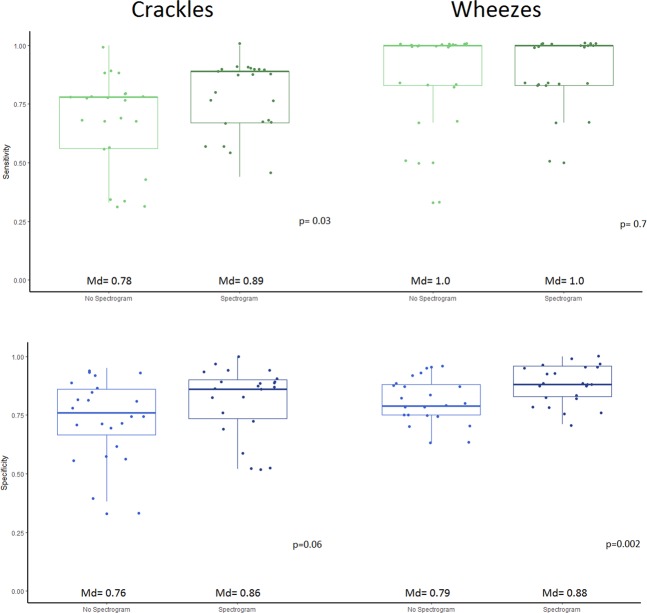
Chest auscultation is a widely used method in the diagnosis of lung diseases. However, the interpretation of lung sounds is a subjective task and disagreements arise. New technological developments like the use of visSual representation of sounds through spectrograms could improve the agreement when classifying lung sounds, but this is not yet known. In this study, we tested if the use of spectrograms improves the agreement when classifying wheezes and crackles. To do this, we asked twenty-three medical students at UiT the Arctic University of Norway to classify 30 lung sounds recordings for the presence of wheezes and crackles. The sample contained 15 normal recordings and 15 with wheezes or crackles. The students classified the recordings in a random order twice. First sound only, then sound with spectrograms. We calculated kappa values for the agreement between each student and the expert classification with and without display of spectrograms and tested for significant improvement between these two coefficients. We also calculated Fleiss kappa for the 23 observers with and without the spectrogram. In an individual analysis comparing each student to an expert annotated reference standard we found that 13 out of 23 students had a positive change in kappa when classifying wheezes with the help of spectrograms. When classifying crackles 16 out of 23 showed improvement when spectrograms were used. In a group analysis we observed that Fleiss kappa values were k = 0.51 and k = 0.56 (p = 0.63) for classifying wheezes without and with spectrograms. For crackles, these values were k = 0.22 and k = 0.40 (p = <0.01) in the same order. Thus, we conclude that the use of spectrograms had a positive impact on the inter-rater agreement and the agreement with experts. We observed a higher improvement in the classification of crackles compared to wheezes.


Conflict of interest statement

The authors declare no competing interests.

Figures

Figure 1
Figure 1
Examples of spectrograms of lung sound recordings showing the presence of wheezes (stars) and crackles (arrowheads).
Figure 2
Figure 2
Illustration showing the different places where lung sounds were recorded. (1_2) Between the spine and the medial border of the scapula at the level of T4–T5; (3_4) at the middle point between the spine and the mid-axillary line at the level of T9–T10; (5_6) at the intersection of the mid-clavicular line and second intercostal space.
Figure 3
Figure 3
Fleiss kappa for the group of 23 participants when classifying wheezes and crackles with only sound and sound plus spectrogram.
Figure 4
Figure 4
Cohen’s kappa of each participant when classifying wheezes with only sound (left) and with sound and spectrograms (right) compared to the reference standard. The change in kappa between the two classifications and its statistical significance is illustrated at the center. Proportion of agreement (%) is presented on the lateral columns.
Figure 5
Figure 5
Cohen’s kappa of each participant when classifying crackles with only sound (left) and with sound and spectrograms (right) compared to the reference standard. The change in kappa between the two classifications and its statistical significance is illustrated at the center. Proportion of agreement (%) is presented on the lateral columns.
Figure 6
Figure 6
Box and whiskers diagrams showing the change in sensitivity and specificity of the students classifying wheezes and crackles with and without spectrograms. The answers of the experts were considered as the reference standard. P values shown were obtained from the test of difference between means using paired Wilcoxon signed rank test with continuity correction. Md= Median.

Similar articles

Cited by

References

    1. Turnbull S, et al. What gives rise to clinician gut feeling, its influence on management decisions and its prognostic value for children with RTI in primary care: a prospective cohort study. BMC Fam Pract. 2018;19:25. doi: 10.1186/s12875-018-0716-7. - DOI - PMC - PubMed
    1. Badgett RG, Lucey CR, Mulrow CD. Can the clinical examination diagnose left-sided heart failure in adults? JAMA. 1997;277:1712–1719. doi: 10.1001/jama.1997.03540450068038. - DOI - PubMed
    1. Benbassat J, Baumal R. Narrative review: should teaching of the respiratory physical examination be restricted only to signs with proven reliability and validity? J Gen Intern Med. 2010;25:865–872. doi: 10.1007/s11606-010-1327-8. - DOI - PMC - PubMed
    1. Brooks D, Thomas J. Interrater reliability of auscultation of breath sounds among physical therapists. Phys Ther. 1995;75:1082–1088. doi: 10.1093/ptj/75.12.1082. - DOI - PubMed
    1. Margolis P, Gadomski A. The rational clinical examination. Does this infant have pneumonia? JAMA. 1998;279:308–313. - PubMed

Publication types