. 2020 Sep;38(9):1087-1096.
doi: 10.1038/s41587-020-0502-7. Epub 2020 May 18.

Extending the small-molecule similarity principle to all levels of biology with the Chemical Checker

Affiliations

Extending the small-molecule similarity principle to all levels of biology with the Chemical Checker

Miquel Duran-Frigola et al. Nat Biotechnol. 2020 Sep.

Erratum in

Abstract

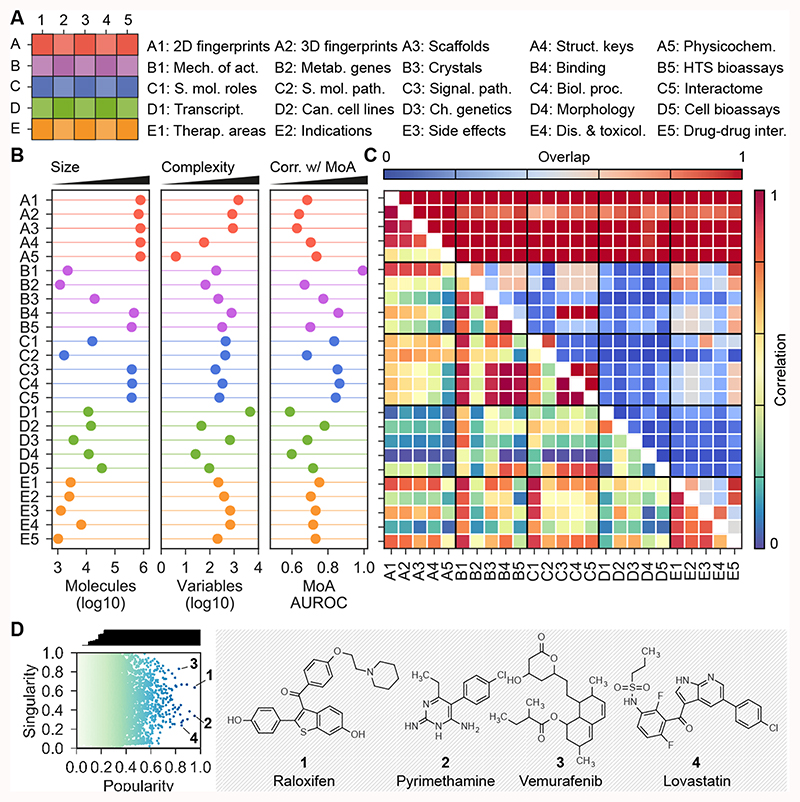
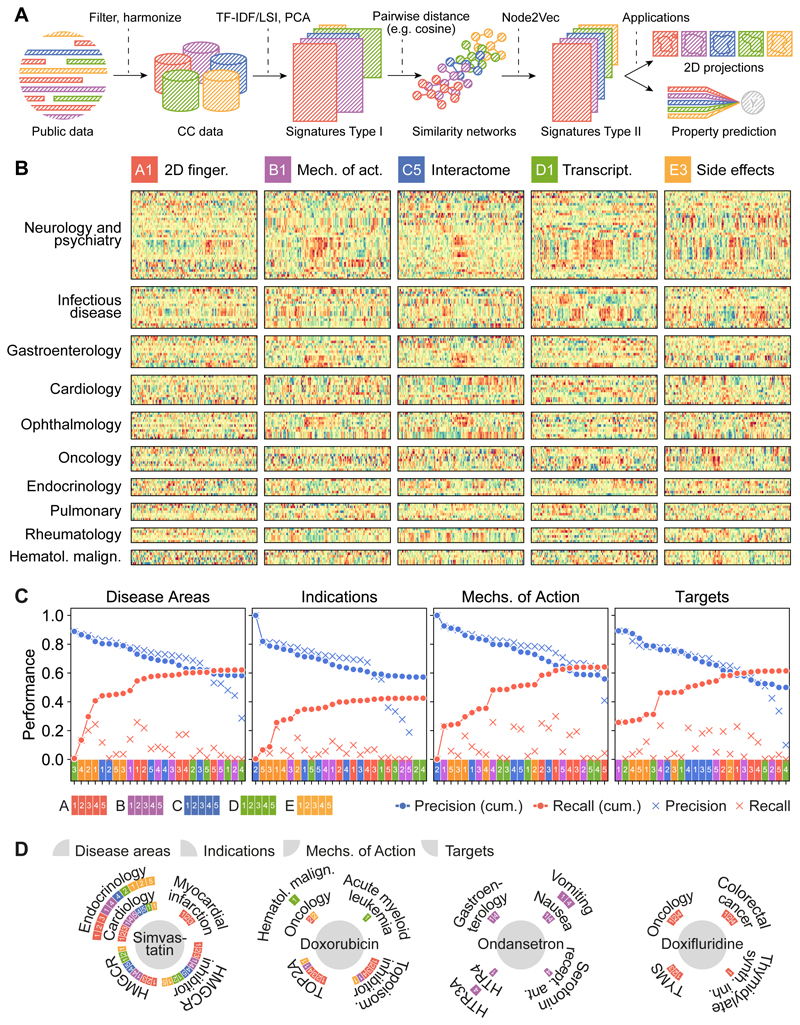
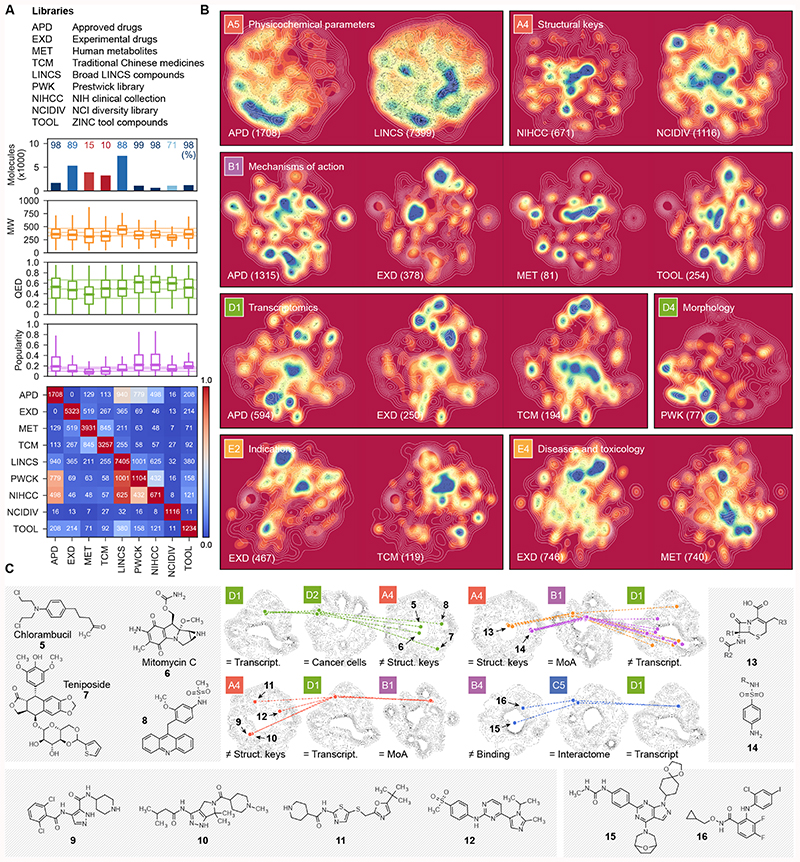
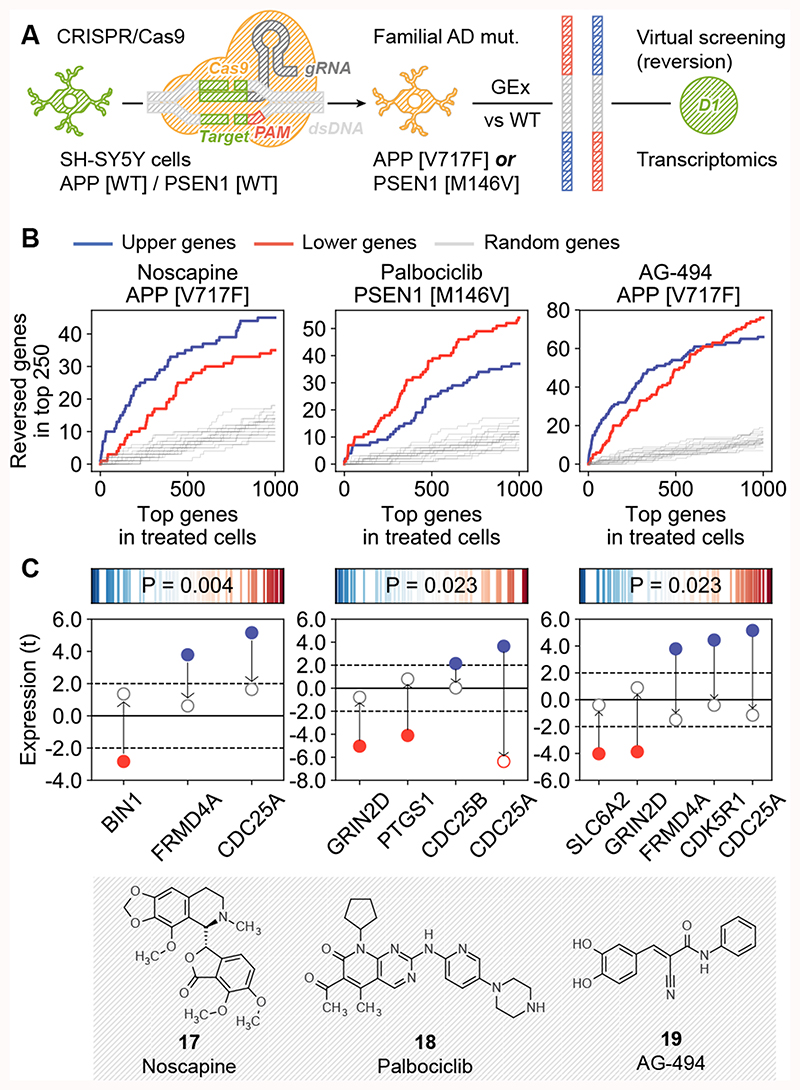
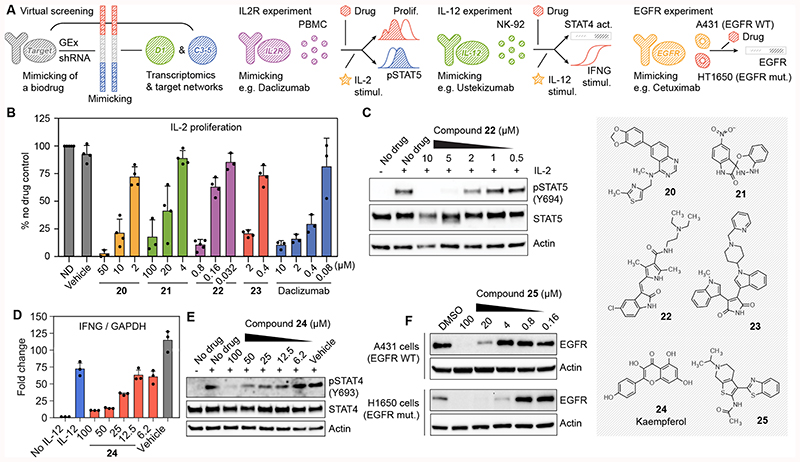
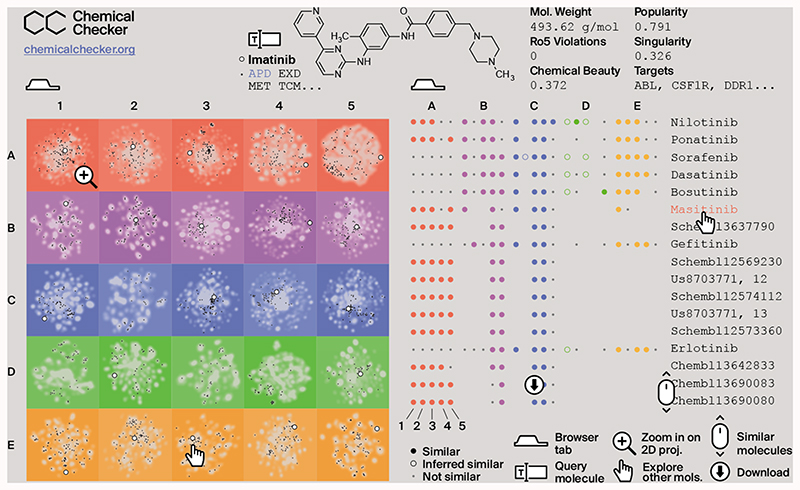
Small molecules are usually compared by their chemical structure, but there is no unified analytic framework for representing and comparing their biological activity. We present the Chemical Checker (CC), which provides processed, harmonized and integrated bioactivity data on ~800,000 small molecules. The CC divides data into five levels of increasing complexity, from the chemical properties of compounds to their clinical outcomes. In between, it includes targets, off-targets, networks and cell-level information, such as omics data, growth inhibition and morphology. Bioactivity data are expressed in a vector format, extending the concept of chemical similarity to similarity between bioactivity signatures. We show how CC signatures can aid drug discovery tasks, including target identification and library characterization. We also demonstrate the discovery of compounds that reverse and mimic biological signatures of disease models and genetic perturbations in cases that could not be addressed using chemical information alone. Overall, the CC signatures facilitate the conversion of bioactivity data to a format that is readily amenable to machine learning methods.


Conflict of interest statement

Conflict of interest

The authors declare no conflict of interest.

Figures

Figure 1
Figure 1. CC statistics.
(A) The organization of the 5x5 CC spaces. (B) Number of molecules (size), signature length (i.e. number of latent variables as a measure of data complexity) and AUROC performances when checking if similar molecules in each CC space tend to share mechanism of action. (C) Overlap between CC spaces, in terms of number of shared molecules (upper triangle) and correlation k between CC spaces (lower triangle). (D) Popularity and singularity of molecules. Popularity refers to the proportion of CC spaces in which the molecule is present (correcting for correlation between CC spaces), and singularity refers to the ‘uniqueness’ of the molecule. The larger the number of molecules showing similarity to a given molecule, the less singular the molecule is. Popular molecules within a wide range of singularities are highlighted. For example, raloxifen (1), pyrimethamine (2) and vemurafenib (3) have data in many CC spaces. Likewise, some molecules are more singular than other for which many analogs exist throughout the CC organization (e.g. lovastatin (4)).
Figure 2
Figure 2. CC signatures visualized.
(A) Scheme of the CC pipeline. Public data are filtered, harmonized and unified in the 5x5 CC organization. For each CC space, we obtain type I signatures by doing a (TF-IDF) LSI/PCA dimensionality reduction. With signatures type I, molecules can be compared pairwise to obtain a similarity network. A network embedding algorithm (node2vec) is then applied to derive fixed-length signatures (type II). Type I and/or type II signatures can be used for customary machine learning tasks such as data visualization and property prediction. (B) We plot the numerical values of type II signatures for drugs extracted from the Drug Repurposing Hub, and organize them by disease areas. We chose one illustrative dataset for each CC level, namely A1, B1, C5, D1 and E3. Signatures show, for instance, how chemically unrelated neurological drugs elicit similar patterns of side effects. Likewise, ophthalmological drugs sharing mechanism of action trigger different transcriptional responses. (C) Precision and recall of label predictions (disease areas, indications, mechanisms of action and targets from the Drug Repurposing Hub, Methods). CC spaces are sorted by precision (blue). Recall of molecule-label pairs is shown in red. Dots correspond to cumulative performances (i.e. appending molecule-labels pairs predicted by CC spaces consecutively). Crosses denote individual performances of CC spaces. (D) Examples of true positives, indicating the CC spaces that account for the prediction. Please note that the Drug Repurposing Hub was not included in the CC at the time of compilation.
Figure 3
Figure 3. Characterization of compound collections with the CC.
(A) Number of CC molecules present in nine representative chemical libraries. The CC coverage of the libraries is shown as a percentage (upper plot), together with molecular weight (MW), chemical beauty (QED) and popularity scores distributions (middle plot). The overlap between molecules in the compound collections is shown in the heatmap (bottom plot). The libraries contain between 671 (NIHCC) and 7,405 (LINCS) compounds with modest overlap among them. Molecules in the different collections have molecular weights in the 250-500 Da range and comparable indexes of drug-likeness. Virtually all molecules in the APD, PWCK, NIHCC and TOOL collections are catalogued in the CC, while only 10% of the traditional Chinese medicine ingredients have a reported bioactivity. As expected, APD are the most popular compounds, followed by the well-annotated chemicals in the PWCK and NIHCC libraries. (B) 2D projections of CC signatures. White lines represent the background distribution of all the molecules in each CC space, and colormaps display the densities of molecules in the indicated collection; in parenthesis, the number of molecules of the collection in the corresponding CC space is shown. (C) Illustrative complex CC queries. Molecules are mapped in more than one CC space, being similar (=) in some of them or different in others (≠). Structures of the selected examples are given.
Figure 4
Figure 4. Signature reversion of AD-specific transcriptional profiles.
(A) Scheme of the methodology. SH-SY5Y cells were modified with CRISPR to harbor fAD mutations. AD-specific transcriptional signatures were obtained by differential gene expression analysis of mutated-vs-WT gene expression profiles. These signatures were flipped (reversed) and converted to the D1 CC format. Drug candidates were selected based on D1 similarities to the signatures. (B) Experimental results for the three tested candidates, namely noscapine (17), palbociclib (18) and AG-494 (19). In the x-axis, genes are ranked by differential gene expression of treated-vs-untreated mutated cells (APPV7171F or PSEN1M146V); this axis relates to both tails of the ranked list (up/down). Correspondingly, in the y-axis we count the number of genes in the mutated-vs-WT signatures that were reverted upon treatment (top 250 genes, up- (blue) and down- (red) regulations). For example, ~20 of the up-regulated (blue) genes in PSEN1M146V cells are in the top-500 down-regulated genes after treatment with palbociclib, and ~40 of the down-regulated (red) genes in the PSEN1M146V-vs-WT comparison are among the top-500 up-regulated genes when these mutated cells are treated with palbociclib. (C) Reversion of AD-related genes. The upper plots show the tendency of AD genes (according to OpenTargets) to have extreme reversion scores. Reversion scores measure the ratio between ranks in the mutated-vs-WT signatures and flipped (reversed) ranks upon treatment of the mutated cells with the drug. Blue (left of the axis) denotes genes that were up-regulated in the mutated-vs-WT signature and down-regulated upon treatment, and red (right of the axis) denotes genes that were down-regulated in mutated cells and up-regulated upon treatment. The P-value is calculated with a weighted one-sided Kolmogorov-Smirnov test based on the absolute value of these reversion scores, i.e. it measures the ‘extremity’ of AD genes. In the bottom plots, we focus on AD genes that were up- (blue) and down- (red) regulated (t-score) in the mutated-vs-WT comparison (bold dots), and we show their expression in the treated-vs-WT comparison (empty dots). Three independent experiments (n=3) were performed in all the experiments shown.
Figure 5
Figure 5. Discovery of chemical analogues of biologics.
(A) Scheme of the methodology. We look for compounds whose gene expression signatures (D1) would mimic gene expression signatures corresponding to the shRNA knock-down of the target of interest. In addition, we do a networks-level (C3-5) signature matching of the target profiles with those of the compounds. Candidates for IL-2 receptor, IL-12 and EGF receptor are tested in different experimental setups. (B) CD3/CD28 pre-stimulated PBMC were left without treatment for 3 days, labelled with CFSE and then stimulated with IL-2 (0.5 ng/mL) in the presence of the indicated compounds. Three days after stimulation, proliferation was measured by flow cytometry as CFSE label decay and normalized compared to the cells stimulated in the absence of drug (ND). Mean ± SD of 3-5 independent experiments are shown, as illustrated by the dots in each barplot. (C) IL-2-induced STAT5 phosphorylation in PBMC quantified western blot for compound 22. One representative experiment is shown (n=3) (D) NK-92 cells were stimulated with IL-12 (50 ng/mL) in the presence of the indicated concentration of compound 24 (kaempferol). IFNG mRNA levels after 6 hours were quantified by RT-PCR. Mean ± SD of 3 independent experiments are shown. (E) Phosphorylation of STAT4 at tyrosine 693 was assessed by western blot 1 h after stimulation with IL-12. Total STAT4 and actin antibodies were used as controls. One representative experiment is shown (n=3). (F) A431 and H1650 cells were treated for 24 hours with the indicated concentrations of compound 25 (APE1 inhibitor III). We quantified EGFR protein by western blot. Actin was used as a loading control. Representative blots out of three independent experiments are shown.
Figure 6
Figure 6. Representation of the CCweb resource.
The left tab (home page) is an interactive panel of 2D projections, where the query molecule (e.g. imatinib, white dot) can be compared to the CC background (in gray) and to other molecules of interest such as approved drugs (APD, in black). The right tab (exploration page) displays molecules that are similar to the query one. Similarities are measured across the 25 CC spaces (A1-E5).

References

    1. Sterling T, Irwin JJ. ZINC 15 – Ligand Discovery for Everyone. Journal of Chemical Information and Modeling. 2015;55:2324–2337. doi: 10.1021/acs.jcim.5b00559. - DOI - PMC - PubMed
    1. Gaulton A, et al. The ChEMBL database in 2017. Nucleic Acids Res. 2017;45:D945–D954. doi: 10.1093/nar/gkw1074. - DOI - PMC - PubMed
    1. Wang Y, et al. PubChem BioAssay: 2017 update. Nucleic Acids Res. 2017;45:D955–D963. doi: 10.1093/nar/gkw1118. - DOI - PMC - PubMed
    1. Wishart DS. Chapter 3: Small Molecules and Disease. PLOS Computational Biology. 2012;8:e1002805. doi: 10.1371/journal.pcbi.1002805. - DOI - PMC - PubMed
    1. Duran-Frigola M, Rossell D, Aloy P. A chemo-centric view of human health and disease. Nature Communications. 2014;5:5676. doi: 10.1038/ncomms6676. - DOI - PMC - PubMed

Publication types

MeSH terms

Substances