

Habitat productivity is a poor predictor of body size in rodents
- PMID: 32440273
- PMCID: PMC7233619
- DOI: 10.1093/cz/zoz037
Habitat productivity is a poor predictor of body size in rodents
Abstract
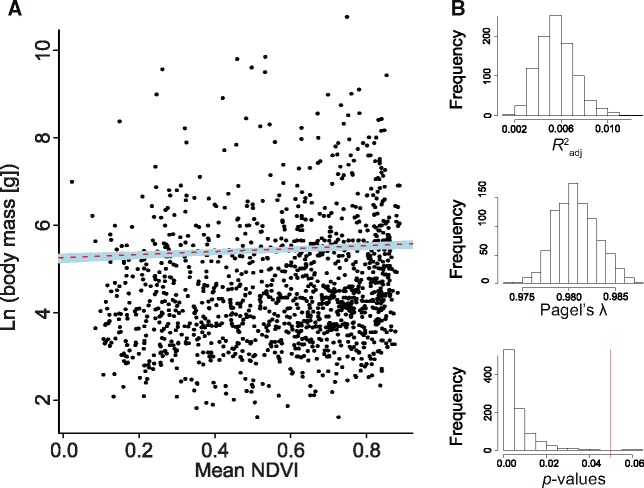
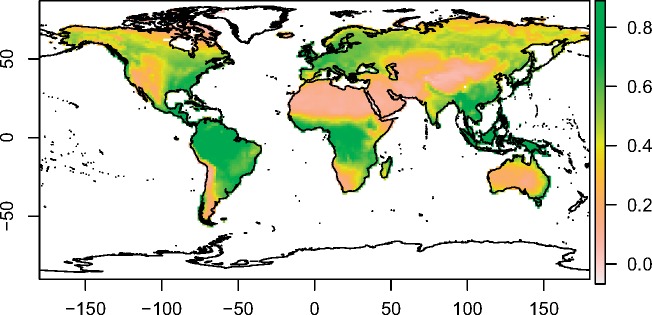
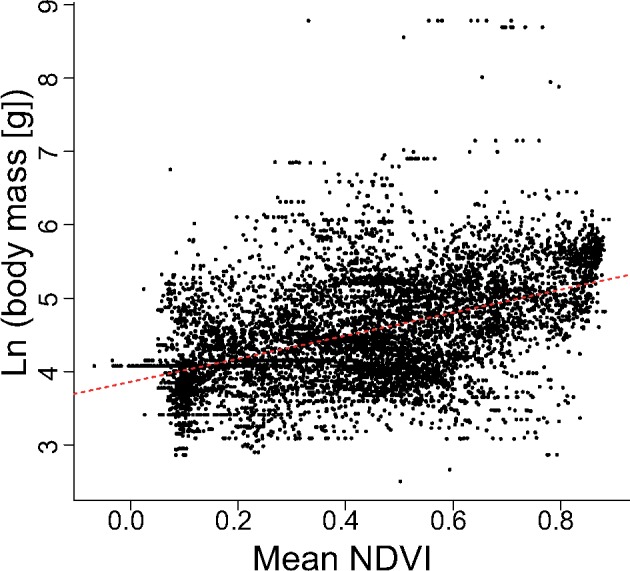
The "resource availability hypothesis" predicts occurrence of larger rodents in more productive habitats. This prediction was tested in a dataset of 1,301 rodent species. We used adult body mass as a measure of body size and normalized difference vegetation index (NDVI) as a measure of habitat productivity. We utilized a cross-species approach to investigate the association between these variables. This was done at both the order level (Rodentia) and at narrower taxonomic scales. We applied phylogenetic generalized least squares (PGLS) to correct for phylogenetic relationships. The relationship between body mas and NDVI was also investigated across rodent assemblages. We controlled for spatial autocorrelation using generalized least squares (GLS) analysis. The cross-species approach found extremely low support for the resource availability hypothesis. This was reflected by a weak positive association between body mass and NDVI at the order level. We find a positive association in only a minority of rodent subtaxa. The best fit GLS model detected no significant association between body mass and NDVI across assemblages. Thus, our results do not support the view that resource availability plays a major role in explaining geographic variation in rodent body size.
Keywords: Bergmann’s rule; body size (body mass); habitat productivity; heat conservation hypothesis; normalized difference vegetation index (NDVI); resource availability hypothesis.
© The Author(s) (2019). Published by Oxford University Press on behalf of Editorial Office, Current Zoology.
Figures

References
-
- Aitken AC, 1934. On least-squares and linear combinations of observations. Proc R Soc Edinb 55:42–48.
-
- Akaike H, 1974. A new look at the statistical model identification. IEEE Trans Automat Contr 19:716–723.
-
- Alhajeri BH, 2016. A phylogenetic test of the relationship between saltation and habitat openness in gerbils (Gerbillinae, Rodentia). Mammal Res 61:231–241.
-
- Alhajeri BH, 2018. Craniomandibular variation in the taxonomically problematic gerbil genus Gerbillus (Gerbillinae, Rodentia): assessing the influence of climate, geography, phylogeny, and size. J Mamm Evol 25:261–276.
-
- Alhajeri BH, Hunt OJ, Steppan SJ, 2015. Molecular systematics of gerbils and deomyines (Rodentia: Gerbillinae, Deomyinae) and a test of desert adaptation in the tympanic bulla. J Zool Syst Evol Res 53:312–330.
LinkOut - more resources
Full Text Sources
Miscellaneous