. 2020 Mar 20;7(10):1903657.
doi: 10.1002/advs.201903657. eCollection 2020 May.

Hepatocyte TMEM16A Deletion Retards NAFLD Progression by Ameliorating Hepatic Glucose Metabolic Disorder

Affiliations

Hepatocyte TMEM16A Deletion Retards NAFLD Progression by Ameliorating Hepatic Glucose Metabolic Disorder

Jia-Wei Guo et al. Adv Sci (Weinh). .

Abstract

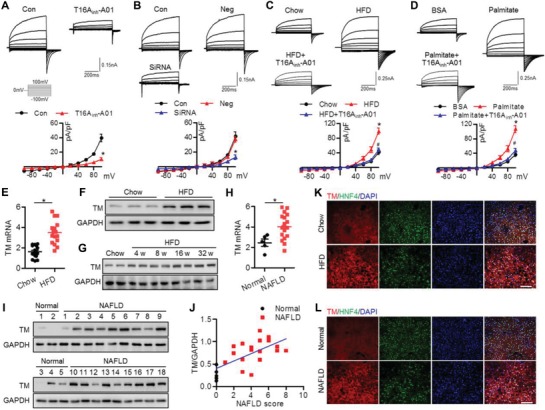
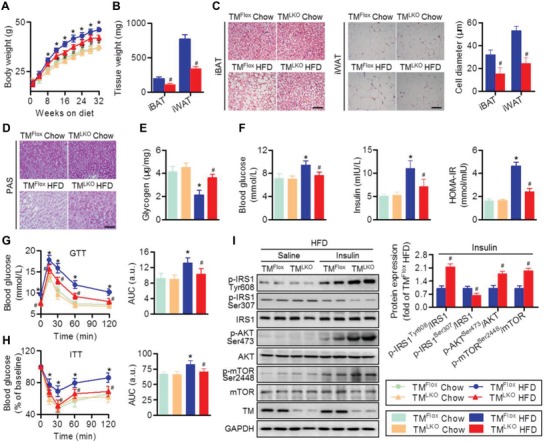
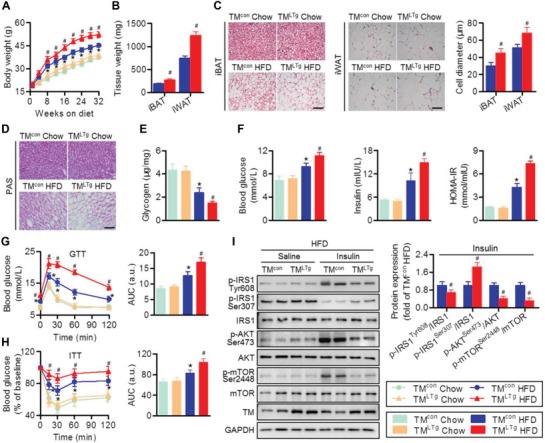
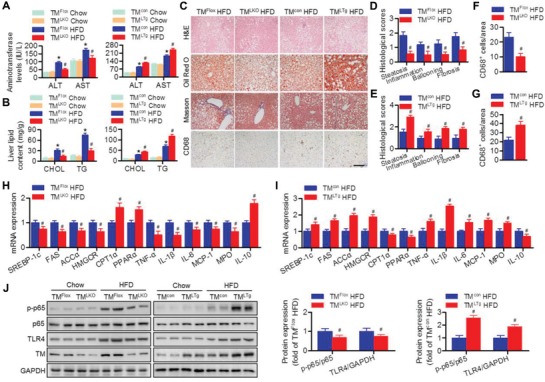
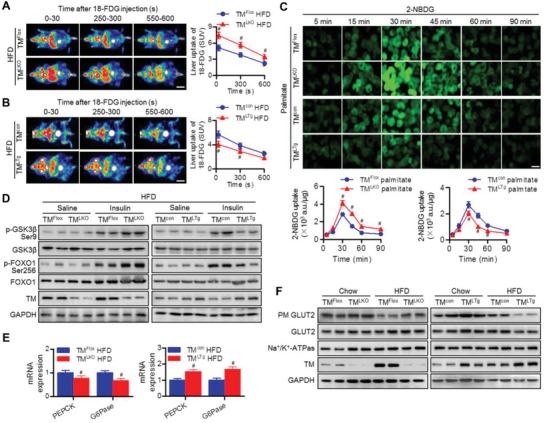
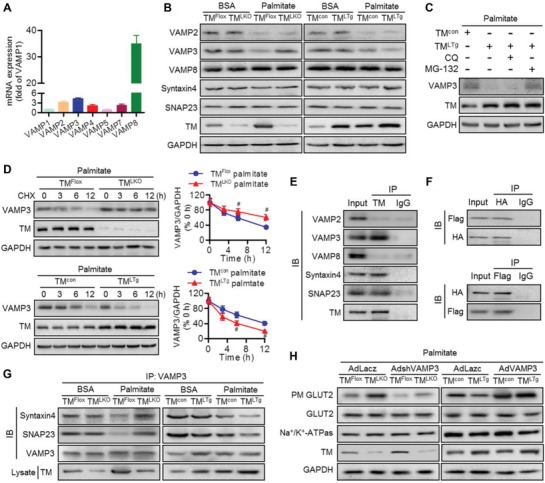
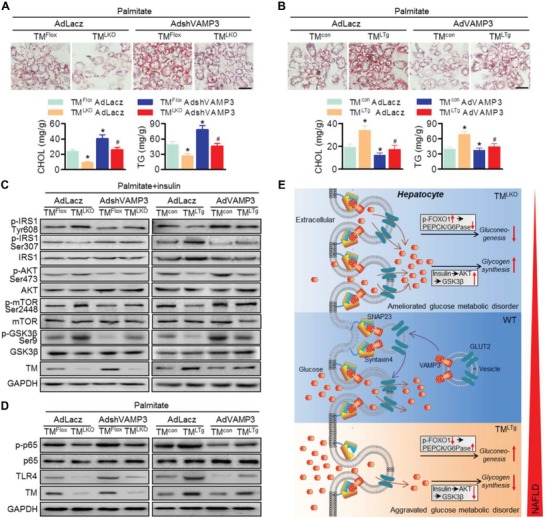
Nonalcoholic fatty liver disease (NAFLD) is the most prevalent form of chronic liver disease, and the mechanisms underpinning its pathogenesis have not been completely established. Transmembrane member 16A (TMEM16A), a component of the Ca2+-activated chloride channel (CaCC), has recently been implicated in metabolic events. Herein, TMEM16A is shown to be responsible for CaCC activation in hepatocytes and is increased in liver tissues of mice and patients with NAFLD. Hepatocyte-specific ablation of TMEM16A in mice ameliorates high-fat diet-induced obesity, hepatic glucose metabolic disorder, steatosis, insulin resistance, and inflammation. In contrast, hepatocyte-specific TMEM16A transgenic mice exhibit the opposite phenotype. Mechanistically, hepatocyte TMEM16A interacts with vesicle-associated membrane protein 3 (VAMP3) to induce its degradation, suppressing the formation of the VAMP3/syntaxin 4 and VAMP3/synaptosome-associated protein 23 complexes. This leads to the impairment of hepatic glucose transporter 2 (GLUT2) translocation and glucose uptake. Notably, VAMP3 overexpression restrains the functions of hepatocyte TMEM16A in blocking GLUT2 translocation and promoting lipid deposition, insulin resistance, and inflammation. In contrast, VAMP3 knockdown reverses the beneficial effects of TMEM16A downregulation. This study demonstrates a role for TMEM16A in NAFLD and suggests that inhibition of hepatic TMEM16A or disruption of TMEM16A/VAMP3 interaction may provide a new potential therapeutic strategy for NAFLD.

Keywords: GLUT2; TMEM16A; VAMP3; glucose metabolic disorder; hepatic steatosis; nonalcoholic fatty liver disease.


Conflict of interest statement

The authors declare no conflict of interest.

Figures

Figure 1
Figure 1
TMEM16A expression is increased in livers with hepatic steatosis. A,B) Representative traces of whole‐cell patch‐clamp recordings of I Cl.Ca in primary hepatocytes treated with T16Ainh‐A01 (10 µmol L−1) (A) or in hepatocytes transfected with negative siRNA (Neg) or TMEM16A siRNA (40 nmol L−1) (B) for 24 h. I Cl.Ca was recorded in the presence of 500 nmol L−1 [Ca2+]i. IV curves of I Cl.Ca are shown. *P < 0.05 versus 500 nmol L−1 [Ca2+]i (control), n = 6. C,D) I Cl.Ca evoked by 500 nmol L−1 [Ca2+]i was potentiated in hepatocytes isolated from mice after feeding HFD for 32 weeks (C) or stimulated with palmitate (200 µmol L−1) for 24 h in vitro (D), which was inhibited by T16Ainh‐A01. *P < 0.05 versus chow or BSA, #P < 0.05 versus HFD or palmitate, n = 6. E) TMEM16A (TM) mRNA level in liver tissues of mice fed with chow diet or HFD for 32 weeks. *P < 0.05 versus chow, n = 16 per group. F) Western blotting of TMEM16A in livers from mice after chow diet or HFD treatment for 32 weeks, n = 6 per group. G) Representative western blotting of TMEM16A expression in livers of mice after HFD for the indicated time periods, n = 6 per group. H,I) TMEM16A mRNA (H) and protein (I) levels in livers from normal individuals (n = 5) or NAFLD patients (n = 18). *P < 0.05 versus normal. J) Pearson correlation analysis of the relationship between TMEM16A protein expression and NAFLD score in human subjects (r = 0.6824, P = 0.0003). K,L) Immunofluorescence of TMEM16A and HNF4 in liver sections from chow diet‐ or HFD‐fed mice (K) and normal individuals or NAFLD patients (L). Nuclei were stained with DAPI. Scale bar, 100 µm. Representative images from four samples per group are shown.
Figure 2
Figure 2
TMEM16A deficiency in hepatocytes inhibits HFD‐induced obesity and insulin resistance. A) Liver‐specific TMEM16A deletion mice (TMLKO) and control mice (TMFlox) were fed with chow diet or HFD for 32 weeks and then body weight was measured. *P < 0.05 versus TMFlox chow, #P < 0.05 versus TMFlox HFD, n = 14–18 per group. B,C) Adipose tissue depots iBAT and iWAT were analyzed for weight (B) and adipocyte size (C). Scale bar, 50 µm. #P < 0.05 versus TMFlox HFD, n = 6 per group. D–F) Hepatic glycogen content (D,E), fasting blood glucose, fasting insulin, and HOMA‐IR index (F) were measured in TMFlox and TMLKO mice on the indicated diet for 32 weeks. Scale bar, 50 µm. *P < 0.05 versus TMFlox chow, #P < 0.05 versus TMFlox HFD, n = 10 per group. G,H) GTT (G) and ITT (H) were performed on TMFlox mice and TMLKO mice after 32 weeks on chow diet or HFD. *P < 0.05 versus TMFlox chow, #P < 0.05 versus TMFlox HFD, n = 12 per group. AUC, area under the curve. I) Levels of IRS1 (Tyr608, Ser307), AKT (Ser473), and mTOR (Ser2448) phosphorylation in response to an intraperitoneal injection of insulin (1.0 IU kg−1 for 15 min) in the liver tissues of TMFlox and TMLKO mice after HFD treatment. #P < 0.05 versus TMFlox insulin, n = 6 per group.
Figure 3
Figure 3
Hepatocyte TMEM16A aggravates HFD‐induced obesity and insulin resistance. A) Body weight of TMLTg and TMcon mice on the indicated diets for 32 weeks. *P < 0.05 versus TMcon chow, #P < 0.05 versus TMcon HFD, n = 15–20 per group. B) Weight of iBAT and iWAT of TMcon and TMLTg mice after HFD treatment. #P < 0.05 versus TMcon HFD, n = 8 per group. C) Representative images of H&E staining of iBAT and iWAT. Adipocyte diameter was calculated. Scale bar, 50 µm. #P < 0.05 versus TMcon HFD, n = 8 per group. D) PAS staining representative images of liver sections of TMcon and TMLTg mice on the indicated diets, n = 4 per group. Scale bar, 50 µm. E,F) Hepatic glycogen content (E), fasting blood glucose, fasting insulin, and HOMA‐IR index (F) in TMcon and TMLTg mice on the indicated diets for 32 weeks. *P < 0.05 versus TMcon chow, #P < 0.05 versus TMcon HFD, n = 12 per group. G,H) GTT (G) and ITT (H) were performed on TMcon and TMLTg mice after 32 weeks on the indicated diets. *P < 0.05 versus TMcon chow, #P < 0.05 versus TMcon HFD, n = 14 per group. I) Phosphorylation of IRS1 (Tyr608, Ser307), AKT (Ser473), and mTOR (Ser2448) in response to an intraperitoneal injection of saline or insulin (1.0 IU kg−1 for 15 min) in the liver tissues of TMcon and TMLTg mice after being fed with HFD. #P < 0.05 versus TMcon insulin, n = 6 per group.
Figure 4
Figure 4
Hepatocyte TMEM16A promotes HFD‐induced hepatic steatosis and inflammation. A,B) Plasma ALT and AST (A), and hepatic cholesterol (CHOL) and triglyceride (TG) (B) levels in TMLKO mice, TMLTg mice, and their control littermates on the indicated diets for 32 weeks. *P < 0.05 versus TMFlox chow or TMcon chow, #P < 0.05 versus TMFlox HFD or TMcon HFD, n = 8–12 per group. C–G) Representative H&E, Oil Red O, Masson's trichrome, and CD68 staining of liver sections of TMLKO mice, TMLTg mice, and their control littermates after 32 weeks of HFD (C). Quantification of histological scores (D,E) and CD68‐positive macrophages (F,G). Scale bar, 100 µm. #P < 0.05 versus TMFlox HFD or TMcon HFD, n = 6–8 per group. H–J) mRNA levels of genes associated with cholesterol synthesis, fatty acid synthesis, fatty acid oxidation, and inflammatory response (H,I) as well as p65 phosphorylation and TLR4 protein expression (J) levels in the livers of TMLKO mice, TMLTg mice, and their control littermates fed with the indicated diets for 32 weeks. #P < 0.05 versus TMFlox HFD or TMcon HFD, n = 6 per group.
Figure 5
Figure 5
TMEM16A exacerbates HFD‐induced inhibition of hepatic glucose uptake and GLUT2 translocation. A,B) Representative PET images (left panel) and quantification (right panel) of hepatic 18‐FDG uptake in TMLKO mice (A), TMLTg mice (B), and their control littermates after HFD for 32 weeks. SUV, standardized uptake value. Scale bar, 20 mm. #P < 0.05 versus TMFlox HFD or TMcon HFD, n = 5 per group. C) Hepatocytes isolated from TMLKO mice, TMLTg mice, and their control littermates were treated with palmitate for 24 h followed by incubation in culture medium without glucose for 6 h. Afterward, cells were treated with 2‐NBDG (50 µmol L−1) for the indicated duration. Representative images of 2‐NBDG fluorescence from four independent experiments. Scale bar, 20 µm. Quantitation of 2‐NBDG fluorescence intensity using a fluorescence microplate reader. #P < 0.05 versus TMFlox palmitate or TMcon palmitate, n = 6. D) Phosphorylation of GSK3β (Ser9) and FOXO1 (Ser256) in response to an intraperitoneal injection of saline or insulin (1.0 IU kg−1 for 15 min) in the liver tissues of TMLKO mice, TMLTg mice, and their control littermates after being fed with HFD, n = 6 per group. E) mRNA levels of PEPCK and G6Pase in the liver tissues of TMLKO mice, TMLTg mice, and their control littermates fed with HFD for 32 weeks. #P < 0.05 versus TMFlox HFD or TMcon HFD, n = 5. F) TMLKO mice, TMLTg mice, and their control littermates were fed with the indicated diets for 32 weeks. Thereafter, mice were fasted for 12 h and then refed for 4 h. Plasma membrane (PM) and total GLUT2 levels in liver tissues, n = 6 per group.
Figure 6
Figure 6
VAMP3 is required for TMEM16A‐mediated GLUT2 translocation. A) Abundance of VAMPs (VAMP1, VAMP2, VAMP3, VAMP4, VAMP5, VAMP7, and VAMP8) in hepatocytes, n = 4. B) Protein expression of VAMP2, VAMP3, VAMP8, syntaxin 4, and SNAP23 in hepatocytes from TMLKO mice, TMLTg mice, and their control littermates after BSA or palmitate treatment for 24 h, n = 6. C) VAMP3 expression in hepatocytes from TMcon mice pretreated with MG‐132 (10 µmol L−1) or chloroquine (CQ, 1 µmol L−1) for 30 min followed by palmitate treatment for 24 h, n = 7. D) Following palmitate treatment, VAMP3 expression was determined in the four groups of hepatocytes pretreated with cycloheximide (CHX, 100 µg mL−1) for the indicated durations. #P < 0.05 versus TMFlox palmitate or TMcon palmitate, n = 4. E) Immunoprecipitation (IP) followed by immunoblotting (IB) of hepatocyte lysates showing the presence of VAMP3, syntaxin 4, and SNAP23 in TMEM16A immunoprecipitates, n = 4. F) Hepatocytes were cotransfected with VAMP3‐Flag and TMEM16A‐RFP‐HA. Immunoblotting for Flag and HA after immunoprecipitation with HA (upper panel) or Flag (lower panel) antibodies, n = 4. G) Immunoblotting analysis of syntaxin 4 and SNAP23 in VAMP3 immunoprecipitates from hepatocytes treated as described, n = 6. H) Hepatocytes from TMLKO mice, TMLTg mice, and their control littermates were infected with AdVAMP3, AdshVAMP3, or control adenovirus (AdLacz) for 24 h followed by palmitate treatment. Thereafter, cells were incubated in glucose‐free medium for 6 h and then transferred to high glucose DMEM for 2 h. Distribution of GLUT2 in hepatocytes was analyzed by western blotting, n = 6.
Figure 7
Figure 7
Restoration of VAMP3 abrogates the deleterious effects of TMEM16A on hepatocyte function. A,B) Hepatocytes from TMLKO mice, TMLTg mice, and their control littermates were infected with AdVAMP3 (A), AdshVAMP3 (B), or AdLacz for 24 h prior to palmitate stimulation. Representative images of Oil Red O staining. Cholesterol content and triglyceride levels were measured in hepatocytes. Scale bar, 20 µm. *P < 0.05 versus TMFlox AdLacz or TMcon AdLacz, #P < 0.05 versus TMLKO AdLacz or TMLTg AdLacz, n = 5. C) Phosphorylation of IRS1 (Tyr608, Ser307), AKT (Ser473), and mTOR (Ser2448) in response to insulin (100 nmol L−1) stimulation for 30 min, n = 6. D) p65 phosphorylation and TLR4 protein expression, n = 6. E) Schematic representation of the study findings. TMEM16A binds to VAMP3 and induces VAMP3 degradation, inhibiting VAMP3/syntaxin 4 and VAMP3/SNAP23 complex formation in hepatocytes. As such, TMEM16A insufficiency promotes formation of these complexes and, consequently, GLUT2 translocation, leading to enhanced glucose uptake and glycogen synthesis as well as decreased insulin resistance and gluconeogenesis. This coordinately ameliorates glucose metabolic disorder and other NAFLD‐related events.

Similar articles

Cited by

References

    1. Cai Y., Li H., Liu M., Pei Y., Zheng J., Zhou J., Luo X., Huang W., Ma L., Yang Q., Guo S., Xiao X., Li Q., Zeng T., Meng F., Francis H., Glaser S., Chen L., Huo Y., Alpini G., Wu C., Hepatology 2018, 68, 48. - PMC - PubMed
    1. Zhao G. N., Zhang P., Gong J., Zhang X. J., Wang P. X., Yin M., Jiang Z., Shen L. J., Ji Y. X., Tong J., Wang Y., Wei Q. F., Wang Y., Zhu X. Y., Zhang X., Fang J., Xie Q., She Z. G., Wang Z., Huang Z., Li H., Nat. Med. 2017, 23, 742. - PubMed
    1. Fu D., Cui H., Zhang Y., Cell. Physiol. Biochem. 2018, 45, 2187. - PubMed
    1. Wang P. X., Zhang X. J., Luo P., Jiang X., Zhang P., Guo J., Zhao G. N., Zhu X., Zhang Y., Yang S., Li H., Nat. Commun. 2016, 7, 10592. - PMC - PubMed
    1. Shi H., Kokoeva M. V., Inouye K., Tzameli I., Yin H., Flier J. S., J. Clin. Invest. 2006, 116, 3015. - PMC - PubMed

LinkOut - more resources