. 2020 May 15;6(20):eaax0317.
doi: 10.1126/sciadv.aax0317. eCollection 2020 May.

Regulation and dynamics of force transmission at individual cell-matrix adhesion bonds

Affiliations

Regulation and dynamics of force transmission at individual cell-matrix adhesion bonds

Steven J Tan et al. Sci Adv. .

Abstract

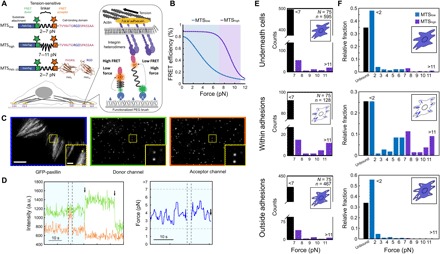
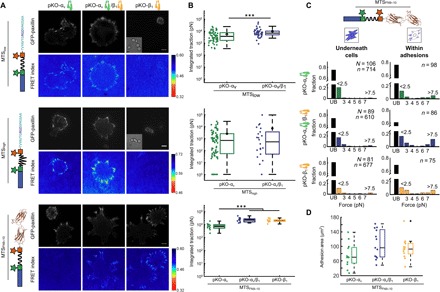
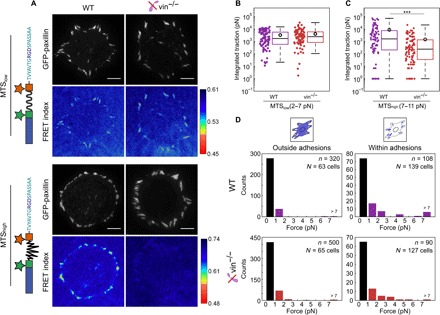
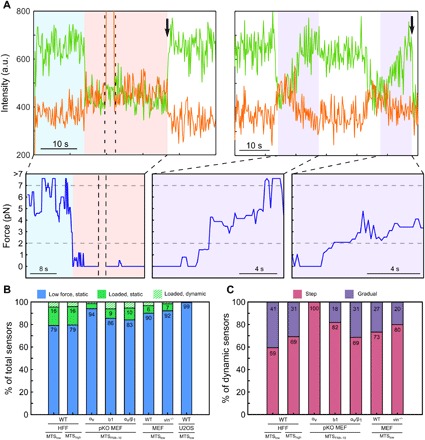
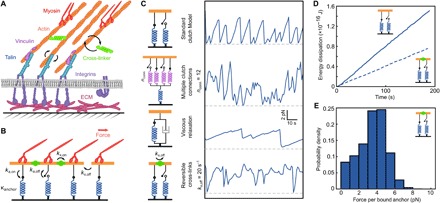
Integrin-based adhesion complexes link the cytoskeleton to the extracellular matrix (ECM) and are central to the construction of multicellular animal tissues. How biological function emerges from the tens to thousands of proteins present within a single adhesion complex remains unclear. We used fluorescent molecular tension sensors to visualize force transmission by individual integrins in living cells. These measurements revealed an underlying functional modularity in which integrin class controlled adhesion size and ECM ligand specificity, while the number and type of connections between integrins and F-actin determined the force per individual integrin. In addition, we found that most integrins existed in a state of near-mechanical equilibrium, a result not predicted by existing models of cytoskeletal force transduction. A revised model that includes reversible cross-links within the F-actin network can account for this result and suggests one means by which cellular mechanical homeostasis can arise at the molecular level.


Figures

Fig. 1
Fig. 1. Single-molecule tension measurements in living cells reveal distinct subpopulations of load-bearing integrins.
(A) FRET-based MTSs. MTSs are attached to the coverslip surface via the HaloTag domain. (B) FRET-force calibration curves for MTSlow (blue) and MTShigh (purple) (16, 51). (C) Representative images showing green fluorescent protein (eGFP) (left), FRET donor (middle), and acceptor channels (right) for HFFs adhering to a surface functionalized with MTSlow. Scale bar, 5 μm; inset scale bar, 2 μm. (D) Example intensity traces (left) for the FRET donor (green) and acceptor (orange). Vertical dashed lines delineate frames during which the acceptor dye was directly excited with 633-nm light; arrows mark acceptor or donor bleaching; horizontal gray dashed lines indicate upper and lower force measurement limits. Right: Corresponding load time series before acceptor photobleaching (light blue). Intensity, arbitrary units (a.u.). (E) Single-molecule load distributions for MTShigh underneath cells, within adhesions, and outside adhesions. N = number of cells, n = number of sensors. (F) Combined single-molecule load distributions for MTSlow and MTShigh sensors underneath cells, within adhesions, and outside adhesions for MTSlow [blue; data from (14)] and MTShigh (purple).
Fig. 2
Fig. 2. Integrin class does not determine the force per integrin but affects ligand specificity.
(A) Images of eGFP-paxillin and ensemble FRET maps for pKO-αv, pKO-αv1, and pKO-β1 cells adhering to MTSlow (top), MTShigh (middle), and MTSFN9–10 (bottom). Insets show corresponding bright-field images for pKO-β1 cells, which rarely spread on surfaces functionalized with MTSlow and MTShigh. Scale bars, 10 μm. (B) Ensemble quantification of pKO-αv, pKO-αv/β1, and pKO-β1 cells adhering to MTSlow, MTShigh, and MTSFN9–10. When adhering to MTSlow, pKO-αv1 cells exert more integrated traction compared to pKO-αv cells (pKO-αv: 67 cells, mean: 5.5 nN; pKO-αv1: 43 cells, mean: 9.8 nN) (***P = 3 × 10⁻⁴). When adhering to MTShigh, pKO-αv1 and pKO-αv cells produce comparable traction overall (pKO-αv: 77 cells, mean: 2.6 nN; pKO-αv1: 22 cells, mean: 7 nN). For MTSFN9–10, pKO-αv1 and pKO-β1 cells exert a higher integrated traction as compared to pKO-αv cells (pKO-αv: 13 cells, mean: 7.9 nN; pKO-αv1: 12 cells, mean: 26.9 nN; pKO-αv1: 12 cells, mean: 23.8 nN) (***P < 10 to 3). (C) Single-molecule load distributions for pKO cell lines adhering to MTSFN9–10. Black bars indicate unbound molecules. (D) Adhesion area measured for pKO-αv, pKO-αv1, and pKO-β1 cells adhering to MTSFN9–10. Areas were calculated from the thresholded eGFP-paxillin signal. Differences in adhesion area were not significant between the three cell types.
Fig. 3
Fig. 3. Vinculin is required for higher forces per integrin.
(A) Ensemble FRET maps for WT and vin−/− MEFs transfected with eGFP-paxillin and seeded on coverslips functionalized with MTSlow and MTShigh sensors. Scale bar, 10 μm. (B) Total integrated traction per cell for forces <7 pN measured with MTSlow. Open circles indicate the mean value. (WT: 96 cells, mean: 3.6 nN; vin−/−: 89 cells, mean: 4.4 nN.) (C) Total integrated traction per cell for forces between 7 and 11 pN measured with MTShigh. Open circles indicate the mean. (WT: 71 cells, mean: 8.7 nN; vin−/−: 99 cells, mean: 1.5 nN.) (D) Histograms of the single-molecule load measurements for WT and vin−/− MEFs measured for cells adhering to MTSlow for sensors outside adhesions (left) and within adhesions (right). ***P < 0.001 using two-sided Wilcoxon rank sum test.
Fig. 4
Fig. 4. Dynamic transitions in load constitute a minority of sensor measurements.
(A) Representative traces showing step (left) and gradual ramp (right) load transitions (FRET donor: green; FRET acceptor: orange; load: blue) for HFFs adhering MTSlow. Black arrows mark acceptor or donor bleaching; dashed black lines indicate direct excitation of the FRET acceptor. Horizontal gray dashed lines indicate upper and lower force measurement limits for MTSlow. (B) Percentage low force (defined as <2 for MTSlow or < 7 pN for MTShigh) (blue), higher force but static (green), and dynamic (hashed; subset of loaded integrins) sensors for a variety of cell types adhering to different MTSs. (C) Percent of dynamic sensors with step (magenta) and ramp (purple) transitions. U2OS cells had no observable dynamic events.
Fig. 5
Fig. 5. A modified model of cytoskeletal force transduction yields mechanical equilibrium at individual integrins.
(A) Simplified cartoon of a FA: Nonmuscle myosin II pulls on reversibly cross-linked actin filaments, which are linked to integrins by vinculin and talin. (B) Cytoskeletal dynamics model: F-actin filaments bind to anchors (blue) and are linked by cross-linking proteins (green). (C) An example force trace of the standard clutch model and possible clutch model extensions that account for multivalent clutch connections, viscous relaxation, or reversible cross-links. Reversible cross-links allow for stable force plateaus as well as sporadic ramp and step events. The dashed gray lines indicate zero force. (D) Calculated energy dissipation from simulations with irreversible (top) and reversible (bottom) cross-links. (E) Force distribution for simulated anchors with reversible cross-linking (kx,off = 20 s−1).

References

    1. Paszek M. J., Zahir N., Johnson K. R., Lakins J. N., Rozenberg G. I., Gefen A., Reinhart-King C. A., Margulies S. S., Dembo M., Boettiger D., Hammer D. A., Weaver V. M., Tensional homeostasis and the malignant phenotype. Cancer Cell 8, 241–254 (2005). - PubMed
    1. Mekhdjian A. H., Kai F., Rubashkin M. G., Prahl L. S., Przybyla L. M., McGregor A. L., Bell E. S., Barnes J. M., DuFort C. C., Ou G., Chang A. C., Cassereau L., Tan S. J., Pickup M. W., Lakins J. N., Ye X., Davidson M. W., Lammerding J., Odde D. J., Dunn A. R., Weaver V. M., Integrin-mediated traction force enhances paxillin molecular associations and adhesion dynamics that increase the invasiveness of tumor cells into a three-dimensional extracellular matrix. Mol. Biol. Cell 28, 1467–1488 (2017). - PMC - PubMed
    1. Bökel C., Brown N. H., Integrins in development: Moving on, responding to, and sticking to the extracellular matrix. Dev. Cell 3, 311–321 (2002). - PubMed
    1. Horton E. R., Byron A., Askari J. A., Ng D. H. J., Millon-Frémillon A., Robertson J., Koper E. J., Paul N. R., Warwood S., Knight D., Humphries J. D., Humphries M. J., Definition of a consensus integrin adhesome and its dynamics during adhesion complex assembly and disassembly. Nat. Cell Biol. 17, 1577–1587 (2015). - PMC - PubMed
    1. Zaidel-Bar R., Itzkovitz S., Ma’ayan A., Iyengar R., Geiger B., Functional atlas of the integrin adhesome. Nat. Cell Biol. 9, 858–867 (2007). - PMC - PubMed

Publication types

LinkOut - more resources