. 2020 May 15;6(20):eaay1057.
doi: 10.1126/sciadv.aay1057. eCollection 2020 May.

Inhibition of IRF5 cellular activity with cell-penetrating peptides that target homodimerization

Affiliations

Inhibition of IRF5 cellular activity with cell-penetrating peptides that target homodimerization

Jaspreet Banga et al. Sci Adv. .

Abstract

The transcription factor interferon regulatory factor 5 (IRF5) plays essential roles in pathogen-induced immunity downstream of Toll-, nucleotide-binding oligomerization domain-, and retinoic acid-inducible gene I-like receptors and is an autoimmune susceptibility gene. Normally, inactive in the cytoplasm, upon stimulation, IRF5 undergoes posttranslational modification(s), homodimerization, and nuclear translocation, where dimers mediate proinflammatory gene transcription. Here, we report the rational design of cell-penetrating peptides (CPPs) that disrupt IRF5 homodimerization. Biochemical and imaging analysis shows that IRF5-CPPs are cell permeable, noncytotoxic, and directly bind to endogenous IRF5. IRF5-CPPs were selective and afforded cell type- and species-specific inhibition. In plasmacytoid dendritic cells, inhibition of IRF5-mediated interferon-α production corresponded to a dose-dependent reduction in nuclear phosphorylated IRF5 [p(Ser462)IRF5], with no effect on pIRF5 levels. These data support that IRF5-CPPs function downstream of phosphorylation. Together, data support the utility of IRF5-CPPs as novel tools to probe IRF5 activation and function in disease.


Figures

Fig. 1
Fig. 1. Binding of IRF5-CPPs to IRF5.
(A) The crystal structure of dimeric IRF5 highlights the importance of interactions between Helix 2 and Helix 5 of different monomers for dimerization. One monomer is shown in blue, and the other is shown in brown. (B) Polarity and hydrophobicity plot of CPPs. Two CPP templates, mPrP (–28) and YLK, were selected for testing with IRF5 sequences. Green- and yellow-shaded regions denote good to moderate cell penetration, respectively, while pink denotes no penetration. (C) Individual curves generated from time-resolved fluorescence resonance energy transfer (TR-FRET) using fluorescein isothiocyanate (FITC)–labeled IRF5-CPPs, the YLK CPP control FITC-CPP7 and His-tagged IRF5. All six IRF5-CPP peptides bound to IRF5 (222 to 425) with submicromolar potencies, while the negative YLK CPP control did not. (D) Representative Native gel electrophoresis showing effect of IRF5-CPP2 and IRF5-CPP5 on R848-induced IRF5 homodimerization in THP-1 cells. Stimulation with 1 μM R848 for 1 hour induced intracellular IRF5 homodimerization (lane 2). Preincubation with IRF5-CPP5 provided a dose-dependent reduction in R848-induced IRF5 homodimerization. (E) Same as (D) except scrambled negative control IRF5-CPP8 and IRF5-CPP9 were examined by cellular IRF5 homodimerization assay. (F) Quantification of IRF5 homodimerization from (D) and (E) is shown after normalization to β-actin. One-way analysis of variance (ANOVA) with Bonferroni’s multiple comparison test was performed. ***P < 0.001, ****P < 0.0001. (G) THP-1 cells were preincubated with FITC-CPP2, FITC-CPP5, FITC-CPP8, or FITC-CPP9 for 1 hour, followed by permeabilization and staining for intracellular IRF5 with tetramethyl rhodamine isothiocyanate (TRITC)–conjugated antibodies. FRET units were calculated from fluorescence emissions (see Materials and Methods). (H) Representative cellular images of in-cell FRET from 10,000 acquired events by imaging flow cytometry is shown. (I) Percentage of THP-1 cells from (H) showing FRET signal by FITC-TRITC similarity score. Data in (D) to (I) are representative of three independent experiments performed in triplicate with SD shown in (F), (G), and (I).
Fig. 2
Fig. 2. IRF5-CPPs are cell penetrant and colocalize with endogenous IRF5.
(A) Representative dot plots from imaging flow cytometry of gated CD19+ B cells from PBMCs showing differential internalization and colocalization of FITC-IRF5-CPP5 with endogenous IRF5. FITC-CPP5 (1 μM) was incubated with PBMCs for 30 or 60 min. Quadrant A (bottom left) shows CD19+ B cells that have not internalized FITC-IRF5-CPP5, and FITC-IRF5-CPP5 is not localized with IRF5. Quadrant B shows CD19+ B cells that have internalized FITC-IRF5-CPP5, but FITC-IRF5-CPP5 is not colocalized with IRF5. Quadrant C shows CD19+ B cells that have both internalized and colocalized FITC-IRF5-CPP5 with IRF5. (B) Representative cellular images from each quadrant in (A). DAPI, 4′,6-diamidino-2-phenylindole; BF, brightfield; PETR, Texas red. (C) Summarized data of 1 μM FITC-IRF5-CPP2 and FITC-IRF5-CPP5 internalization and IRF5 colocalization from gated CD19+ B cells. (D and E) Representative images are shown for CD14+ monocytes (D) along with summarized data (E). (F and G) Representative images and summarized data for BDCA2+CD123+ pDCs are shown. Data are from three independent healthy donors; reported errors indicate SD. One-way ANOVA with Bonferroni’s multiple comparison test was performed.
Fig. 3
Fig. 3. IRF5-CPPs inhibit IL12 production from human PBMCs and IRF5 nuclear translocation in a concentration-dependent manner.
(A) Human PBMCs were pretreated for 30 min with various concentrations of IRF5-CPPs and stimulated overnight with 1 μM R848. IL12p40 levels in supernatant were measured by enzyme-linked immunosorbent assay (ELISA) and normalized to values from wells stimulated with 1 μM R848 and peptide vehicle [0.05% dimethyl sulfoxide (DMSO) and 5% water]. Summarized data are from n = 4 healthy donors performed in triplicate; reported errors indicate SEM. Percentage of CD14+ monocytes (B) and CD19+ B cells (C) with nuclear-localized IRF5. PBMCs were preincubated with the indicated concentrations of IRF5-CPP2 or IRF5-CPP5, stimulated with 1 μM R848 for 2 hours, stained for IRF5 and nuclear DRAQ5 (deep red anthraquinone 5), and then subjected to imaging flow cytometry. Nuclear translocation was defined as cells with a similarity score of IRF5 and DRAQ5 of ≥1.5. Data are from n = 4 independent donors; reported errors indicate SD. (D) Representative images of CD19+ B cells and CD14+ monocytes from (B) and (C). One-way ANOVA with Bonferroni’s multiple comparison test was performed.
Fig. 4
Fig. 4. Species-specific inhibition of macrophage-mediated cytokine expression by IRF5-CPP2 and IRF5-CPP5.
(A to F) Human MDMs were pretreated for 1 hour with various concentrations of IRF5-CPP2 and IRF5-CPP5 and stimulated with LPS for 4 hours to assess transcript expression by quantitative polymerase chain reaction (qPCR) and 24 hours to assess cytokine production by ELISA. Summarized data are from n = 6 to 7 healthy donors performed in triplicate; reported errors indicate SEM. (G to I) BMDMs from Irf5−/− and littermate-matched WT mice were pretreated with IRF5-CPP2 and stimulated with LPS for 24 hours for analysis of cytokine production in cell supernatants. KO, knockout. Data shown are from n = 3 mice per genotype and performed in triplicate. Statistical analysis performed between LPS- or R848-stimulated, nontreated, and IRF5-CPP–treated cells. One-way ANOVA with Bonferroni’s multiple comparison test was performed. *P ≤ 0.05, **P ≤ 0.005, ***P ≤ 0.0005, and ****P < 0.0001.
Fig. 5
Fig. 5. IRF5-CPPs attenuate IgG production from human B cells and type I IFN production from human pDCs through inhibition of IRF5 nuclear translocation.
(A) Freshly isolated B cells were pretreated for 30 min with various concentrations of IRF5-CPPs and stimulated for 7 days with 100 nM CpGB. IgG levels in supernatant were measured by AlphaLISA and normalized to values obtained from wells stimulated with 100 nM CpGB and peptide vehicle. Graphs represent data from n = 3 healthy donors measured in triplicate; error bars indicate SEM. ns, not significant. (B) PBMCs were pretreated with IRF5-CPP2 or IRF5-CPP5 and stimulated with CpGB for 2 hours. The percentage of CD19+ B cells with nuclear-localized IRF5 is shown with SD. (C) Same as (A) except freshly isolated pDCs were pretreated with IRF5-CPPs and stimulated ON (overnight) with 1 μM CpGA. IFNα levels in supernatant were measured and normalized to values obtained from wells stimulated with 1 μM CpGA and peptide vehicle. Graphs represent data from n = 3 healthy donors measured in duplicate; error bars indicate SD. (D) Same as (B) except percentage of BDCA2+CD123+ pDCs with nuclear-localized IRF5 is shown after 4-hour stimulation with CpGA. One-way ANOVA with Bonferroni’s multiple comparison test was performed.
Fig. 6
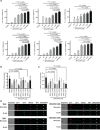
Fig. 6. IRF5-CPPs inhibit SLE serum–induced nuclear translocation of pIRF5 and TLR-mediated proinflammatory cytokine expression from SLE PBMCs.
(A) Representative kinetic analysis of pIRF5 from imaging flow cytometry analysis. PBMCs were stimulated with CpGA over a time course and percentage of BDCA2+CD123+ pDCs with nuclear-localized pIRF5 plotted. Data are representative of three independent donors. (B) Similar to (A) except the effect of IRF5-CPP2 on CpGA-induced pIRF5 expression, measured as mean fluorescence intensity (MFI), is shown at 2 hours after stimulation. Data are from n = 3 independent healthy donors with SD. (C) Same as (B) except pIRF5 nuclear translocation is shown. (D) PBMCs were pretreated with IRF5-CPP2 or IRF5-CPP5 and stimulated with SLE serum for 2 hours. The percentage of CD14+ monocytes (D) and CD19+ B cells (E) with nuclear-localized IRF5 is shown. Data are from n = 3 independent healthy donors with SD. (F) Same as (A) except PBMCs were stimulated with SLE serum. Data are representative of three independent donors. (G) Similar to (B) except pIRF5 mean fluorescence intensity was measured in the presence or absence of IRF5-CPP2 and IRF5-CPP5 after 1-hour stimulation with SLE serum. Data are from n = 3 independent healthy donors with SD. (H) Same as (G) except nuclear-localized pIRF5 is shown. (I to K) SLE PBMCs were pretreated with IRF5-CPP2 or IRF5-CPP5 at various concentrations or 1 μM hydroxychloroquine (HCQ) and stimulated with 0.5 μM CpGA or 1 μM R848. IFNα (I), IL6 (J), and TNFα (K) levels in supernatant were measured and normalized to values obtained from wells stimulated with TLR ligand and peptide vehicle. Summarized data are from n = 3 SLE donors performed in triplicate; reported errors indicate SEM. One-way ANOVA with Bonferroni’s multiple comparison test was performed.

References

    1. Barnes B. J., Moore P. A., Pitha P. M., Virus-specific activation of a novel interferon regulatory factor, IRF-5, results in the induction of distinct interferon α genes. J. Biol. Chem. 276, 23382–23390 (2001). - PubMed
    1. Barnes B. J., Richards M. J., Mancl M., Hanash S., Beretta L., Pitha P. M., Global and distinct targets of IRF-5 and IRF-7 during innate response to viral infection. J. Biol. Chem. 279, 45194–45207 (2004). - PubMed
    1. Barnes B. J., Kellum M. J., Field A. E., Pitha P. M., Multiple regulatory domains of IRF-5 control activation, cellular localization and induction of chemokines that mediate T-lymphocyte recruitment. Mol. Cell. Biol. 22, 5721–5740 (2002). - PMC - PubMed
    1. Barnes B. J., Kellum M. J., Pinder K. E., Frisancho J. A., Pitha P. M., IRF-5, a novel mediator of cell-cycle arrest and cell death. Cancer Res. 63, 6424–6431 (2003). - PubMed
    1. Takaoka A., Yanai H., Kondo S., Duncan G., Negishi H., Mizutani T., Kano S., Honda K., Ohba Y., Mak T. W., Taniguchi T., Integral role of IRF-5 in the gene induction programme activated by Toll-like receptors. Nature 434, 243–249 (2005). - PubMed

Publication types

MeSH terms

Substances