. 2020 May 15;6(20):eaaz5093.
doi: 10.1126/sciadv.aaz5093. eCollection 2020 May.

From force-responsive molecules to quantifying and mapping stresses in soft materials

Affiliations

From force-responsive molecules to quantifying and mapping stresses in soft materials

Yinjun Chen et al. Sci Adv. .

Abstract

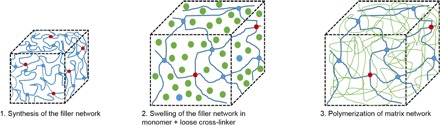
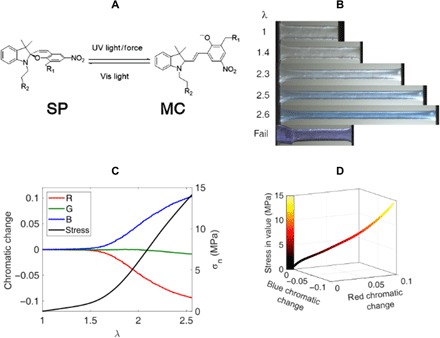
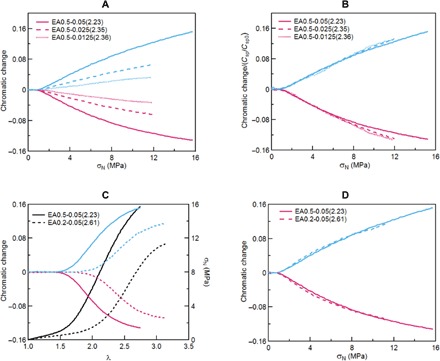
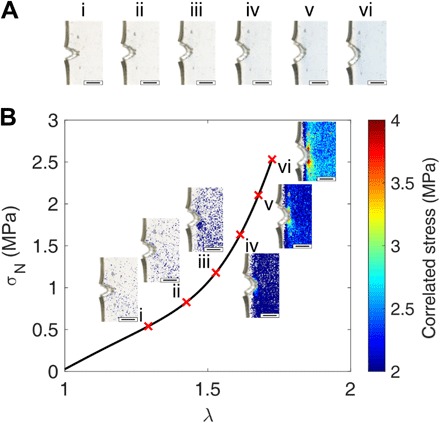
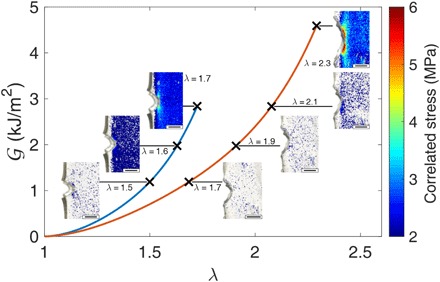
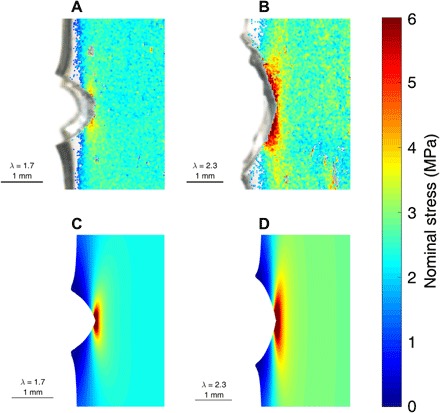
Directly quantifying a spatially varying stress in soft materials is currently a great challenge. We propose a method to do that by detecting a change in visible light absorption. We incorporate a spiropyran (SP) force-activated mechanophore cross-linker in multiple-network elastomers. The random nature of the network structure of the polymer causes a progressive activation of the SP force probe with load, detectable by the change in color of the material. We first calibrate precisely the chromatic change in uniaxial tension. We then demonstrate that the nominal stress around a loaded crack can be detected for each pixel and that the measured values match quantitatively finite element simulations. This direct method to quantify stresses in soft materials with an internal force probe is an innovative tool that holds great potential to compare quantitatively stresses in different materials with simple optical observations.


Figures

Fig. 1
Fig. 1. Synthesis of multiple-network elastomers containing SP mechanophores.
Red, blue, and green dots represent the SP cross-linker, BDA cross-linker, and the EA monomers, respectively. The blue and green networks denote the filler and matrix networks, respectively.
Fig. 2
Fig. 2. Quantification of color change.
(A) Scheme of the SP and MC molecules. Vis, visible. (B) Images taken at different values of stretch. Photo credits: Yinjun Chen and C. Joshua Yeh (ESPCI Paris). (C) Chromatic change as a function of stretch for the images extracted from the video of uniaxial extension. (D) Calibration curve for the stress as a function of the blue and red chromatic change. All tests were carried out for the EA0.5-0.05(2.23) materials.
Fig. 3
Fig. 3. Stress and stretch detection in uniaxial tension.
(A) Red and blue chromatic change plots as a function of nominal stress for the multiple-network elastomers with various SP concentrations. (B) Same data with the chromatic change renormalized by the SP concentration. (C) Stress-strain curves (black lines) and red and blue chromatic change as a function of stretch. (D) Red and blue chromatic change as a function of nominal stress for multiple-network elastomers with different cross-link densities in the filler network.
Fig. 4
Fig. 4. Stress map around the crack tip.
(A) Color-corrected images of a EA0.5-0.05(2.23) sample around the crack tip during a fracture test. i to vi correspond to different values of λ defined in (B). (B) Stress-strain curve of the same sample. Stress maps i to vi correspond to images in (A) with position-dependent stress values obtained with the RGB analysis. Scale bars, 1 mm. Photo credits: Yinjun Chen and C. Joshua Yeh (ESPCI Paris).
Fig. 5
Fig. 5. Stress maps at the same energy release rate.
Stress mapping around a crack tip for two different materials: EA0.5-0.05(2.23) in blue and EA0.2-0.05(2.61) in red. Crosses correspond to different values of the supplied elastic energy at the crack tip (energy release rate) G = 1.18, 2.48, 3.57, and 5.1 kJ/m2. Photo credits: Yinjun Chen and C. Joshua Yeh (ESPCI Paris).
Fig. 6
Fig. 6. Comparison of experimental and simulated stress maps.
The experimentally obtained stress map of (A) the EA0.5-0.05(2.23) and (B) the EA0.2-0.05(2.61) fracture samples. The simulated stress map of (C) the EA0.5-0.05(2.23) and (D) the EA0.2–0.05(2.61) fracture samples.

References

    1. Hur S. S., Zhao Y., Li Y. S., Botvinick E., Chien S., Live cells exert 3-dimensional traction forces on their substrata. Cell. Mol. Bioeng. 2, 425–436 (2009). - PMC - PubMed
    1. Hall M. S., Long R., Hui C. Y., Wu M., Mapping three-dimensional stress and strain fields within a soft hydrogel using a fluorescence microscope. Biophys. J. 102, 2241–2250 (2012). - PMC - PubMed
    1. Legant W. R., Miller J. S., Blakely B. L., Cohen D. M., Genin G. M., Chen C. S., Measurement of mechanical tractions exerted by cells in three-dimensional matrices. Nat. Methods 7, 969–971 (2010). - PMC - PubMed
    1. Maskarinec S. A., Franck C., Tirrell D. A., Ravichandran G., Quantifying cellular traction forces in three dimensions. Proc. Natl. Acad. Sci. U.S.A. 106, 22108–22113 (2009). - PMC - PubMed
    1. R. Göstl, J. M. Clough, R. P. Sijbesma, Optical sensing of stress in polymers, in Mechanochemistry in Materials, S. L. Craig, Y. C. Simon, Eds. (Royal Society of Chemistry, 2017), chap. 3, 53–70 pp.

LinkOut - more resources