. 2020 May;2(5):397-412.
doi: 10.1038/s42255-020-0205-x. Epub 2020 May 21.

Human thermogenic adipocyte regulation by the long noncoding RNA LINC00473

Affiliations

Human thermogenic adipocyte regulation by the long noncoding RNA LINC00473

Khanh-Van Tran et al. Nat Metab. 2020 May.

Abstract

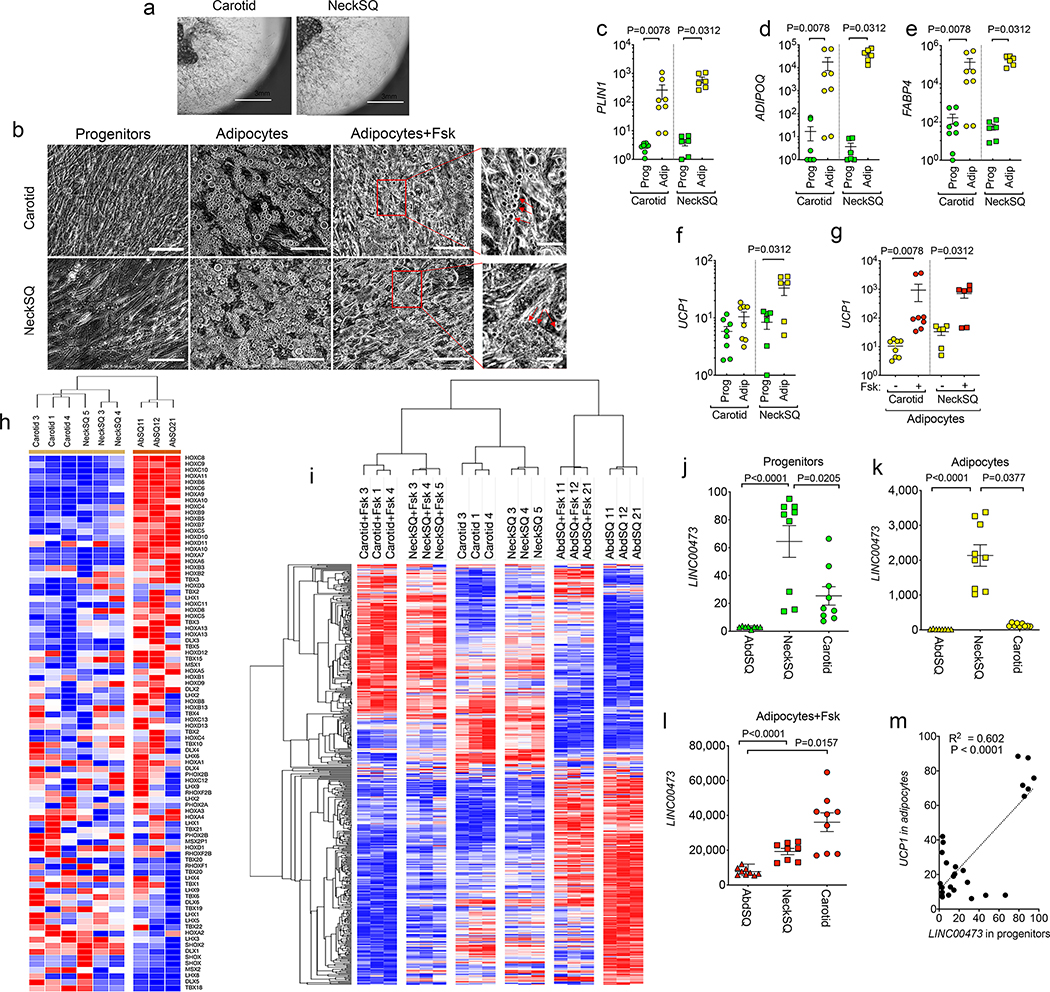
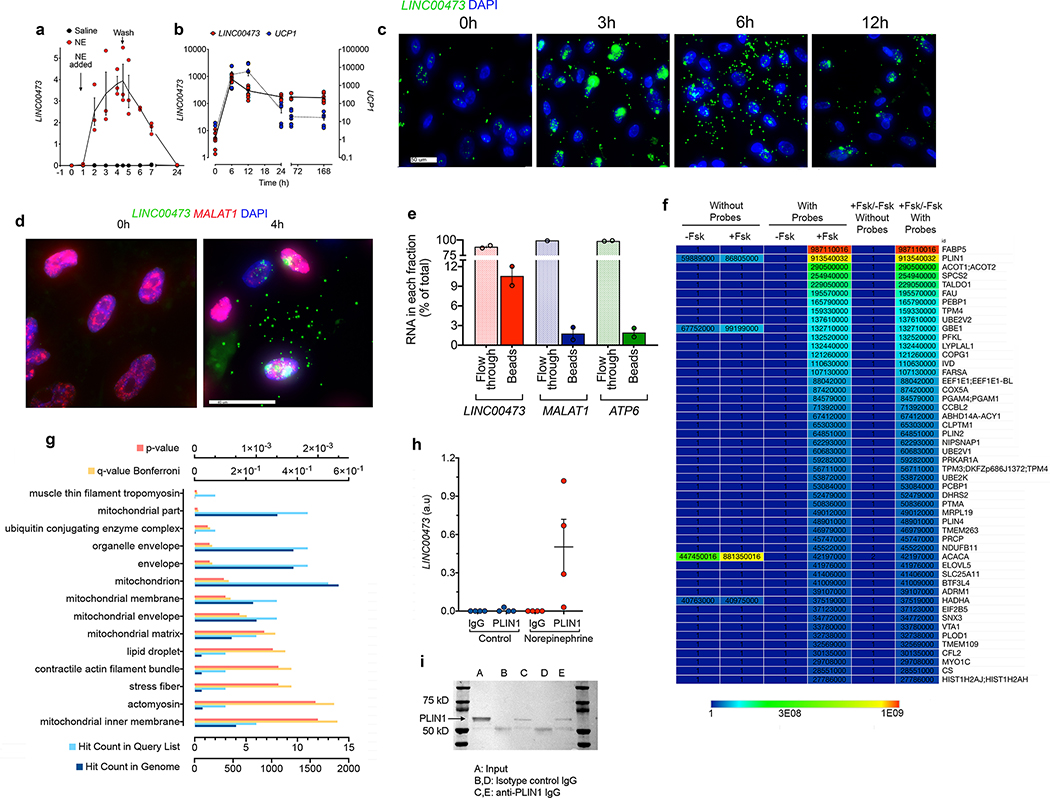
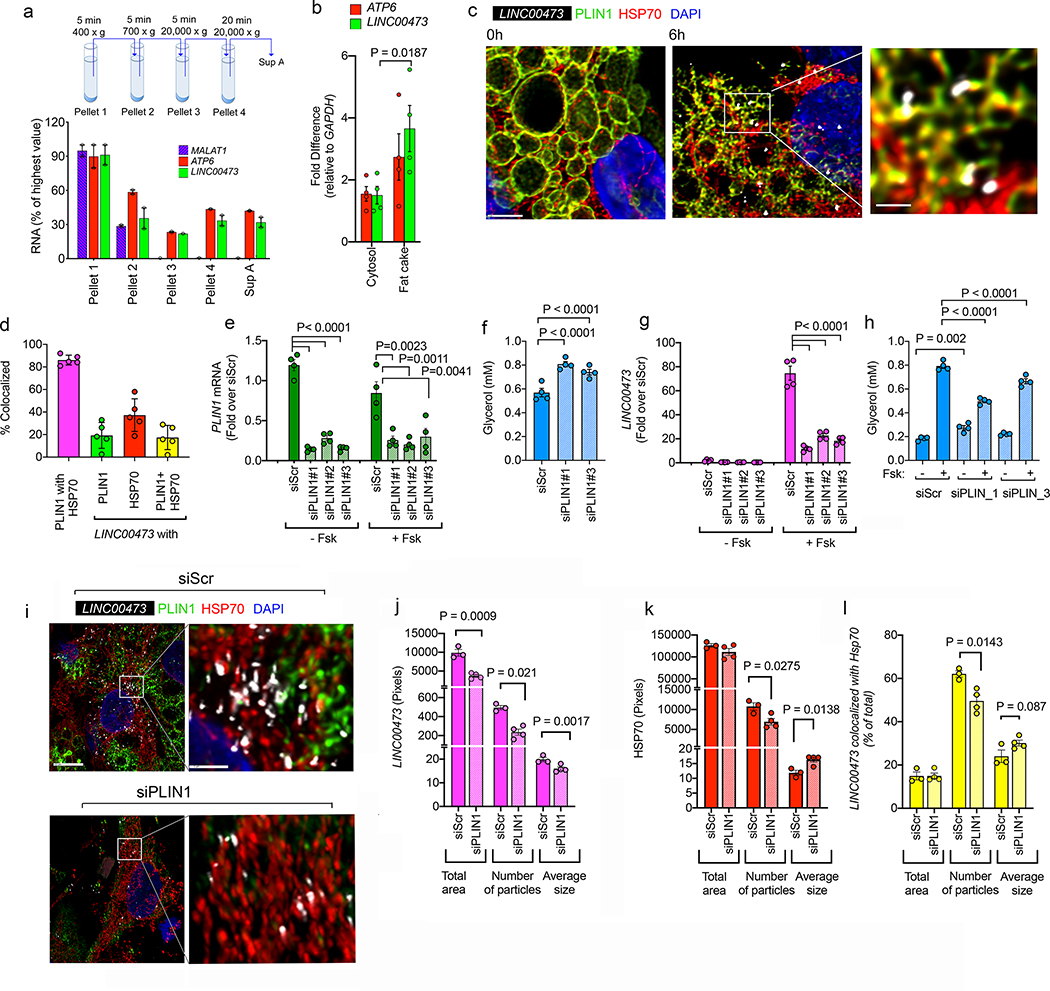
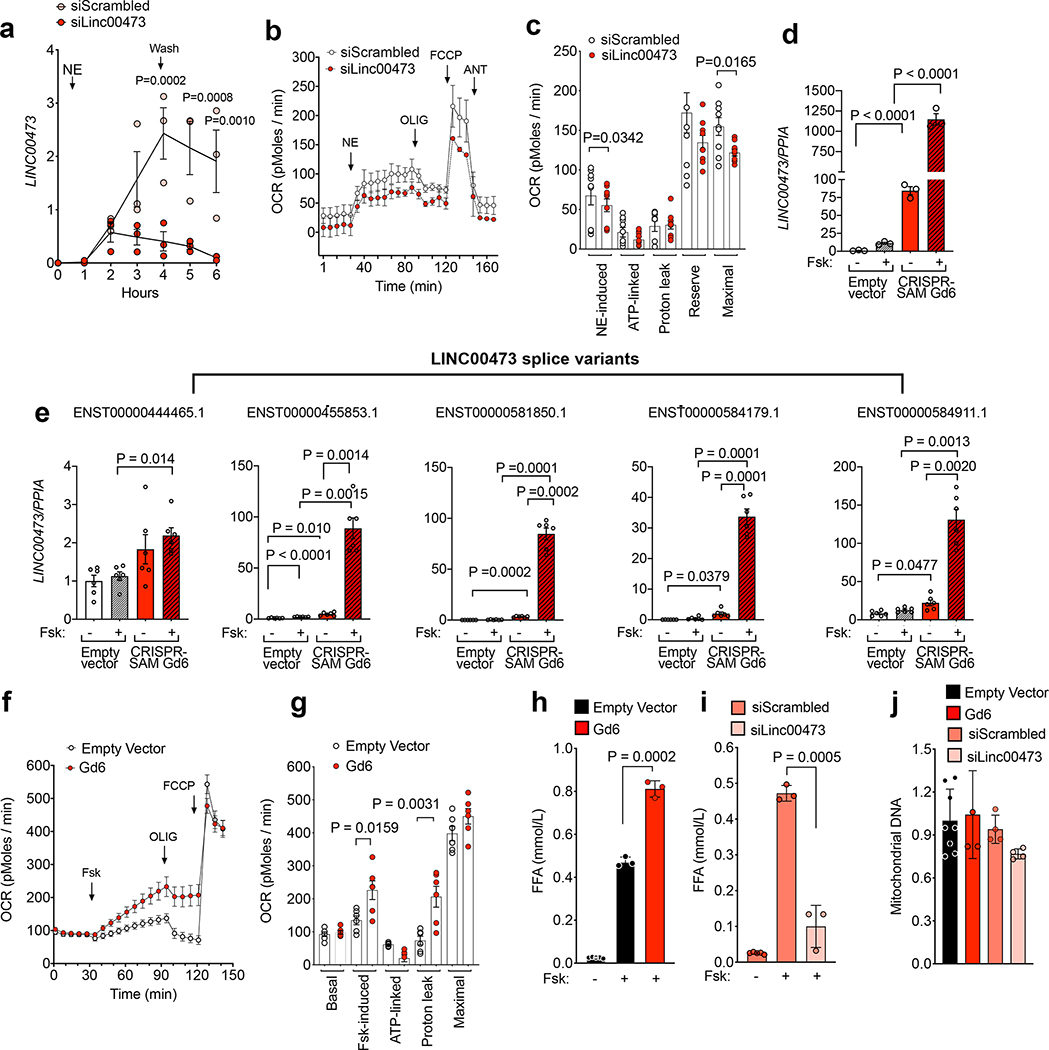
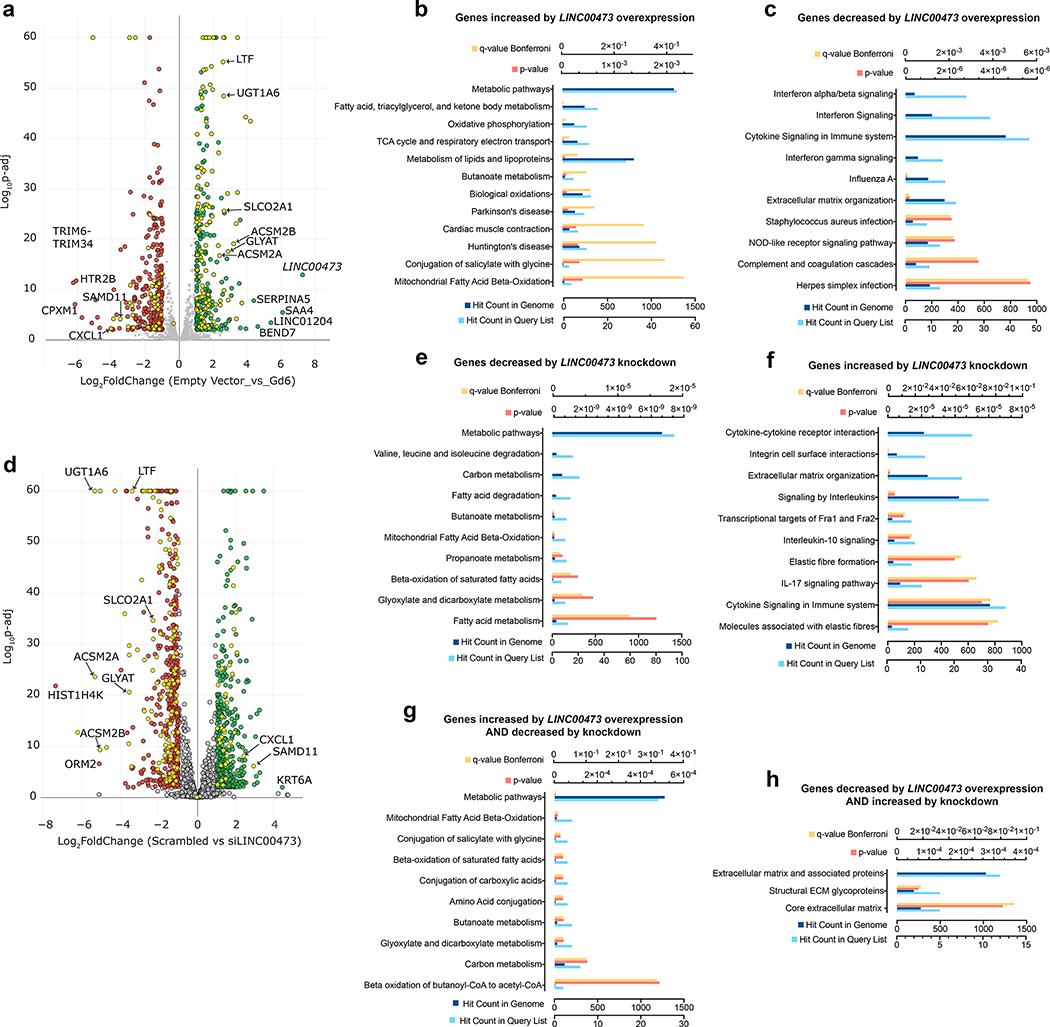
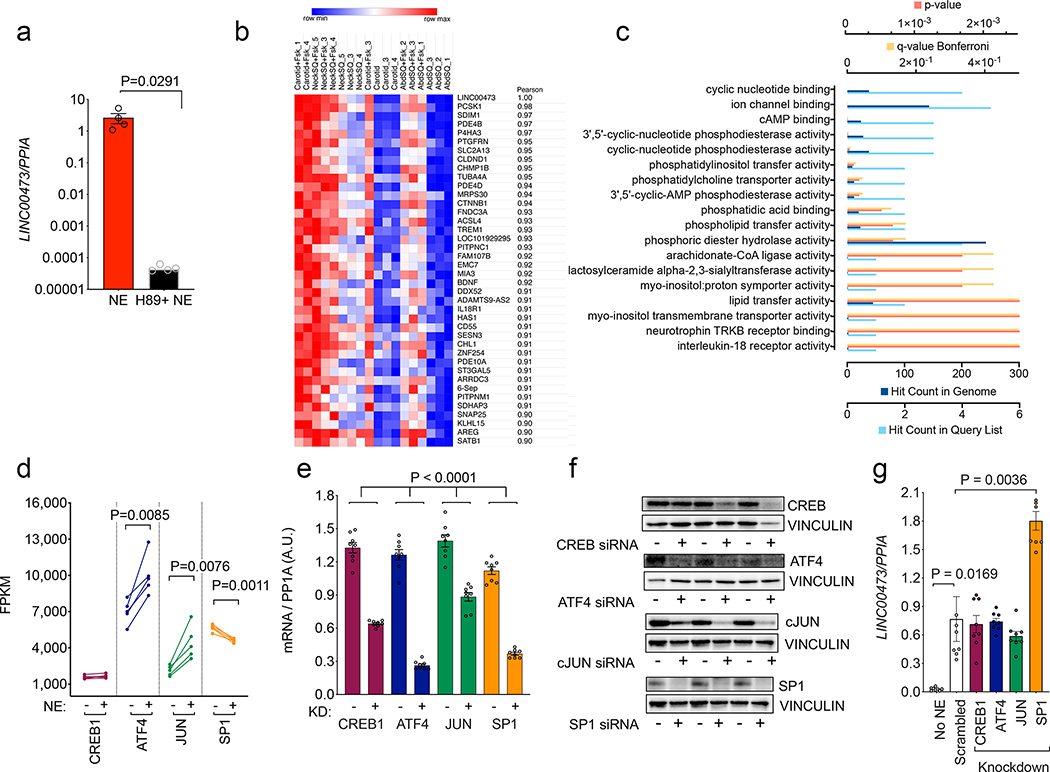
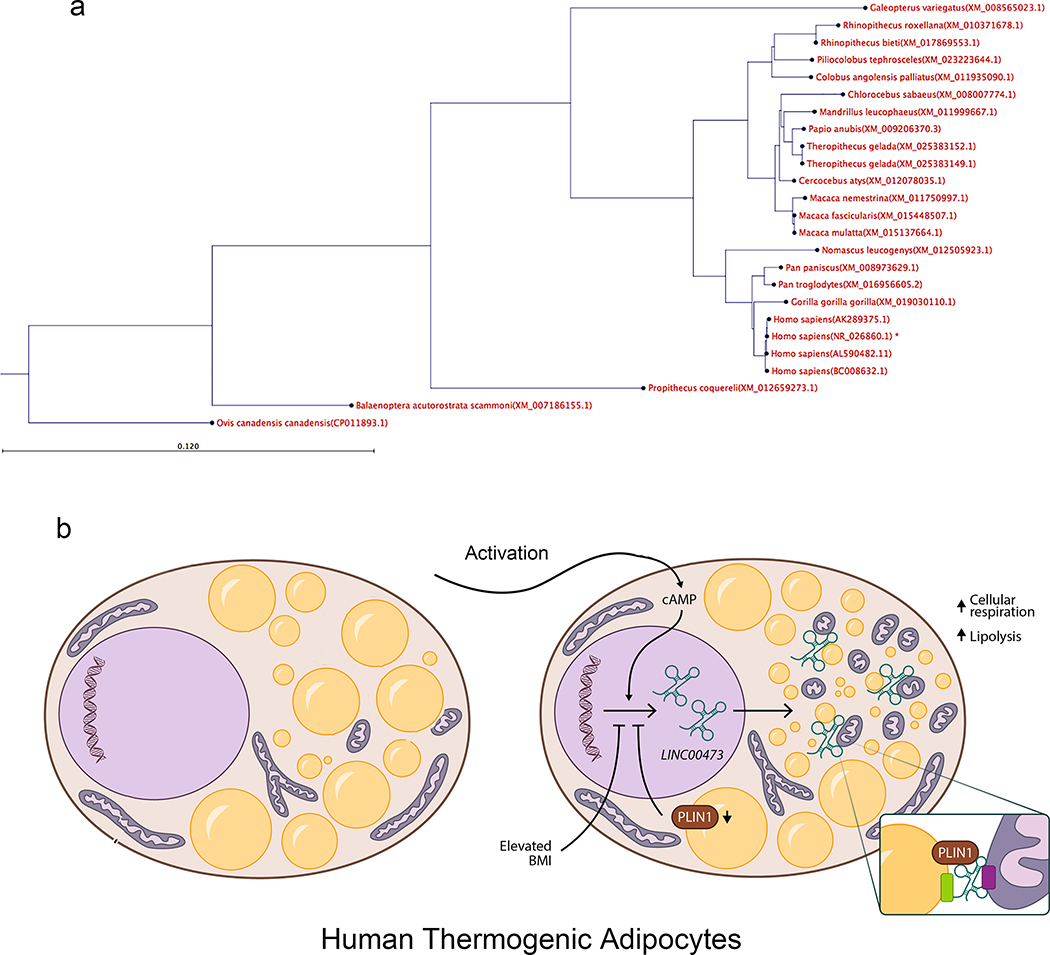
Human thermogenic adipose tissue mitigates metabolic disease, raising much interest in understanding its development and function. Here, we show that human thermogenic adipocytes specifically express a primate-specific long non-coding RNA, LINC00473 which is highly correlated with UCP1 expression and decreased in obesity and type-2 diabetes. LINC00473 is detected in progenitor cells, and increases upon differentiation and in response to cAMP. In contrast to other known adipocyte LincRNAs, LINC00473 shuttles out of the nucleus, colocalizes and can be crosslinked to mitochondrial and lipid droplet proteins. Up- or down- regulation of LINC00473 results in reciprocal alterations in lipolysis, respiration and transcription of genes associated with mitochondrial oxidative metabolism. Depletion of PLIN1 results in impaired cAMP-responsive LINC00473 expression and lipolysis, indicating bidirectional interactions between PLIN1, LINC00473 and mitochondrial oxidative functions. Thus, we suggest that LINC00473 is a key regulator of human thermogenic adipocyte function, and reveals a role for a LincRNA in inter-organelle communication and human energy metabolism.

Keywords: PLIN1; adipocyte; beige; brite; brown; fat; forskolin; lipid droplet; lipolysis; mitochondria; non-coding RNA; norepinephrine; respiration.


Conflict of interest statement

Competing Interests Statement The authors declare no competing interests.

Figures

Figure 1.
Figure 1.. Comparison of gene expression in primary adipocytes from thermogenic and non-thermogenic human adipose tissue.
a. Scheme for differentiation of primary adipocytes from stromovascular fraction. b. Example of differentiated adipocytes from abdominal subcutaneous (AbdSQ) depot, showing lipid droplets marked by Bodipy (green), and nuclei labeled with Dapi (blue). Scale bar=200μm. This experiment was repeated 3 times with similar results. c. Principal component analysis of the 1000 most differentially expressed genes between primary adipocytes from supraclavicular (SClav) or AbdSQ adipose tissue, without or with treatment with norepinephrine (NE), derived from RNASeq of samples from n=5 independent subjects. d. Unsupervised hierarchical clustering using Pearson’s correlation of same gene set used in panel (c). Marked is a cluster of genes exhibiting increased expression in response to NE in all depots. e. Volcano plot of genes differentially expressed in primary adipocytes in response to norepinephrine (NE) treatment. DESeq of datasets derived from adipocytes from 2 depots (SClav and AbdSQ) from 5 independent subjects, n=10 datasets without NE and n=10 datasets with NE. f. FPKM values for selected genes. Plotted are individual values, means and SEM for n=5 cell lines derived from 5 independent subjects. Statistical differences between selected pairs (AbdSQ vs. AbdSQ+NE; AbdSQ vs. SClav; SClav vs. SClav+NE; AbdSQ+NE vs SClav+NE) were calculated using up-paired, two-tailed student t-tests, and where P values are < 0.05, exact P values are shown. g. Levels of LINC00473 in adipose tissue sampled from SClav or AbdSQ regions. Plotted are individual FPKM values, means and SEM of n=66 independent samples from separate individuals. Statistical significance of the difference was calculated using un-paired, two-tailed student t-test. h. Correlation between UCP1 and LINC00473 values in the cohort (n=66). Data were fitted using least squares regression without weighing or special handling of outliers as implemented by Prism 8. Exact P and R2 values are shown. i. RT-PCR of LINC00473 in tissue sampled from SClav adipose tissue from individuals with the conditions depicted in the x-axis. Values are the expression of LINC00473 relative to PPIA used as a housekeeping control. Plotted are individual values, means and SEM of n=8 (BMI 17–25), n=10 (BMI 25–30), n=8 (BMI 30–39), and n=4 (T2DM) samples from independent subjects. Statistical differences relative to BMI 17–25 were calculated using one-way ANOVA, with Dunnett’s correction for multiple comparisons. Exact P values are shown.
Figure 2.
Figure 2.. LINC00473 expression is associated with thermogenic adipocyte development.
a. Example of explants from the indicated depots embedded in Matrigel and cultured for 10 days, showing sprouting and proliferation of progenitors. Similar results were seen in n=10 explants from samples from 3 independent individuals. b. Progenitors from Carotid or NeckSQ depots plated on plastic, after differentiation with adipogenic media (adipocytes), and after differentiation and exposure to Fsk daily for the last 5 days in culture (adipocytes+Fsk). Arrowheads in expanded images point to small lipid droplets in cells after Fsk stimulation. Similar results were seen in n=3 cultures from samples from 3 independent individuals. Scale bars=200 μm. c-f. RT-PCR for the genes indicated on the y-axes, from progenitors (Prog) or differentiated adipocytes (Adip) derived from the Carotid or NeckSQ depots as indicated on the x-axis. Values represent the fold-difference over the lowest detected value. Shown are individual values, mean and SEM for n=8 (Carotid progenitors and adipocytes) and n=6 (NeckSQ progenitors and adipocytes) values obtained from 2 independent cultures of cells derived from 3 or 4 different individuals (NeckSQ or Carotid, respectively). g. RT-PCR for UCP1 in adipocytes from Carotid or NeckSQ with or without Fsk stimulation as indicated in the x-axes. Shown are individual values, mean and SEM of n=8 (Carotid adipocytes) and n=6 (NeckSQ adipocytes) biologically independent samples, as described above. For c-g, statistical significance of the differences was calculated using one-way ANOVA corrected for multiple comparisons using the Holm-Sidak method. h. Hierarchical clustering of mean probe intensity values for developmental genes in adipocytes derived from Carotid, NeckSQ and AbdSQ depots from three separate individuals. i. Unsupervised hierarchical clustering of genes showing the largest coefficient of variation (range 0.1 to 0.4) in control and Fsk-treated adipocytes derived from Carotid, NeckSQ and AbdSQ depots from three individuals. j-l. RT-PCR of LINC00473 mRNA in cells derived from the depot indicated in the x-axis. Shown are individual values, means and SEM of n=9 biologically independent cultures derived from 3 different subjects. Statistical differences were calculated using the Krustal-Wallis test for non-parametric distributions, corrected for multiple comparisons using the Dunn’s test. The exact P values are shown. m. Simple linear regression analysis between LINC00473 values in progenitors and UCP1 expression in corresponding adipocytes from cultures from Carotid, NeckSQ and AbdSQ depots, representing n=26 biologically independent samples.
Figure 3.
Figure 3.. Translocation of LINC00473 to mitochondria-lipid droplet interphase.
a. Kinetics of LINC00473 induction in primary adipocytes from SClav after NE addition (NE-added) and removal (Wash). Shown are individual values means and SEM from n=3 independent experiments. b. Kinetics of LINC00473 and UCP1 induction in adipocytes after addition of 10 μM Fsk at t=0. Plotted are individual values, mean and SEM from n=6 biologically independent samples derived from 3 cultures from 2 independent subjects. c. In situ hybridization of LINC00473 in adipocytes following stimulation with 10 μM Fsk for the times indicated above each panel. This experiment was repeated 3 times with similar results. d. In situ hybridization of LINC00473 (green) and MALAT1 (red) in adipocytes following stimulation with 10 μM Fsk for the times indicated above each panel. Scale bar 40 μm. This experiment was repeated 2-times with cells from different subjects with similar results. e. Pulldown efficiency and specificity of short biotinylated oligonucleotide probes tiling the length of LINC00473. RT-PCR of LINC00473, MALAT1 and ATP6 associated with streptavidin-conjugated magnetic beads and flow through fractions by RT-PCR, expressed as percent of the total. Shown are the means and range of two technical replicates performed for this experiment. Similr results were obtaind in 2 additional independned experiments. f. Heat map of LFQ intensities of proteins associated with streptavidin-conjugated beads incubated with extracts from Fsk-treated or non-treated cells (-Fsk or +Fsk), hybridized with or without LINC00473-specific biotinylated probes. Shown are LFQ values for the top 50 proteins ranked by the ratio of (+Fsk/-Fsk with specific probes)/(+Fsk/-Fsk without specific probes). Similar results were seen in three independent experiments g. Pathway analysis for GO cellular compartment of proteins identified in (f), as implemented by Kaimal et al . h. RT-PCR values for LINC00473 in control or PLIN1 immunoprecipitants of crosslinked extracts from non-treated or norepinephrine-treated adipocytes. Values are mean and SEM for n=4 biological replicates assayed with no technical replication i. Representative western blot of immune precipitates from three separate cultures of norepinephrine-treated adipocytes used for RT-PCR in panel (h), probed with antibody to PLIN1.
Figure 4.
Figure 4.
a Schematic illustration of fractionation protocol, and RT-PCR for MALAT1, ATP6 and LINC00473 in subcellular fractions of adipocytes collected after stimulation with 10 μM Fsk for 6 h. Shown are means and ranges for n=2 independent experiments. b. RT-PCR for ATP6 and LINC00473 in the cytosolic and floating fat fractions. Shown are each value for n=3 independent experiments, and bars represent the means and error lines the SEM. Statistical significance of the difference was calculated using paired, two-tailed student t-tests. c. Maximal intensity projections of confocal stacks of adipocytes stained with antibodies to mitochondrial HSP70 (red) and PLIN1 (green) following in-situ hybridization of LINC00473 (white) in adipocytes stimulated with 10 μM Fsk for 6 h. Scale bars = 5 μm and 1 μm in expanded region. This image is representative of a minimum of 10 independent images from 4 samples prepared from cells from 2 different subjects. d. Extent of co-localization between HSP70, PLIN1 and LINC00473 in adipocytes stimulated with 10 μM Fsk for 6h. Shown are individual values, means and SEM from n=5 independent images. e. RT-PCR of PLIN1 48h after transfection of adipocytes with scrambled (siScr) and three different PLIN1-directed siRNA oligonucleotides (siPLIN1#1–3) and stimulation for 6h with vehicle or 10 μM Fsk. Values are the means and SEM of n=4 independent experiments. f. Glycerol accumulation during 48h after transfection of cells as described in panel (e). Values are the means and SEM of n=4 biological replicates. g. RT-PCR of LINC00473 48h after transfection of adipocytes with scrambled (siScr) and three different PLIN1-directed siRNA oligonucleotides (siPLIN1#1–3) and stimulation for 6h with vehicle or 10 μM Fsk. Values are the means and SEM of n=4 independent experiments. h. Glycerol accumulation in the media during 6h of vehicle or Fsk treatment of cells transfected as described in panel (g). Values are the means and SEM from two independent experiments performed in duplicate wells with no technical replication for glycerol measurement n=4. This experiment has been replicated with cells from a different donor, with similar results. For e, f, g, and h, statistical significance of the differences was estimated using ordinary one-way ANOVA corrected for multiple comparisons using the Holm-Sidak test. i. Maximal intensity projections of confocal stacks of cells stained with antibodies to mitochondrial HSP70 (red) and PLIN1 (green) following in-situ hybridization of LINC00473 (white) in adipocytes transfected with scrambled (siScr) or PLIN1-directed siRNA oligonucleotide (siPLIN1#1), stimulated with 10 μM Fsk for 6h, 48h following transfection. j-l. Image analysis of LINC00473 (j) HSP70 (k), and of areas of LINC00473 and HSP70 co-localization (l). Bars are means and error lines the SEM of n=4 independent fields each for siScr and SiPLIN1, each containing an average of 10 cells. Statistical significance of the differences between Scr and siPLIN1 for each molecule and for each parameter was calculated using un-paired, two-tailed student t-tests.
Figure 5.
Figure 5.. Functional role of LINC00473.
a. RT-PCR of LINC00473 in SClav treated with control or LINC00473-directed siRNA oligos 48h prior to stimulation with NE. Plotted are individual values, means and SEM at each time point of n=3 independent experiments. Statistical differences relative to control (siScrambled) were calculate using ANOVA corrected for multiple comparisons using the Holm-Sidak test. b. Oxygen consumption in primary adipocytes at day 12 of differentiation, treated with scrambled or LINC00473 targeted siRNAs 72 h prior to assay. Indicated are the times of addition of norepinephrine (NE), Oligomycin (OLIG), FCCP, and rotenone/antimycin (ANT) at concentrations indicated in Methods. Values are means and SEM of three experiments (n=3). c. Mitochondrial respiratory parameters were calculated using three paired time points per condition, per experiment, for an n=9 as follows: NE-induced=NE minus Basal; ATP-linked=NE minus OLIG; Proton leak=ANT minus OLIG; Respiratory reserve capacity=FCCP minus Basal; Maximal Respiratory Capacity=FCCP minus ANT. Plotted are the individual values, means and SEM. Statistical significance between Control and siLINC00473 were calculated using paired, 2-tailed student t-tests. d,e. Expression levels of the major isoform of LINC00473 (d) and of 5 splice variants (e) in in adipocytes expressing either empty vector or overexpressing LINC00473 through the CRISPR-SAM guide 6 (Gd6), stimulated with 10 μM Fsk for 6 hours. Shown are the individual values, means and SEM of data from n=6 independent cell cultures. Statistical significance of differences was calculated using ANOVA corrected for multiple comparisons using the Sidak test. f,g. Oxygen consumption rates (f), and respiratory parameters (g) in adipocytes expressing either empty vector or Gd6. Indicated are the times of addition of Forskolin (Fsk), Oligomycin (OLIG), and FCCP. Plotted in (f) are the means and SEM of six experiments performed in triplicate using two cell populations (n=6). Plotted in (g) are the means and SEM of the respiratory parameters calculated for each experiment (n=6). Statistical significance between Empty Vector and Gd6 and siLINC00473 were calculated using paired, 2-tailed student t-tests. h,i. Free fatty acids (FFA) (mmol/L) in media with and without Fsk stimulation in adipocytes expressing either empty vector or Gd6, (h) and in Gd6 cells transfected with scrambled (siScrambled) or LINC00473-directed (siLINC00473) pools of siRNA oligonucleotides (i). Ploted are the individual values, means and SEM of n=3 (FSK stimulation), and n=5 (without stimulation) independent cell cultures. j. Mitochondria DNA levels in cells treated as in panels h,i. Plotted are the individual values, means and SEM of n=8 (Empty Vector) and n=4 (Gd6, siScrambled and siLINC00473) independent cell cultures.
Figure 6.
Figure 6.. Transcriptomic changes in response to modulation of LINC00473.
a. Volcano plot of genes differentially expressed in cells overexpressing LINC00473 through the CRISPR-SAM guide 6 (Gd6). RNASeq data obtained from n=4 (empty vector) and n=3 (Gd6) independent cell cultures was compared. b. Pathways enriched in genes that were increased in Gd6 cells compared to empty vector. c. Pathways enriched in genes that were decreased in Gd6 cells compared to empty vector. d. Volcano plot of genes differentially expressed in Gd6 cells transfected with scrambled compared to directed (siLINC00473) pools of siRNA oligonucleotides. RNASeq data obtained from n=4 (Scrambled) and n=4 (siLINC00473) independent cell cultures was compared. e. Pathways enriched in genes that were decreased by LINC00473 siRNA. f. Pathways enriched in genes that were increased by LINC00473 siRNA. Yellow symbols in (a) and (d) depict genes that were reciprocally regulated by overexpression and depletion of LINC00473. g. Pathways enriched in genes that were increased in cells overexpressing LINC00473 AND decreased in cells where LINC00473 was knocked down. h. Pathways enriched in genes that were decreased in cells where LINC00473 was overexpressed AND decreased in cells where LINC00473 was knocked down.
Figure 7.
Figure 7.. Mechanisms of induction of LINC00473.
a. LINC00473 levels in NE-stimulated primary adipocytes from SClav exposed to vehicle or the adenylyl cyclase inhibitor H89 prior to stimulation. Shown are individual values, means and SEM of n=4 experiments. Statirstical significance of the difference was calculated using unpaired, two-tailed stundet t-test. b. Heatmap of genes correlated with LINC00473 with a spearman correlation coefficient of 0.9 or greater across cells from 3 different depots from 3 different subjects under two treatment conditions (- and +Fsk) as described in Figure 2. c. Pathway enrichment analysis of genes in (b). d. Expression levels of transcription factors predicted to regulate LINC00473 expression. Plotted in before-after format are individual values from cells from 5 different subjects treated without (−) or with (+) NE. Statistical significance of the differences was calculated using paired, two-tailed student t-tests. e, Knockdown efficiency of indicated transcription factors. Plotted are the individual values, means and SEM of values from n=8 independent experiments. Statistical significance of the differences was calculated using paired, two-tailed student t-tests. f. Western blots of the transcription factors targeted by siRNA as in (e) using extracts from n=3 independent cell cultures. g. Expression levels of LINC00473 in cells where the indicated transcription factors were knocked down, as in panel (e). Plotted are individual values, means and SEM of n=8 independent experiments. Statistical significance of differences was calculated using one-way ANOVA corrected for multiple comparisons using the Holm-Sidak method.
Figure 8:
Figure 8:. Phylogenetic analysis and conceptual function model for LINC00473.
a.We used BLASTN 2.8.0+ against “nr” database to find orthologs of the NR_026860.1 (Homo sapiens long intergenic non-protein coding RNA 473 (LINC00473), transcript variant 1, long non-coding RNA molecule type nucleic acid) in other organisms. To be as inclusive as possible we used the “More dissimilar sequences” (discontiguous megablast) option. We detected 243 homolog sequences from the blast. The pairwise sequence distances were used to generate a phylogenetic tree using fast minimum evolution tree method with 0.65 cut-off for maximum sequence differences. Although we did find some homolog sequences in primates, we did not detect any significant homolog sequence in lower eukaryotes. b. Conceptual model in which LINC00473 expression regulates inter-organelle communication upon activation. Activation of thermogenic adipocytes leads to cAMP-dependent expression and cytoplasmic translocation of LINC00473 to the lipid droplet-mitochondria interface, where it forms multimeric complexes that include PLIN1. Through these interactions, lipolysis and mitochondrial respiration are activated. A feedback loop where PLIN1 levels influence LINC00473 expression contributes to this regulatory mechanism.

References

    1. Rosen ED & Spiegelman BM Adipocytes as regulators of energy balance and glucose homeostasis. Nature 444, 847–853 (2006). - PMC - PubMed
    1. Harms M & Seale P Brown and beige fat: development, function and therapeutic potential. Nat Med 19, 1252–1263 (2013). - PubMed
    1. Nedergaard J & Cannon B The changed metabolic world with human brown adipose tissue: therapeutic visions. Cell Metab 11, 268–272 (2010). - PubMed
    1. Crewe C, An YA & Scherer PE The ominous triad of adipose tissue dysfunction: inflammation, fibrosis, and impaired angiogenesis. J Clin Invest 127, 74–82 (2017). - PMC - PubMed
    1. Deshmukh AS, et al. Proteomics-Based Comparative Mapping of the Secretomes of Human Brown and White Adipocytes Reveals EPDR1 as a Novel Batokine. Cell Metab 30, 963–975 e967 (2019). - PubMed

METHODS-REFERENCES

    1. Kaimal V, Bardes EE, Tabar SC, Jegga AG & Aronow BJ ToppCluster: a multiple gene list feature analyzer for comparative enrichment clustering and network-based dissection of biological systems. Nucleic Acids Res 38, W96–102 (2010). - PMC - PubMed
    1. Pedersen M, et al. Cognitive functions in middle aged individuals are related to metabolic disturbances and aerobic capacity: a cross-sectional study. PLoS One 7, e51132 (2012). - PMC - PubMed
    1. Rojas-Rodriguez R, et al. Adipose tissue angiogenesis assay. Methods Enzymol 537, 75–91 (2014). - PMC - PubMed
    1. Schmieder R & Edwards R Quality control and preprocessing of metagenomic datasets. Bioinformatics 27, 863–864 (2011). - PMC - PubMed
    1. Kim D, et al. TopHat2: accurate alignment of transcriptomes in the presence of insertions, deletions and gene fusions. Genome Biol 14, R36 (2013). - PMC - PubMed

Publication types

MeSH terms