

Studies of ApoD-/- and ApoD-/-ApoE-/- mice uncover the APOD significance for retinal metabolism, function, and status of chorioretinal blood vessels
- PMID: 32440710
- PMCID: PMC7679289
- DOI: 10.1007/s00018-020-03546-3
Studies of ApoD-/- and ApoD-/-ApoE-/- mice uncover the APOD significance for retinal metabolism, function, and status of chorioretinal blood vessels
Abstract
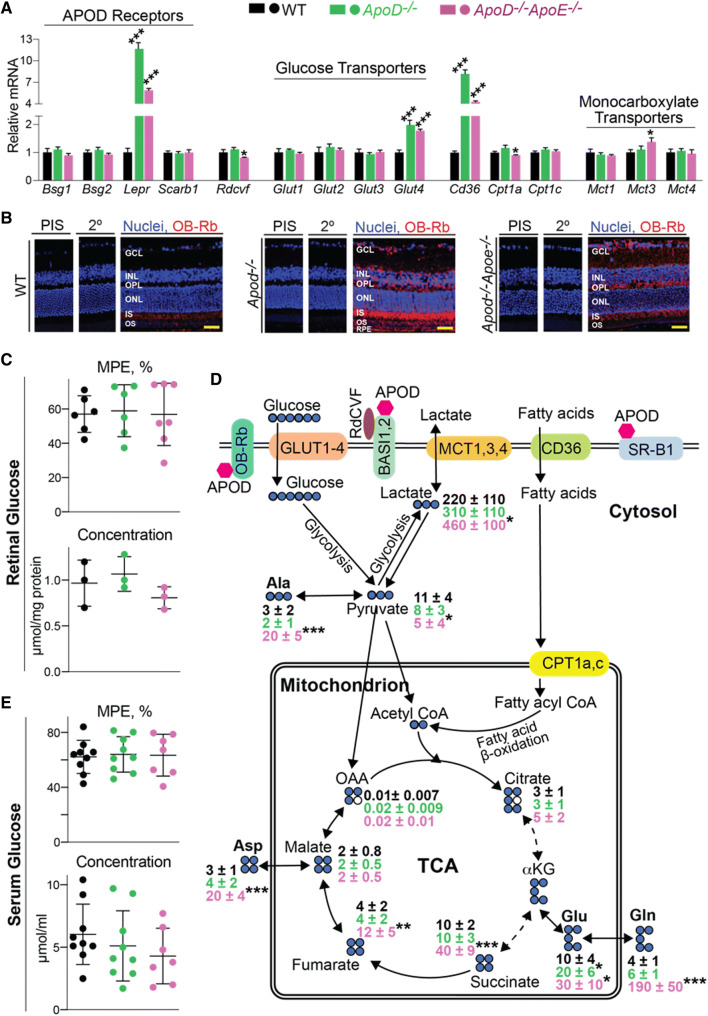
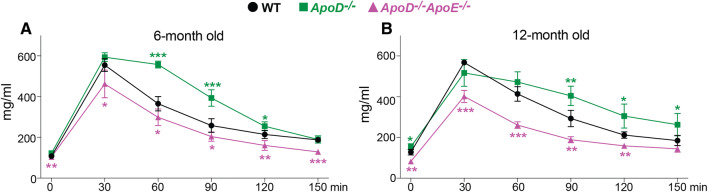
Apolipoprotein D (APOD) is an atypical apolipoprotein with unknown significance for retinal structure and function. Conversely, apolipoprotein E (APOE) is a typical apolipoprotein with established roles in retinal cholesterol transport. Herein, we immunolocalized APOD to the photoreceptor inner segments and conducted ophthalmic characterizations of ApoD-/- and ApoD-/-ApoE-/- mice. ApoD-/- mice had normal levels of retinal sterols but changes in the chorioretinal blood vessels and impaired retinal function. The whole-body glucose disposal was impaired in this genotype but the retinal glucose metabolism was unchanged. ApoD-/-ApoE-/- mice had altered sterol profile in the retina but apparently normal chorioretinal vasculature and function. The whole-body glucose disposal and retinal glucose utilization were enhanced in this genotype. OB-Rb, both leptin and APOD receptor, was found to be expressed in the photoreceptor inner segments and was at increased abundance in the ApoD-/- and ApoD-/-ApoE-/- retinas. Retinal levels of Glut4 and Cd36, the glucose transporter and scavenger receptor, respectively, were increased as well, thus linking APOD to retinal glucose and fatty acid metabolism and suggesting the APOD-OB-Rb-GLUT4/CD36 axis. In vivo isotopic labeling, transmission electron microscopy, and retinal proteomics provided additional insights into the mechanism underlying the retinal phenotypes of ApoD-/- and ApoD-/-ApoE-/- mice. Collectively, our data suggest that the APOD roles in the retina are context specific and could determine retinal glucose fluxes into different pathways. APOD and APOE do not play redundant, complementary or opposing roles in the retina, rather their interplay is more complex and reflects retinal responses elicited by lack of these apolipoproteins.
Keywords: Apolipoprotein; Cholesterol; Fatty acids; Glucose; Isotopic labeling; Leptin receptor.
Conflict of interest statement
The authors have no conflicts of interest to declare.
Figures


Similar articles
-
Absence of ApoE upregulates murine brain ApoD and ABCA1 levels, but does not affect brain sterol levels, while human ApoE3 and human ApoE4 upregulate brain cholesterol precursor levels.J Alzheimers Dis. 2009;18(2):319-29. doi: 10.3233/JAD-2009-1150. J Alzheimers Dis. 2009. PMID: 19584433
-
Effects of high-fat diet and Apoe deficiency on retinal structure and function in mice.Sci Rep. 2020 Nov 2;10(1):18601. doi: 10.1038/s41598-020-75576-7. Sci Rep. 2020. PMID: 33139746 Free PMC article.
-
Modulation of apolipoprotein D and apolipoprotein E expression in rat hippocampus after entorhinal cortex lesion.Brain Res Mol Brain Res. 1999 Jun 18;70(1):26-35. doi: 10.1016/s0169-328x(99)00123-0. Brain Res Mol Brain Res. 1999. PMID: 10381540
-
Apolipoprotein D.Gene. 2020 Sep 25;756:144874. doi: 10.1016/j.gene.2020.144874. Epub 2020 Jun 15. Gene. 2020. PMID: 32554047 Free PMC article. Review.
-
Subcellular trafficking of the substrate transporters GLUT4 and CD36 in cardiomyocytes.Cell Mol Life Sci. 2011 Aug;68(15):2525-38. doi: 10.1007/s00018-011-0690-x. Epub 2011 May 6. Cell Mol Life Sci. 2011. PMID: 21547502 Free PMC article. Review.
Cited by
-
Brain Acetyl-CoA Production and Phosphorylation of Cytoskeletal Proteins Are Targets of CYP46A1 Activity Modulation and Altered Sterol Flux.Neurotherapeutics. 2021 Jul;18(3):2040-2060. doi: 10.1007/s13311-021-01079-6. Epub 2021 Jul 7. Neurotherapeutics. 2021. PMID: 34235635 Free PMC article.
-
Characterizations of Hamster Retina as a Model for Studies of Retinal Cholesterol Homeostasis.Biology (Basel). 2021 Oct 6;10(10):1003. doi: 10.3390/biology10101003. Biology (Basel). 2021. PMID: 34681102 Free PMC article.
-
APOB100 transgenic mice exemplify how the systemic circulation content may affect the retina without altering retinal cholesterol input.Cell Mol Life Sci. 2024 Jan 22;81(1):52. doi: 10.1007/s00018-023-05056-4. Cell Mol Life Sci. 2024. PMID: 38253888 Free PMC article.
-
Apolipoprotein D as a Potential Biomarker and Construction of a Transcriptional Regulatory-Immune Network Associated with Osteoarthritis by Weighted Gene Coexpression Network Analysis.Cartilage. 2021 Dec;13(1_suppl):1702S-1717S. doi: 10.1177/19476035211053824. Epub 2021 Oct 31. Cartilage. 2021. PMID: 34719950 Free PMC article.
-
Low-Dose Anti-HIV Drug Efavirenz Mitigates Retinal Vascular Lesions in a Mouse Model of Alzheimer's Disease.Front Pharmacol. 2022 Jun 1;13:902254. doi: 10.3389/fphar.2022.902254. eCollection 2022. Front Pharmacol. 2022. PMID: 35721135 Free PMC article.
References
-
- Tserentsoodol N, Gordiyenko NV, Pascual I, et al. Intraretinal lipid transport is dependent on high density lipoprotein-like particles and class b scavenger receptors. Mol Vis. 2006;12:1319–1333. - PubMed
-
- Tserentsoodol N, Sztein J, Campos M, et al. Uptake of cholesterol by the retina occurs primarily via a low density lipoprotein receptor-mediated process. Mol Vis. 2006;12:1306–1318. - PubMed
MeSH terms
Substances
Grants and funding
LinkOut - more resources
Full Text Sources
Miscellaneous
