. 2020 May 22:9:e57656.
doi: 10.7554/eLife.57656.

Aberrant subchondral osteoblastic metabolism modifies NaV1.8 for osteoarthritis

Affiliations

Aberrant subchondral osteoblastic metabolism modifies NaV1.8 for osteoarthritis

Jianxi Zhu et al. Elife. .

Abstract

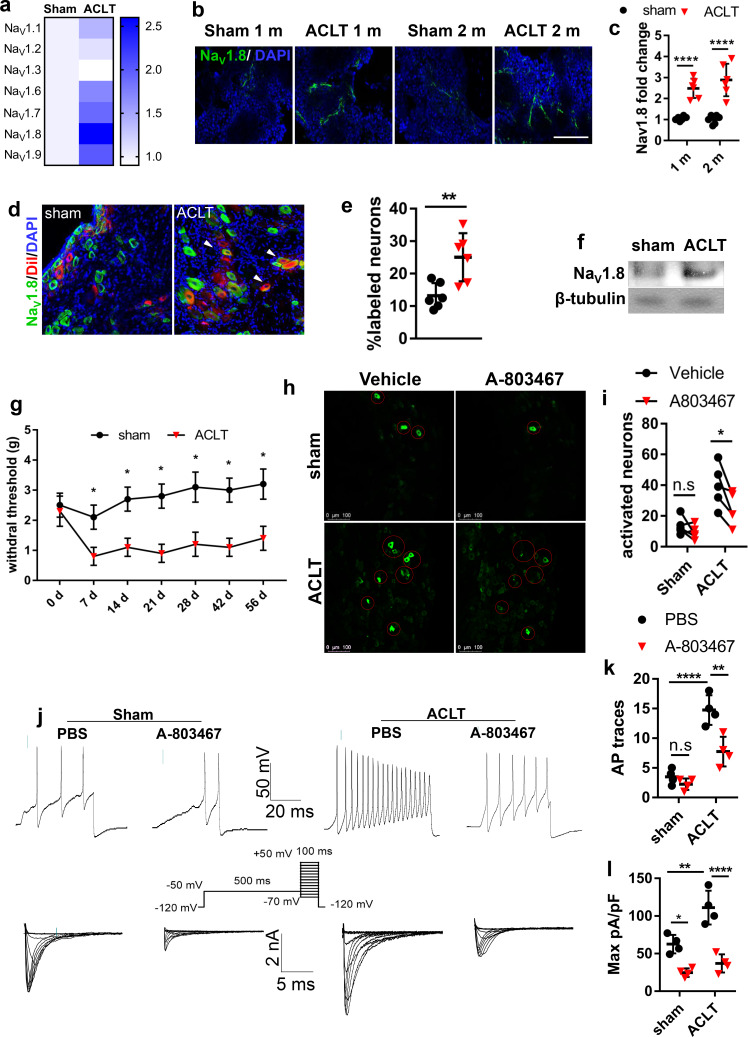
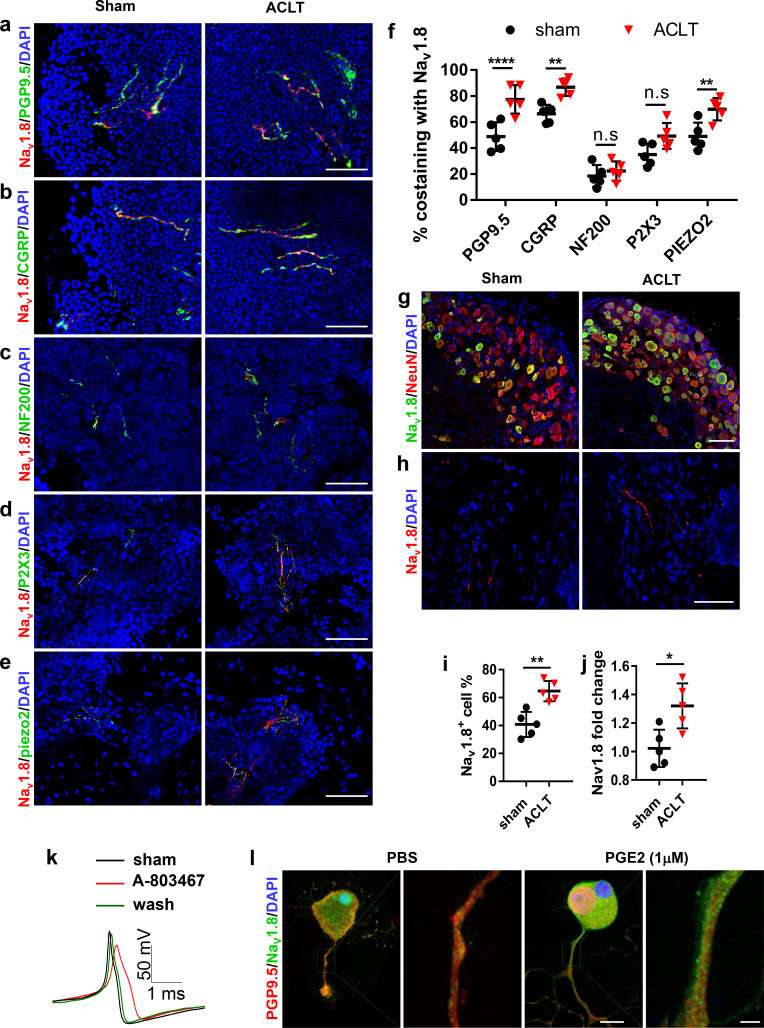
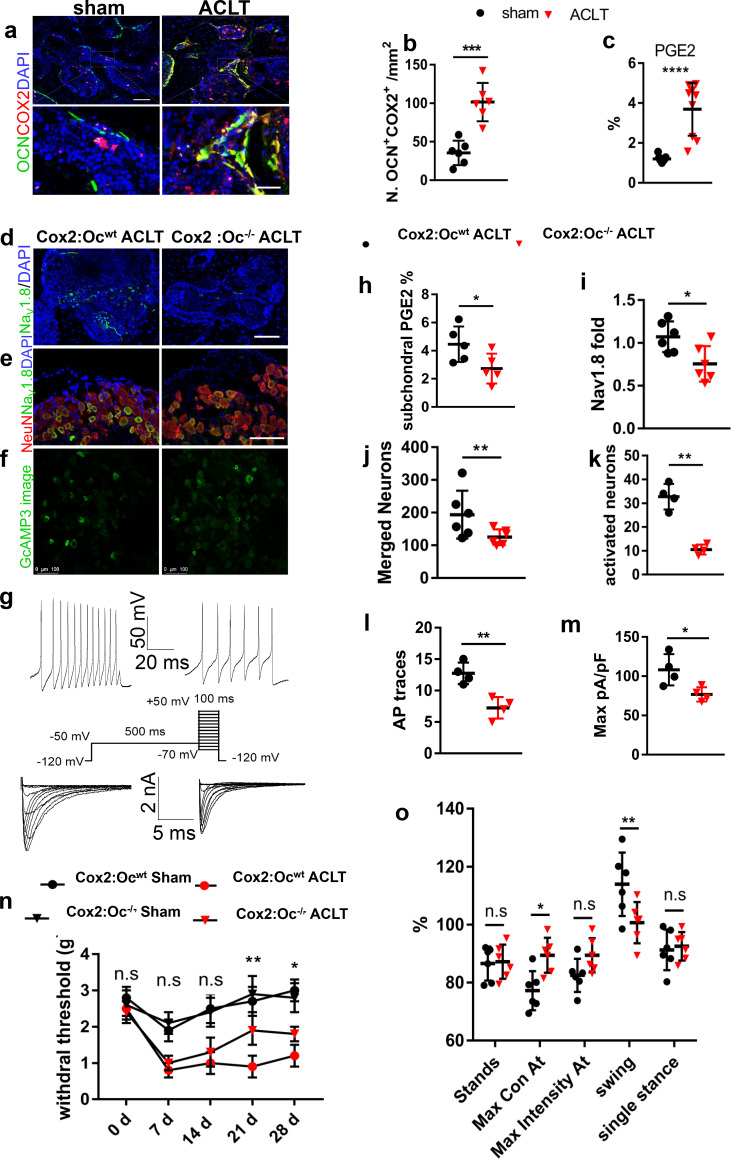
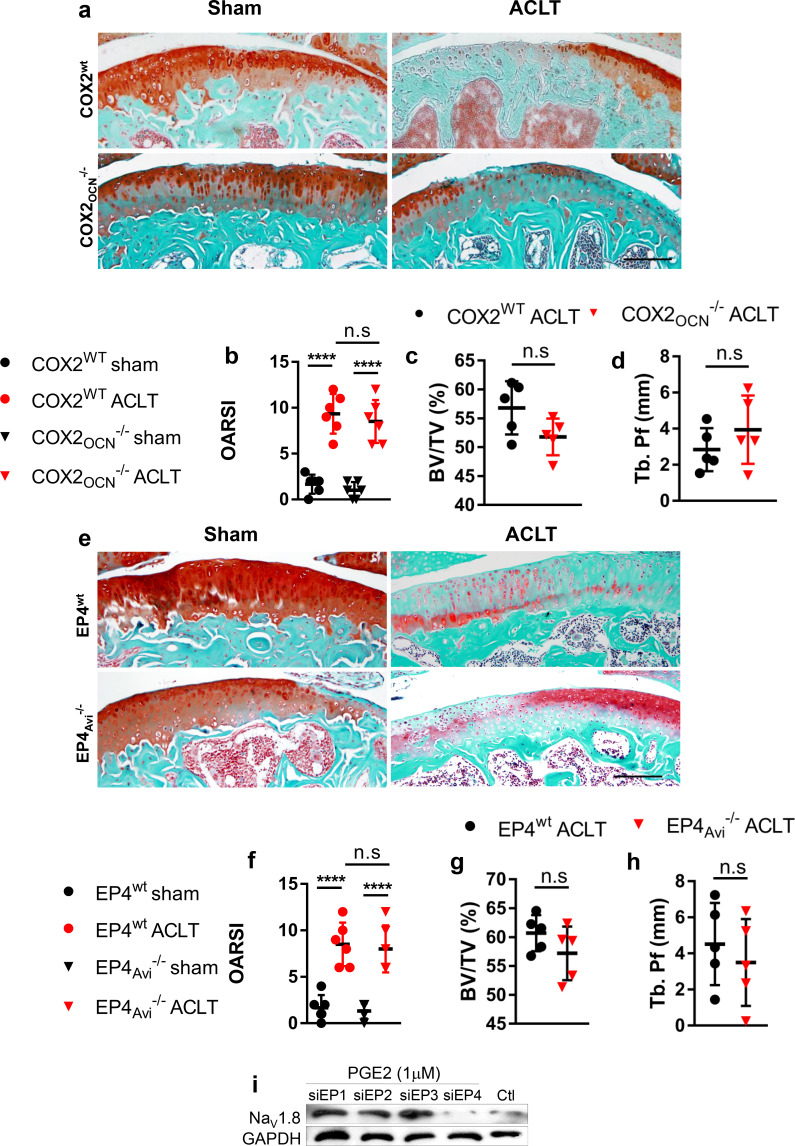
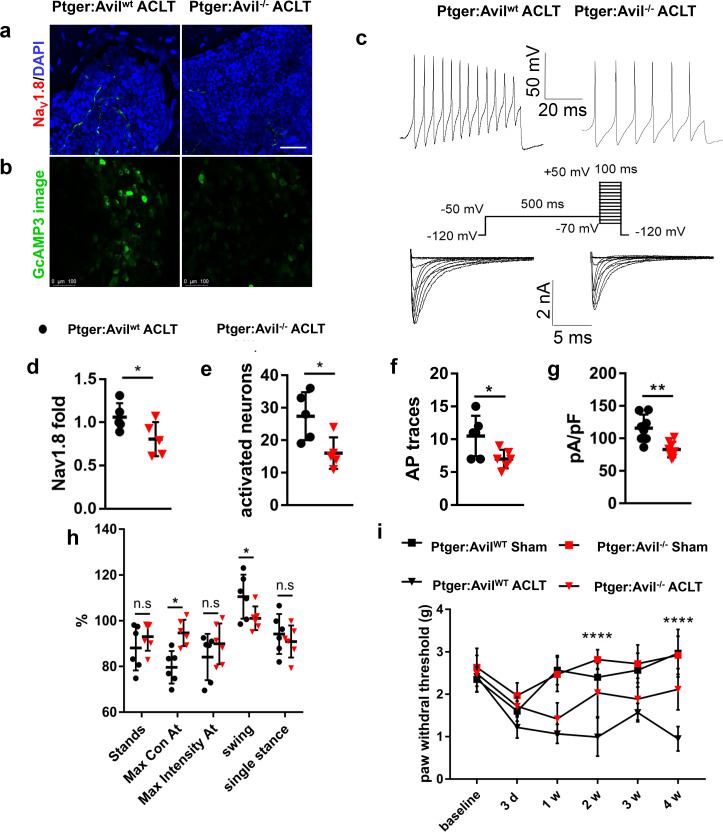
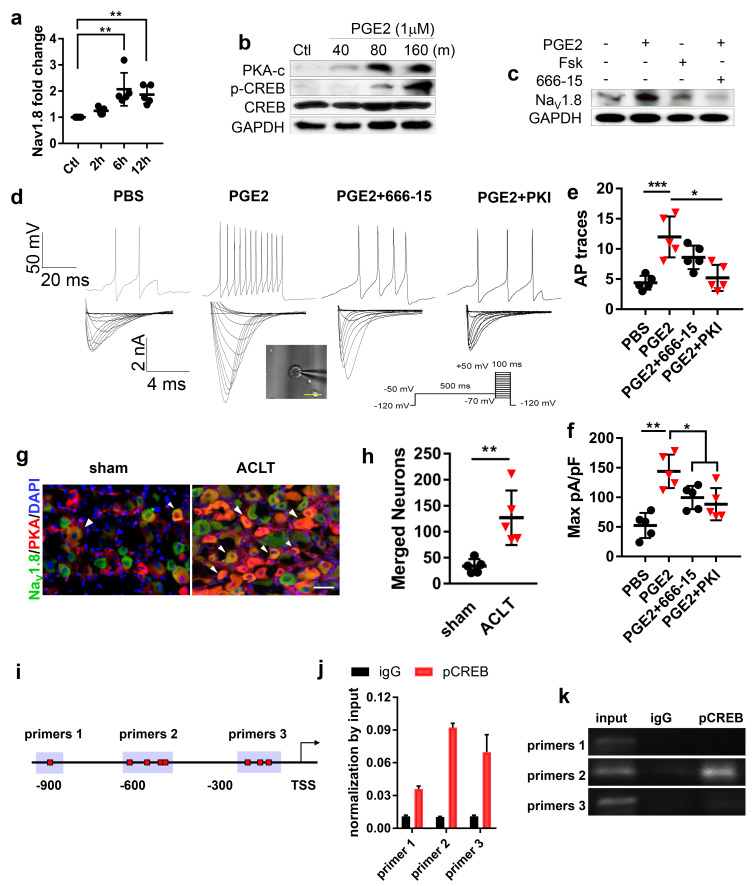
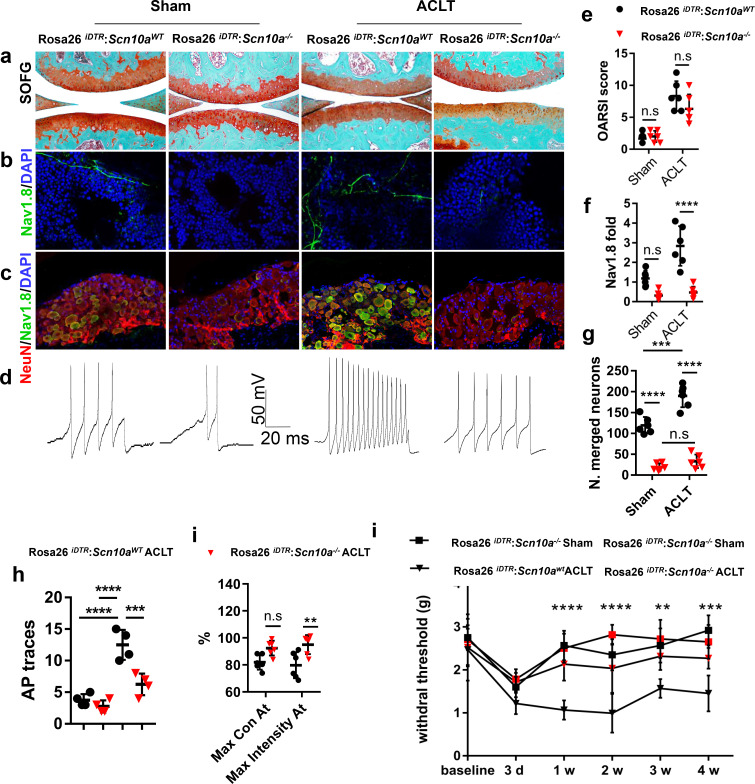
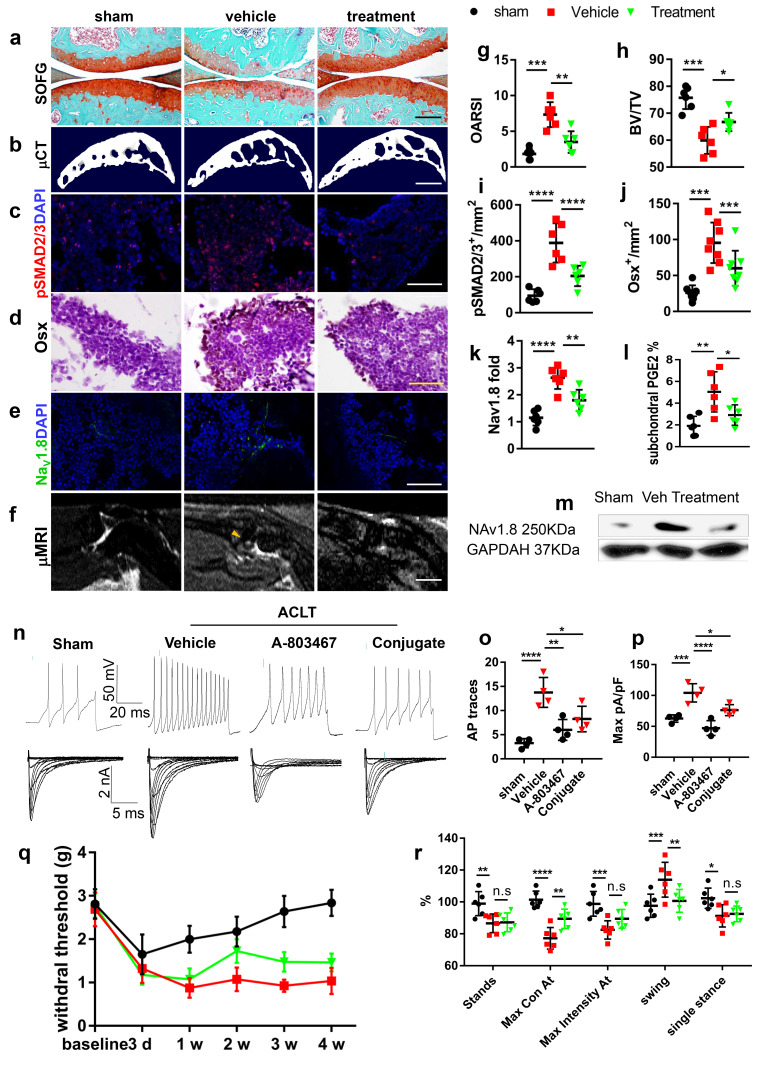
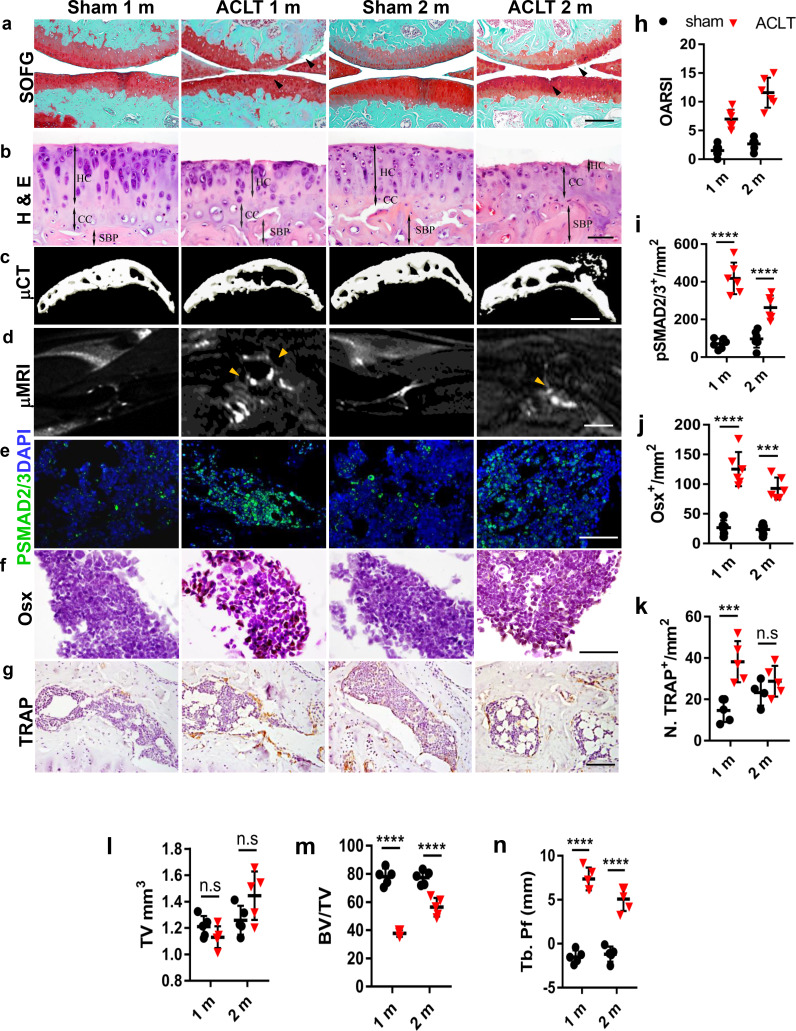
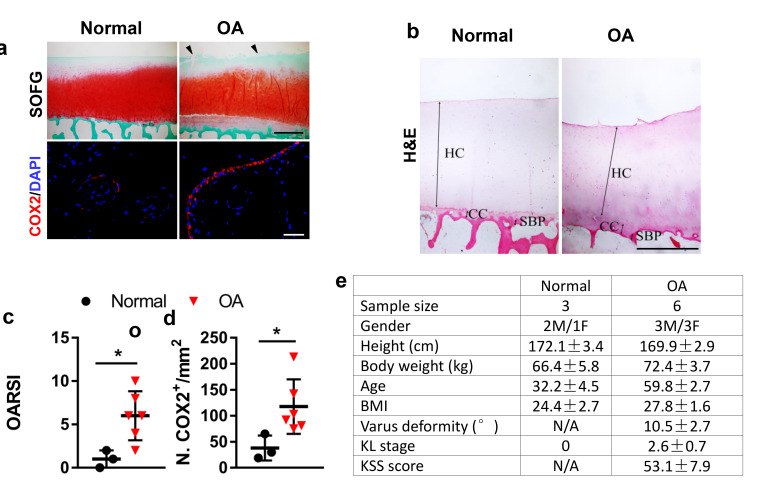
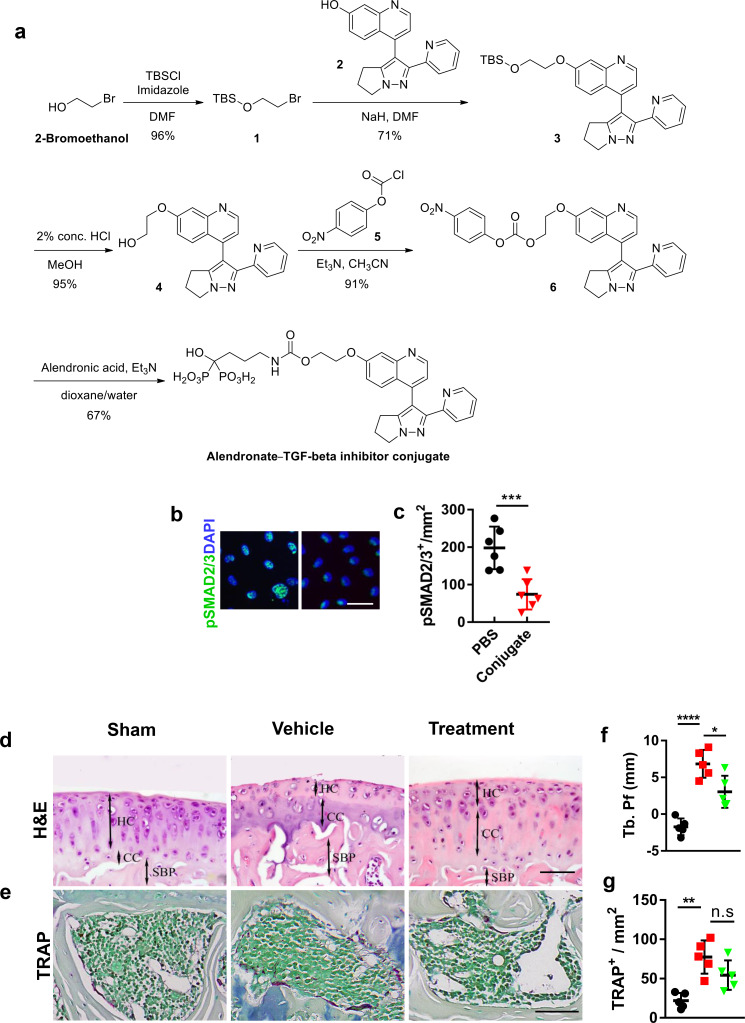
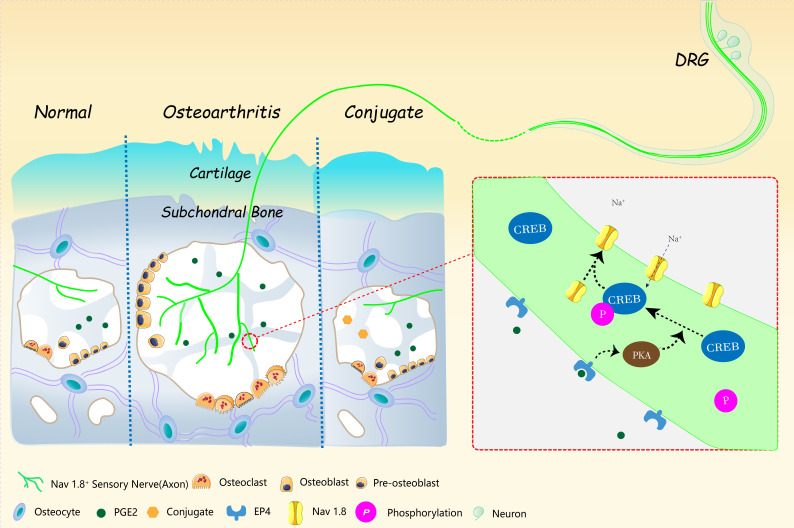
Pain is the most prominent symptom of osteoarthritis (OA) progression. However, the relationship between pain and OA progression remains largely unknown. Here we report osteoblast secret prostaglandin E2 (PGE2) during aberrant subchondral bone remodeling induces pain and OA progression in mice. Specific deletion of the major PGE2 producing enzyme cyclooxygenase 2 (COX2) in osteoblasts or PGE2 receptor EP4 in peripheral nerve markedly ameliorates OA symptoms. Mechanistically, PGE2 sensitizes dorsal root ganglia (DRG) neurons by modifying the voltage-gated sodium channel NaV1.8, evidenced by that genetically or pharmacologically inhibiting NaV1.8 in DRG neurons can substantially attenuate OA. Moreover, drugs targeting aberrant subchondral bone remodeling also attenuates OA through rebalancing PGE2 production and NaV1.8 modification. Thus, aberrant subchondral remodeling induced NaV1.8 neuronal modification is an important player in OA and is a potential therapeutic target in multiple skeletal degenerative diseases.

Keywords: Nav1.8; PGE2; human; human biology; medicine; mouse; neuroscience; osteoarthritis; osteoblast; pain.

Plain language summary

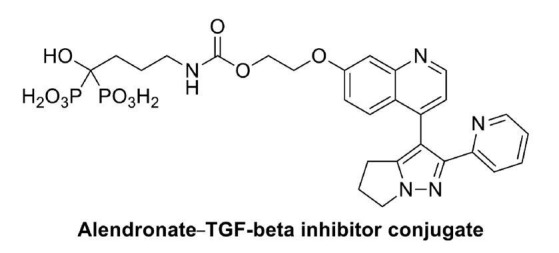
Many people will suffer from joint pain as they age, particularly in their knees. The most common cause of this pain is osteoarthritis, a disease that affects a tissue inside joints called cartilage. In a healthy knee, cartilage acts as a shock absorber. It cushions the ends of bones and enables them to move smoothly against one another. But in osteoarthritis, cartilage gradually wears away. As a result, the bones within a joint rub against each other whenever a person moves. This makes activities such as running or climbing stairs painful. But how does this pain arise? Previous work has implicated cells called osteoblasts. Osteoblasts are found in the area of the bone just below the cartilage. They produce new bone tissue throughout our lives, enabling our bones to regenerate and repair. Each time we move, forces acting on the knee joint activate osteoblasts. The cells respond by releasing a key molecule called PGE2, which is a factor in pain pathways. The joints of people with osteoarthritis produce too much PGE2. But exactly how this leads to increased pain sensation has been unclear. Zhu et al. now complete this story by working out how PGE2 triggers pain. Experiments in mice reveal that PGE2 irritates the nerve fibers that carry pain signals from the knee joint to the brain. It does this by activating a channel protein called Nav1.8, which allows sodium ions through the membranes of those nerve fibers. Zhu et al. show that, in a mouse model of osteoarthritis, Nav1.8 opens too widely in response to binding of PGE2, so the nerve cells become overactive and transmit a stronger pain sensation. This means that even small movements cause intense pain signals to travel from the joints to the brain. Building on their findings, Zhu et al. developed a drug that acts directly on bone to reduce PGE2 production, and show that this drug reduces pain in mice with osteoarthritis. At present, there are no treatments that reverse the damage that occurs during osteoarthritis, but further testing will determine whether this new drug could one day relieve joint pain in patients.


Conflict of interest statement

JZ, GZ, SA, XW, MW, YL, ZC, YG, XD, YH, XC No competing interests declared

Figures

Figure 1.
Figure 1.. Nav1.8 modification after mice model of OA.
(a) Heatmap of relative expression levels of NaV channels in ipsilateral L3-L5 DRGs after sham or ACLT surgery. (b, c) Immunostaining of NaV1.8+ (green) nerve fibers (b) and statistical analysis (c) in mouse tibial subchondral bone after sham or ACLT surgery at 1 m and 2 m. Scale bars, 20 μm, n = 6 per group. (d, e) Immunostaining of NaV1.8+ (green) nerve fibers (d) and statistical analysis (e) in ipsilateral sciatic nerve after sham or ACLT surgery at 1 m. Scale bars, 40 μm, n = 6 per group. (f) Western blots of NaV1.8 in mouse ipsilateral L3-5 DRGs 1 month post sham or ACLT surgery. the experiment was repeated three times and a representative result was chosen. (g, h) Retrograde tracing of Nav1.8 (green) and DiI (red) and DAPI (blue) double-labeled neurons (g) and percentage of double labeled neurons (h) in ipsilateral L4 DRG of rat after sham or ACLT surgery in 3 m. Scale bar, 80 μm. n = 6 per group. **p<0.01, ***p<0.001, ****p<0.0001 compared with the sham-operated group at different time points. Statistical significance was determined by multifactorial ANOVA WITH BONFERRONI POST HOC TEST (c, k, l), unpaired Student’s t test (e an i) and all data are shown as scattered plots with means ± standard deviations. (h, i) Representative photomicrographs (h) and statistically analysis of activated neurons (i) in ipsilateral L4 DRG using in vivo Pirt-GCaMP3 imaging treated before or after A803467 1 month post sham or ACLT surgery. n = 6 per group. (j–l) Representative traces of Aps (j upper), maximal current density (j lower), statistical analysis of AP numbers (k) and NaV1.8 currents (l) of DRG 1 month post sham or ACLT. **p<0.01, ***p<0.001, ****p<0.0001 compared with the sham-operated group at different time points. Statistical significance was determined by multifactorial ANOVA WITH BONFERRONI POST HOC TEST (c, k, l), unpaired Student’s t test (e an i) and all data are shown as scattered plots with means ± standard deviations.
Figure 1—figure supplement 1.
Figure 1—figure supplement 1.. NaV1.8 upregulation and colocalization in different subsets of sensory neurons in vivo and in vitro.
(a–f) Representative photographs showing NaV1.8 colocalization with PGP9.5 (a), CGRP (b), NF200 (c), P2 × 3 (d), PIEZO2 (e) and statistical analysis (f) in tibial subchondral bone in mice 4 weeks after ACLT or sham surgery. scale bar, 20 μm, n = 6 per group. (g–h) Representative photographs of NaV1.8 expression in DRGs (g) and synovial tissue (h) in mice 4 weeks after ACLT or sham surgery. scale bar, 50 μm (g), 20 μm (h). (i–j) Statistical analysis data of NaV1.8 expression in DRGs (i) and synovial tissue (j) in mice 4 weeks after ACLT or sham surgery. (k–i) Representative photographs of Aps (k) and NaV1.8 (green), PGP9.5 (red) and DAPI (blue) colocalization (l) in cultured DRG neurons treated with PGE2 (1 μM) or PBS. scale bar, 20 μm (left), 5 μm (right), experiments were repeated three times. *p<0.01, ***p<0.001, ****p<0.0001 compared with the sham-operated group or healthy donors at different time points. Statistical significance was determined by unpaired Student’s t test (f, i and j), and all data are shown as scattered plots with means ± standard deviations.
Figure 2.
Figure 2.. Decreased NaV1.8 expression and ameliorated OA progression in Cox2:OCN cKO ACLT mice.
(a,b) Representative pictures (a) and statistical analysis (b) of OCN and Cox2 co-stained cells of murine tibial subchondral bone after sham or ACLT surgery and 1 m. Scale bars, 50 μm (left) and 10 μm (right), n = 6 per group. (c) Relative concentration of subchondral PGE2 compared with total protein concentration before and after ACLT. (e–g) Nav1.8 (green) immunostaining in subchondral bone (d), NeuN (red), NaV1.8 (green) and DAPI (blue) co-immunostaining in ipsilateral L4 DRG (e), Activated neurons in ipsilateral L4 DRG using in vivo Pirt-GCaMP3 imaging (f) and AP traces and NaV currents (g) after sham or ACLT surgery at 1 m. Scale bars, 20 μm (h), 100 μm (e, f). (h–o) Statistical analysis of subchondral PGE2 concentration (h), NaV1.8 immunofluorescence signal in subchondral bone (i), number of NeuN, Nav1.8 co-immunostained neurons in ipsilateral L4 DRG (j), number of activated neurons in ipsilateral L4 DRG using in vivo Pirt-GCaMP3 imaging (k), AP traces (l) and NaV currents (m), Catwalk gait analysis (n) and left HPWT (o) after sham or ACLT surgery. n = 6 per group, *p<0.05, **p<0.01, ***p<0.001, ****p<0.0001 compared with the sham-operated group at different time points. Statistical significance was determined by multifactorial ANOVA WITH BONFERRONI POST HOC TEST (h) or unpaired Student’s t test (b, c, h–m and o), and all data are shown as scattered plots with means ± standard deviations.
Figure 2—figure supplement 1.
Figure 2—figure supplement 1.. Subchondral bone remodeling in Cox2:OCN cKO and EP4:Avil cKO mice after ACLT.
(a, b) Representative photos of knee joint Safranin Orange and fast green staining (a) and statistical analysis (b) in Bglap-Cre::Cox2fl/fl or Cox2fl/f mice 4 weeks after sham or ACLT surgery at 1 m. Scale bars, 500 μm. (c, d) Statistical analysis of BV/TV (c) and Tb. Pf (d) in Bglap-Cre::Cox2fl/f mice 4 weeks after sham or ACLT surgery at 1 m. n = 6 per group. (e, f) Representative photos of knee joint Safranin Orange and fast green staining (e) and statistical analysis (f) in Avil-Cre::Ptger4fl/fl or Ptger4fl/fl mice 4 weeks after sham or ACLT surgery at 1 m. Scale bars, 500 μm. (g, h) Statistical analysis of BV/TV (g) and Tb. Pf (h) in Ptger4Avi-/- mice 4 weeks after sham or ACLT surgery at 1 m. n = 6 per group. (i) western blot of EPs knockdown on the effect of Nav1.8 upregulation after PGE2 stimulation in DRG. *p<0.01, ***p<0.001, ****p<0.0001 compared with the sham-operated group or healthy donors at different time points. Statistical significance was determined by unpaired Student’s t test (b, c, d, f, g and h), and all data are shown as scattered plots with means ± standard deviations.
Figure 3.
Figure 3.. Decreased NaV1.8 expression and ameliorated mechanical allodynia in Avil-Cre::Ptger4fl/fl ACLT mice.
(a, b) NaV1.8 immunostaining in subchondral bone (a), Activated neurons in ipsilateral L4 DRG using in vivo Pirt-GCaMP3 imaging (b) after sham or ACLT surgery at 1 m. Scale bars, 20 μm (a), 100 μm (b). (c) Representative traces of action potentials (upper) and Nav1.8 currents (lower) of ipsilateral L3-5 DRG neurons after sham or ACLT surgery at 1 m. (d–i) Statistical analysis of Nav1.8 immunofluorescence signal in subchondral bone (d), number of activated neurons in ipsilateral L4 DRG using in vivo Pirt-GCaMP3 imaging (e), AP traces (f), max Nav1.8 current density (g), catwalk gait analysis (h) and left hindpaw PWT (i) after sham or ACLT surgery. n = 6 per group, *p<0.05, **p<0.01, ***p<0.001, ****p<0.0001 compared with the sham-operated group at different time points. Statistical significance was determined by multifactorial ANOVA WITH BONFERRONI POST HOC TEST (i) or unpaired Student’s t test (d–h), and all data are shown as scattered plots with means ± standard deviations.
Figure 4.
Figure 4.. PGE2 upregulates NaV1.8 through PKA signaling.
(a) RT-QPCR analysis of Nav1.8 in cultured lumbar DRG neurons treated with PGE2 (1 μM) for 2–12 hr. n = 6 per group. (b) Representative of western blots of PKA-c, CREB and p-CREB in cultured lumbar DRG neurons treated with PGE2 (1 μM) for 40–160 min. (c) Representative of western blots of the Nav1.8 in cultured lumbar DRG neurons treated with PGE2 (1 μM), forskolin (10 μM), or 666–15 (1 μM) for 6 hr. Representative traces of action potentials (d, upper) and Nav1.8 currents (d, lower) and statistical analysis of maximal Nav1.8 current density (f) of cultured lumbar DRG neurons after sham or ACLT surgery at 1 m. n = 6 per group. (e, f) Co-immunostaining of NeuN and Nav1.8 (g) and statistical analysis of merged cell numbers (h) in ipsilateral L4 DRGs after sham or ACLT surgery at 1 m. n = 6 per group.(i–k) ChIP experiment showing putative primers (i), PCR (j) and gel running results (k) of NaV1.8 promoter, the experiments were repeated three times. n.s, non significant, *p<0.05, **p<0.01, ***p<0.001, ****p<0.0001 compared with the sham-operated group at different time points. Statistical significance was determined by multifactorial ANOVA WITH BONFERRONI POST HOC TEST (a, e and f), unpaired Student’s t test (h), all data are shown as scattered plots with means ± standard deviations.
Figure 5.
Figure 5.. Mechanical allodynia is reduced in Scn10a-Cre::Rosa26iDTRfl/fl ACLT mice.
(a–d) Representative photos of knee joint Safranin Orange and fast green staining (a), Nav1.8 (green) and DAPI (blue) immunofluorescence in subchondral bone (b) and NeuN (red, Nav1.8 (green) and DAPI (blue) co-immunostaining of ipsilateral L4 DRGs (c) and APs (d) after sham or ACLT surgery at 1 m. Scale bars, 500 μm (a), 20 μm (b) and 100 μm (c), n = 6 per group. (e–j) Statistical analysis of OARSI score (e), Nav1.8 immunofluorescence signal in subchondral bone (f), number of NeuN, Nav1.8 co-immunostained neurons in ipsilateral L4 DRG (g), number of AP (h), catwalk gait analysis (i) and left hindpaw PWT (j) after sham or ACLT surgery. n = 6 per group, *p<0.05, **p<0.01, ***p<0.001, ****p<0.0001 compared with the sham-operated group at different time points. Statistical significance was determined by multifactorial ANOVA WITH BONFERRONI POST HOC TEST (e–h and j) or unpaired Student’s t test (i), and all data are shown as scattered plots with means ± standard deviations.
Figure 6.
Figure 6.. Targeting aberrant subchondral bone remodeling reduces NaV1.8+ innervation and ameliorates OA pain.
(a–f) Representative photos of Safranin Orange and fast green staining (a), μCT 3D reconstruction (b), pSMAD2/3 (red) and DAPI (blue) immunostaining (c) Osterix immunostaining (d) Nav1.8 (green) and DAPI (blue) immunostaining (e) and T2 weighted fat suppression μMRI image showing bone marrow lesion (yellow arrows) (f) of murine tibial subchondral bone after sham or ACLT surgery at 1 m. Scale bars, 500 μm (a), 2 mm (b), 10 μm (c, d), 20 μm (e), and 5 mm (f), n = 6 per group. (g–l) Quantitative analysis of OARSI score (g), BV/TV (h), number of pSMAD2/3+ cells per mm2 (i) and number of Osterix+ cells per mm2 (j), relative pixel of Nav1.8 immunofluorescence signal (k) and subchondral PGE2 concentrations (l), after sham or ACLT surgery at 1 m. (m) Representative western blots of NaV1.8 and GAPDH of ipsilateral L3-5 DRG lysate, experiments were repeated three times. (n–p) Representative traces of Aps (n upper), maximal current density (n lower), statistical analysis of AP numbers (o) and NaV1.8 currents (p) of DRG 1 month post sham or ACLT. (q, r), left HPWT (q) and catwalk gait analysis (r) n = 6 per group, *p<0.05, **p<0.01, ***p<0.001, ****p<0.0001 compared with the sham-operated group at different time points. Statistical significance was determined by multifactorial ANOVA WITH BONFERRONI POST HOC TEST (j, k, L, m, n, o, q and r) or unpaired Student’s t test (c), and all data are shown as scattered plots with means ± standard deviations.
Figure 6—figure supplement 1.
Figure 6—figure supplement 1.. Aberrant subchondral bone remodeling after ACLT.
(a–g) Parameters of subchondral bone remodeling in OA progression. Safranin Orange and fast green staining (a), H and E staining (b), μCT 3D reconstruction (c), representatives of T2 weighted fat suppression μMRI image showing bone marrow lesion (yellow arrows) (d), pSMAD2/3 (green) immunostaining (e) and Osterix immunostaining (f) and TRAP staining (g) of murine tibial subchondral bone after sham or ACLT surgery at 1 m and 2 m. Scale bars, 500 μm (a, b), 2 mm (c), 5 mm (d), 10 μm (e–g), n = 6 per time point. (h–n) Quantitative analysis of OARSI score (h), number of pSMAD2/3+ cells per mm2 (i), number of Osterix+ cells per mm2 (j), number of TRAP+ cells per mm2 (k), TV (l), BV/TV (g) and Tb Pf (n) after sham or ACLT in 1 m, n = 6 per time point. *p<0.01, ***p<0.001, ****p<0.0001 compared with the sham-operated group or healthy donors at different time points. Statistical significance was determined by multifactorial ANOVA WITH BONFERRONI POST HOC TEST (h–n) and all data are shown as scattered plots with means ± standard deviations.
Figure 6—figure supplement 2.
Figure 6—figure supplement 2.. Parameters of aberrant subchondral bone remodeling in human and mice osteoarthritis.
(a, b) Representative photographs (a) and statistical analysis (b) of TRAP staining in mice 1 month and 2 month after ACLT of sham surgery. scale bar, 50 μm, n = 6 per group. (c, d) μCT 3D analysis data: TV (c) and Tb. Pf (d) of mice knee subchondral bone 4 w after ACLT or sham surgery, n = 6 per group. (e, f) H and E staining of cartilage and subchondral bone of mice ACLT or sham surgery (e) and human OA or healthy samples (f). scale bar, 50 μm (e), 200 μm (f). (g) Demographic data of human patients. *p<0.01, ***p<0.001, ****p<0.0001 compared with the sham-operated group or healthy donors at different time points. Statistical significance was determined by unpaired Student’s t test (b, c and d), and all data are shown as scattered plots with means ± standard deviations.
Figure 6—figure supplement 3.
Figure 6—figure supplement 3.. Alendronate-TβR1I inhibitor conjugate attenuates aberrant subchondral bone remodeling after ACLT.
(a) De novo synthesis of Alendronate-TβR1I inhibitor conjugate. (b, c) Representative photos (b) and statistical analysis (c) of pSMAD signal in immunostaining of human MSCs, 20 μm. (d, e) Representative photos of knee joint H and E (d) and TRAP (e) staining in mice 4 weeks after sham or ACLT or surgery or treatment at 1 m. Scale bars, 50 μm (b), 20 μm (c). (f, g) Statistical analysis of Tb. Pf (f) and TRAP+ cells (g) in WT mice 4 weeks after sham or ACLT surgery or treatment at 1 m. n = 6 per group. *p<0.01, ***p<0.001, ****p<0.0001 compared with the sham-operated group or healthy donors at different time points. Statistical significance was determined by multifactorial ANOVA WITH BONFERRONI POST HOC TEST (f, g), unpaired Student’s t test (c) and all data are shown as scattered plots with means ± standard deviations.
Figure 7.
Figure 7.. The working model of osteoblastic PGE2 induces OA progression by NaV1.8 modification.
Author response image 1.

Similar articles

Cited by

References

    1. Abdel-Magid AF. Selective EP4 antagonist may be useful in treating arthritis and arthritic pain. ACS Medicinal Chemistry Letters. 2014;5:104–105. doi: 10.1021/ml5000367. - DOI - PMC - PubMed
    1. Akopian AN, Sivilotti L, Wood JN. A tetrodotoxin-resistant voltage-gated sodium channel expressed by sensory neurons. Nature. 1996;379:257–262. doi: 10.1038/379257a0. - DOI - PubMed
    1. Akopian AN, Souslova V, England S, Okuse K, Ogata N, Ure J, Smith A, Kerr BJ, McMahon SB, Boyce S, Hill R, Stanfa LC, Dickenson AH, Wood JN. The tetrodotoxin-resistant sodium channel SNS has a specialized function in pain pathways. Nature Neuroscience. 1999;2:541–548. doi: 10.1038/9195. - DOI - PubMed
    1. Ashraf S, Wibberley H, Mapp PI, Hill R, Wilson D, Walsh DA. Increased vascular penetration and nerve growth in the meniscus: a potential source of pain in osteoarthritis. Annals of the Rheumatic Diseases. 2011;70:523–529. doi: 10.1136/ard.2010.137844. - DOI - PubMed
    1. Basbaum AI, Bautista DM, Scherrer G, Julius D. Cellular and molecular mechanisms of pain. Cell. 2009;139:267–284. doi: 10.1016/j.cell.2009.09.028. - DOI - PMC - PubMed

Publication types