. 2020 Jul;24(14):7751-7766.
doi: 10.1111/jcmm.15407. Epub 2020 May 22.

Metformin regulates adiponectin signalling in epicardial adipose tissue and reduces atrial fibrillation vulnerability

Affiliations

Metformin regulates adiponectin signalling in epicardial adipose tissue and reduces atrial fibrillation vulnerability

Biao Li et al. J Cell Mol Med. 2020 Jul.

Abstract

Epicardial adipose tissue (EAT) remodelling is closely related to the pathogenesis of atrial fibrillation (AF). We investigated whether metformin (MET) prevents AF-dependent EAT remodelling and AF vulnerability in dogs. A canine AF model was developed by 6-week rapid atrial pacing (RAP), and electrophysiological parameters were measured. Effective refractory periods (ERP) were decreased in the left and right atrial appendages as well as in the left atrium (LA) and right atrium (RA). MET attenuated the RAP-induced increase in ERP dispersion, cumulative window of vulnerability, AF inducibility and AF duration. RAP increased reactive oxygen species (ROS) production and nuclear factor kappa-B (NF-κB) phosphorylation; up-regulated interleukin-6 (IL-6), tumour necrosis factor-α (TNF-α) and transforming growth factor-β1 (TGF-β1) levels in LA and EAT; decreased peroxisome proliferator-activated receptor gamma (PPARγ) and adiponectin (APN) expression in EAT and was accompanied by atrial fibrosis and adipose infiltration. MET reversed these alterations. In vitro, lipopolysaccharide (LPS) exposure increased IL-6, TNF-α and TGF-β1 expression and decreased PPARγ/APN expression in 3T3-L1 adipocytes, which were all reversed after MET administration. Indirect coculture of HL-1 cells with LPS-stimulated 3T3-L1 conditioned medium (CM) significantly increased IL-6, TNF-α and TGF-β1 expression and decreased SERCA2a and p-PLN expression, while LPS + MET CM and APN treatment alleviated the inflammatory response and sarcoplasmic reticulum Ca2+ handling dysfunction. MET attenuated the RAP-induced increase in AF vulnerability, remodelling of atria and EAT adipokines production profiles. APN may play a key role in the prevention of AF-dependent EAT remodelling and AF vulnerability by MET.

Keywords: adiponectin; atrial fibrillation; epicardial adipose tissue; inflammation; metformin.


Conflict of interest statement

The authors report no relationship that could be construed as a conflict of interest.

Figures

Figure 1
Figure 1
Metformin attenuated RAP‐induced atrial remodelling. A, Changes in mean ERPs in the left atrium (LA), right atrium (RA), left atrial appendage (LAA) and right atrial appendage (RAA). B, Changes in ERP dispersion, (C) cumulative window of vulnerability, (D) mean AF duration and (E) AF inducibility ratio in the sham‐operated group, RAP group, and RAP + MET group (n = 6 animals/group). * P < .05 compared with the sham‐operated group; # P < .05 compared with the RAP group. ERP = effective refractory period; ∑WOV = cumulative window of vulnerability
Figure 2
Figure 2
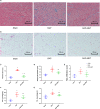
Metformin attenuated RAP‐induced atrial fibrosis and epicardial fat deposition. A, B, Representative Masson staining of the left atrium (LA) and HE staining of the epicardial adipose tissue (EAT) in the sham‐operated group, RAP group and RAP + MET group, 6 weeks after pacemaker implantation (n = 6 animals/group, 200 × magnification, scale bar = 100 μm). C, Percentage area of fibrosis in the LA. D, Mean adipocyte Feret's diameter in the EAT. E, Epicardial adipose tissue infiltration score in the sham‐operated group, RAP group and RAP + MET group. F, G, FFA and TG concentrations in the EAT, 6 weeks after pacemaker implantation (n = 6 for each group). * P < .05 compared with the sham‐operated group; # P < .05 compared with the RAP group. FFA, free fatty acid; TG, triglyceride
Figure 3
Figure 3
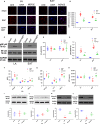
Cytokines and APN system key factors altered in response to RAP and metformin treatment. A, B, Representative DHE staining and quantitative analysis to detect ROS in the LA and in the EAT in the sham‐operated group, RAP group and RAP + MET group, 6 weeks after pacemaker implantation (n = 6 animals/group, 400 × magnification, scale bar = 50 μm). C‐E, Representative immunoblots and quantitative analysis of the relative changes in NF‐κB and pNF‐κB expression in the LA and the EAT. F‐H, TGF‐β1, IL‐6, TNF‐α, and APN concentrations in the LA and EAT in the sham‐operated group, RAP group and RAP + MET group, 6 weeks after surgery (n = 6 animals/group). I‐L, Representative immunoblots and quantitative analysis of the relative changes in PPARγ and AdipoR1 in the LA and EAT. * P < .05 compared with the sham‐operated group; # P < .05 compared with the RAP group. DHE, dihydroethidium; LA, left atrium; EAT, epicardial adipose tissue; TGF‐β1, transforming growth factor‐β1; IL‐6, interleukin‐6; TNF‐α, tumour necrosis factor‐α; APN, adiponectin
Figure 4
Figure 4
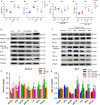
Metformin suppressed LPS‐stimulated inflammation in 3T3‐L1 adipocytes and supernatant‐mediated inflammation in HL‐1 cardiomyocytes. A‐D, APN and TNF‐α concentrations in HL‐1 and 3T3‐L1 supernatants after the indicated experiments. All experiments have been repeated 5 times (n = 5). E‐H, Representative immunoblots and quantitative analysis of the relative changes in intracellular inflammatory factors expression in 3T3‐L1 adipocytes and HL‐1 myocytes. All experiments have been repeated 5 times (n = 5). * P < .05 compared with the normal group; # P < .05 compared with the control group or 3T3‐L1 Con CM group, $ P < .05 compared with the LPS group or 3T3‐L1 LPS CM group, & P < .05 compared with the LPS + MET group or 3T3‐L1 LPS + MET CM group
Figure 5
Figure 5
3T3‐L1 CM affected the Ca2+ homeostasis in HL‐1 atrial myocytes. A, Representative image of HL‐1 cytosolic Ca2+, measured with Fluo‐4 AM following 3T3‐L1 CM treatment. B, Quantitative analysis of intracellular Ca2+ fluorescence, using a fluorescent microplate reader. All experiments have been repeated 5 times (n = 5). C‐H, Representative immunoblots and quantitative analysis of the relative changes in HL‐1 Ca‐handling proteins after 3T3‐L1 CM treatment. All experiments have been repeated 5 times (n = 5). * P < .05 compared with the normal group; # P < .05 compared with the control group, $ P < .05 compared with the LPS group, & P < .05 compared with the LPS + MET group
Figure 6
Figure 6
APN treatment reduced the expression of inflammatory factors and improved the function of sarcoplasmic reticulum Ca2+ handling. A, C, Representative immunoblots and quantitative analysis of the relative changes in Ca2+ handling protein expression in HL‐1 after 3T3‐L1 CM and APN treatment. All experiments have been repeated 5 times (n = 5). B, D, Representative immunoblots and quantitative analysis of inflammatory factors and APN expression in HL‐1 cells after 3T3‐L1 CM and APN treatment. All experiments have been repeated 5 times (n = 5). * P < .05 compared with the normal group; # P < .05 compared with the 3T3‐L1 Con CM group, $ P < .05 compared with the 3T3‐L1 LPS CM group
Figure 7
Figure 7
Pre‐neutralizing APN blocked its effect on inflammatory response and Ca2+ homeostasis. A, C, Representative immunoblots and quantitative analysis of the relative changes in Ca‐handling protein expression in HL‐1 cells after treatment with 3T3‐L1 CM or 3T3‐L1 LPS + MET CM, which was pre‐neutralized using an adiponectin antibody. All experiments have been repeated 3 times (n = 3). B, D, Representative immunoblots and quantitative analysis of the relative changes in inflammatory factors and APN in HL‐1 cells after treatment with 3T3‐L1 CM or 3T3‐L1 LPS + MET CM, which was pre‐neutralized using an adiponectin antibody. * P < .05 compared with the normal group; # P < .05 compared with the 3T3‐L1 Con CM group, $ P < .05 compared with the 3T3‐L1 LPS CM group, & P < .05 compared with the 3T3‐L1 LPS + MET CM group. E, Metformin reversed atrial fibrillation‐induced epicardial adipose tissue (EAT) remodelling, which in turn contributed to AF progression. Atrial fibrillation led to epicardial adipose tissue remodelling and promoted atrial inflammation and fibrosis. Metformin suppressed the ROS/NF‐κB signalling pathway and reduced EAT inflammatory cytokine secretion. In addition, MET activated the PPARγ/APN signalling pathway, further attenuated adjacent myocardial inflammation and fibrosis to interrupt the vicious circle of ‘AF begets AF’

References

    1. Benjamin EJ, Wolf PA, D'Agostino RB, Silbershatz H, Kannel WB, Levy D. Impact of atrial fibrillation on the risk of death: the Framingham Heart Study. Circulation. 1998;98:946‐952. - PubMed
    1. Al Chekakie MO, Welles CC, Metoyer R, et al. Pericardial fat is independently associated with human atrial fibrillation. J Am Coll Cardiol. 2010;56:784‐788. - PubMed
    1. Wong CX, Abed HS, Molaee P, et al. Pericardial fat is associated with atrial fibrillation severity and ablation outcome. J Am Coll Cardiol. 2011;57:1745‐1751. - PubMed
    1. Wong CX, Ganesan AN, Selvanayagam JB. Epicardial fat and atrial fibrillation: current evidence, potential mechanisms, clinical implications, and future directions. Eur Heart J. 2017;38:1294‐1302. - PubMed
    1. Chilukoti RK, Giese A, Malenke W, et al. Atrial fibrillation and rapid acute pacing regulate adipocyte/adipositas‐related gene expression in the atria. Int J Cardiol. 2015;187:604‐613. - PubMed

Publication types

MeSH terms