. 2020 Jun;26(6):1091-1101.
doi: 10.3201/eid2606.191168.

Epidemiologic Changes of Scrub Typhus in China, 1952-2016

Epidemiologic Changes of Scrub Typhus in China, 1952-2016

Zhongjie Li et al. Emerg Infect Dis. 2020 Jun.

Abstract

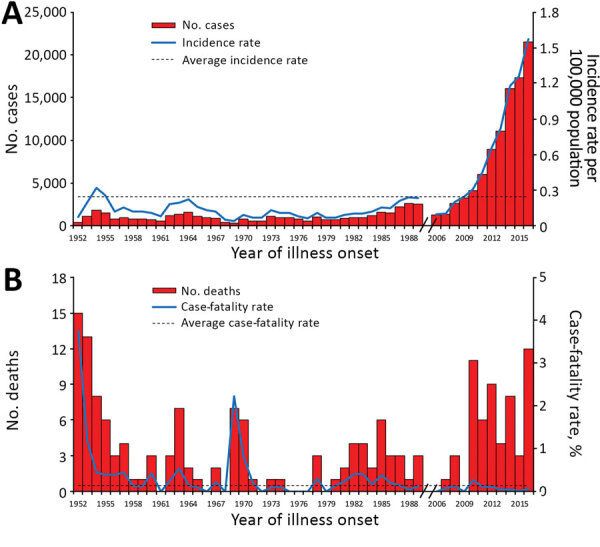
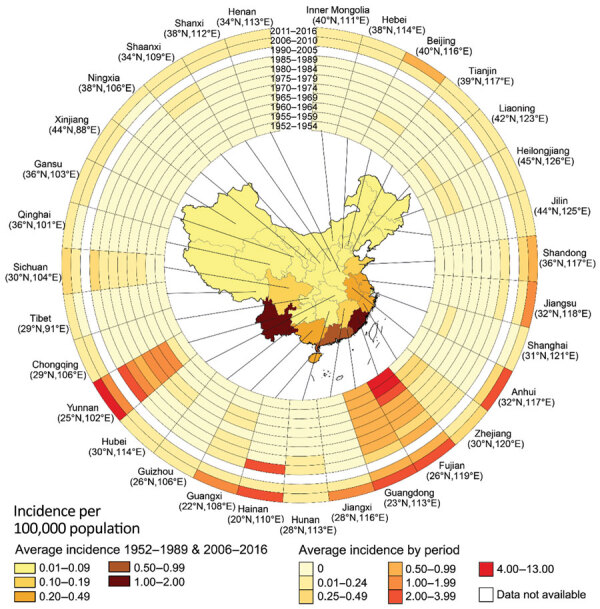
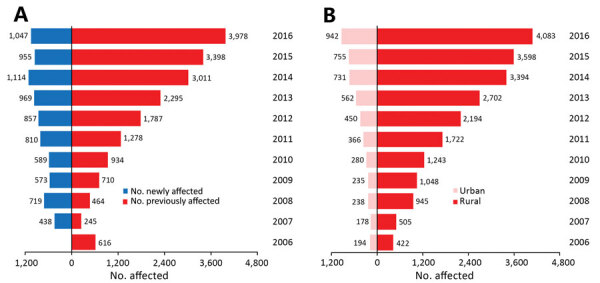
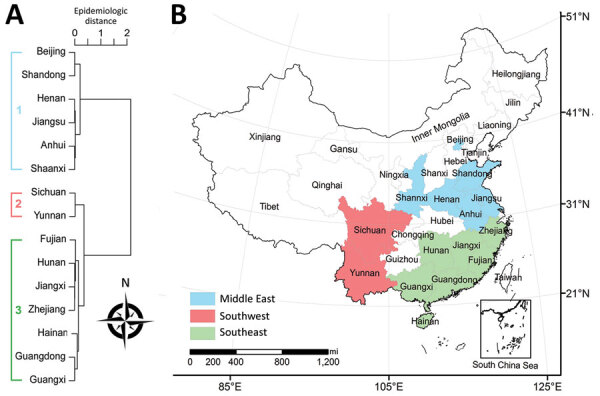
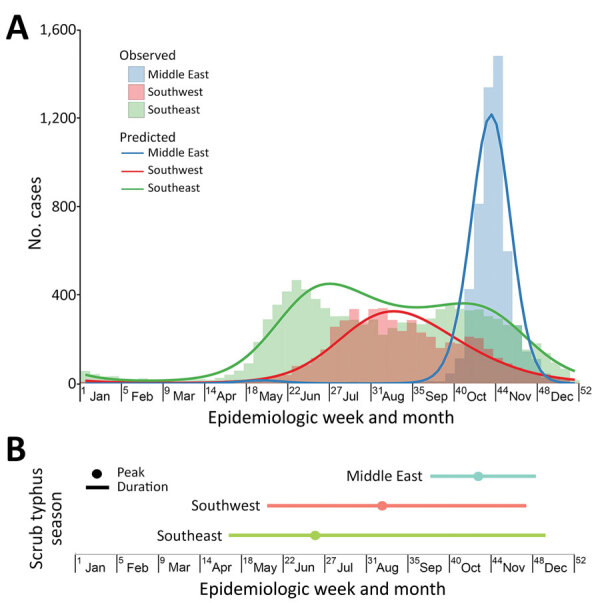
Scrub typhus, a miteborne rickettsiosis, has emerged in many areas globally. We analyzed the incidence and spatial-temporal distribution of scrub typhus in China during 1952-1989 and 2006-2016 using national disease surveillance data. A total of 133,623 cases and 174 deaths were recorded. The average annual incidence was 0.13 cases/100,000 population during 1952-1989; incidence increased sharply from 0.09/100,000 population in 2006 to 1.60/100,000 population in 2016. The disease, historically endemic to southern China, has expanded to all the provinces across both rural and urban areas. We identified 3 distinct seasonal patterns nationwide; infections peaked in summer in the southwest, summer-autumn in the southeast, and autumn in the middle-east. Persons >40 years of age and in nonfarming occupations had a higher risk for death. The changing epidemiology of scrub typhus in China warrants an enhanced disease control and prevention program.

Keywords: China; Orientia tsutsugamushi; bacteria; incidence; scrub typhus; seasons; surveillance; trends; vector-borne infections; zoonoses.


Figures

Figure 1
Figure 1
Reported cases and deaths of scrub typhus in China, 1952–2016. A) Aggregated number of cases by year (red bars), annual incidence rate (blue line), and average annual incidence rate (black dashed line) per 100,000 residents. B) Aggregated number of deaths by year (red bars), case-fatality ratio (blue line), and average annual case-fatality ratio (black dashed line). The data from 1990–2005 are missing because surveillance for scrub typhus was suspended during the period.
Figure 2
Figure 2
Incidence rate of scrub typhus for each province of China during 1952–1989 and 2006–2016, by time period. Annual average incidence of scrub typhus per 100,000 population in the 31 provinces investigated is shown. The rings contain data for 11 periods studied; the innermost ring shows data for early periods of 1952–1954, and the outermost ring data for 2011–2016. The latitude and longitude of the capital city of each province are shown.
Figure 3
Figure 3
Number of townships with scrub typhus cases reported in China during 2006–2016, by year. A) Number of affected townships for each year, divided by those that were affected in previous years (red bars) and those newly affected townships for each year (blue bars). B) Total number of affected townships for each year in rural (red bars) and urban (light pink bars).
Figure 4
Figure 4
Epidemiologic regions of scrub typhus in China, 2006–2016. A) Epidemiologic regions based on hierarchical clustering, using the Pearson correlation coefficient matrix between average weekly scrub typhus time series of paired provinces that had a cumulative number of cases >100 in 2006–2016 combined. B) Map of identified epidemiologic regions identified by hierarchical clustering), e.g., middle-east (latitude range 31°–41°N and longitude range 105°–125°E), southwest (latitude range 21°–31°N and longitude range 95°–105°E), southeast of China (latitude range 21°–31°N and longitude range 105°–125°E). Other provinces had a combined total of <100 cases in 2006–2016.
Figure 5
Figure 5
Seasonal characteristics of scrub typhus in China, 2006–2016. A) The weekly number of scrub typhus in year 2016, with a fitted seasonal curve superimposed, by epidemiologic regions identified. B) Duration and peak of scrub typhus seasons in epidemiologic regions. Scrub typhus season was defined as starting with the week in which a fast increase of average weekly case numbers began and ending with the week that the cumulative case numbers captured in the interval between the start and end accounted for >95% of the reported cases in 2006–2016. The colored dot in each region indicates the week with the highest predicted number of scrub typhus cases in the fitted seasonal curve (the peak). The colored bar indicates the number of weeks between season start and end (duration).

Similar articles

Cited by

References

    1. Walker DH. Scrub typhus—scientific neglect, ever-widening impact. N Engl J Med. 2016;375:913–5. 10.1056/NEJMp1608499 - DOI - PubMed
    1. Taylor AJ, Paris DH, Newton PN. A systematic review of mortality from untreated scrub typhus (Orientia tsutsugamushi). PLoS Negl Trop Dis. 2015;9:e0003971. 10.1371/journal.pntd.0003971 - DOI - PMC - PubMed
    1. Bonell A, Lubell Y, Newton PN, Crump JA, Paris DH. Estimating the burden of scrub typhus: A systematic review. PLoS Negl Trop Dis. 2017;11:e0005838. 10.1371/journal.pntd.0005838 - DOI - PMC - PubMed
    1. Kasper MR, Blair PJ, Touch S, Sokhal B, Yasuda CY, Williams M, et al. Infectious etiologies of acute febrile illness among patients seeking health care in south-central Cambodia. Am J Trop Med Hyg. 2012;86:246–53. 10.4269/ajtmh.2012.11-0409 - DOI - PMC - PubMed
    1. Blacksell SD, Sharma NP, Phumratanaprapin W, Jenjaroen K, Peacock SJ, White NJ, et al. Serological and blood culture investigations of Nepalese fever patients. Trans R Soc Trop Med Hyg. 2007;101:686–90. 10.1016/j.trstmh.2007.02.015 - DOI - PubMed

Publication types

LinkOut - more resources